Environment, Business, and Health Care Prevail: A Comprehensive, Systematic Review of System Dynamics Application Domains
←
→
Page content transcription
If your browser does not render page correctly, please read the page content below
systems
Systematic Review
Environment, Business, and Health Care Prevail:
A Comprehensive, Systematic Review of System
Dynamics Application Domains
Marek Zanker, Vladimír Bureš *                   and Petr Tučník

                                          Faculty of Informatics and Management, University of Hradec Kralove, Rokitanskeho 62,
                                          50003 Hradec Kralove, Czech Republic; marek.zanker@uhk.cz (M.Z.); petr.tucnik@uhk.cz (P.T.)
                                          * Correspondence: vladimir.bures@uhk.cz

                                          Abstract: System dynamics, as a methodology for analyzing and understanding various types of
                                          systems, has been applied in research for several decades. We undertook a review to identify the
                                          latest application domains and map the realm of system dynamics. The systematic review was
                                          conducted according to the PRISMA methodology. We analyzed and categorized 212 articles and
                                          found that the vast majority of studies belong to the fields of business administration, health, and
                                          environmental research. Altogether, 20 groups of modeling and simulation topics can be recognized.
                                          System dynamics is occasionally supported by other modeling methodologies such as the agent-
                                          based modeling approach. There are issues related to published studies mostly associated with
                                          testing of validity and reasonability of models, leading to the development of predictions that are not
                                          grounded in verified models. This study contributes to the development of system dynamics as a

                                   methodology that can offer new ideas, highlight limitations, or provide analogies for further research
Citation: Zanker, M.; Bureš, V.;
                                          in various research disciplines.
Tučník, P. Environment, Business, and
Health Care Prevail: A                    Keywords: system dynamics; systematic review; environment; health; business; causal-loop diagram;
Comprehensive, Systematic Review          stock-and-flow diagram; testing
of System Dynamics Application
Domains. Systems 2021, 9, 28.
https://doi.org/10.3390/
systems9020028                            1. Introduction
                                                System dynamics represents a specific and original methodological approach to the
Academic Editor: Oz Sahin
                                          modeling and simulation of various types of systems. The core concepts of systems think-
                                          ing, such as interconnectedness, feedbacks, adaptive capacity/resilience, self-organization,
Received: 6 April 2021
                                          and emergence [1], are applied in system dynamics with the intention to help people make
Accepted: 20 April 2021
                                          better decisions when confronted with complex, dynamic systems. The field provides a
Published: 21 April 2021
                                          philosophy and tools to model and analyze dynamic systems. Equally important, the field
                                          provides techniques and tools to investigate current decision-making and to help decision-
Publisher’s Note: MDPI stays neutral
with regard to jurisdictional claims in
                                          makers to learn. In comparison to differential and difference equations traditionally used
published maps and institutional affil-
                                          for the representation of dynamic systems, the modeling language of systems dynamics is
iations.
                                          intuitive, and it is common for all kinds of applications, such as in medicine, economics, and
                                          management. This makes system dynamics an ideal tool for multidisciplinary work, and it
                                          makes learning more efficient because basic system structures tend to repeat themselves
                                          from one field of application to another. There are two types of diagrams used in system
                                          dynamics. While causal-loop diagrams are used for qualitative modeling, stock-and-flow
Copyright: © 2021 by the authors.
                                          diagrams are applied in quantitative modeling that leads to the development of models
Licensee MDPI, Basel, Switzerland.
                                          that can be consequently simulated and analyzed. Details related to the notations of both
This article is an open access article
distributed under the terms and
                                          diagrams, their components, applied logic, and both strong and weak points can be found
conditions of the Creative Commons
                                          in the relevant literature [2]. The system dynamics (SD) domain has seen a significant
Attribution (CC BY) license (https://     increase in numbers of applications of SD methods and models in various areas. Since
creativecommons.org/licenses/by/          SD is a well-established methodological approach of modeling and simulation, the range
4.0/).                                    of areas for potential research is gradually increasing, and some of these topics, such as

Systems 2021, 9, 28. https://doi.org/10.3390/systems9020028                                                https://www.mdpi.com/journal/systems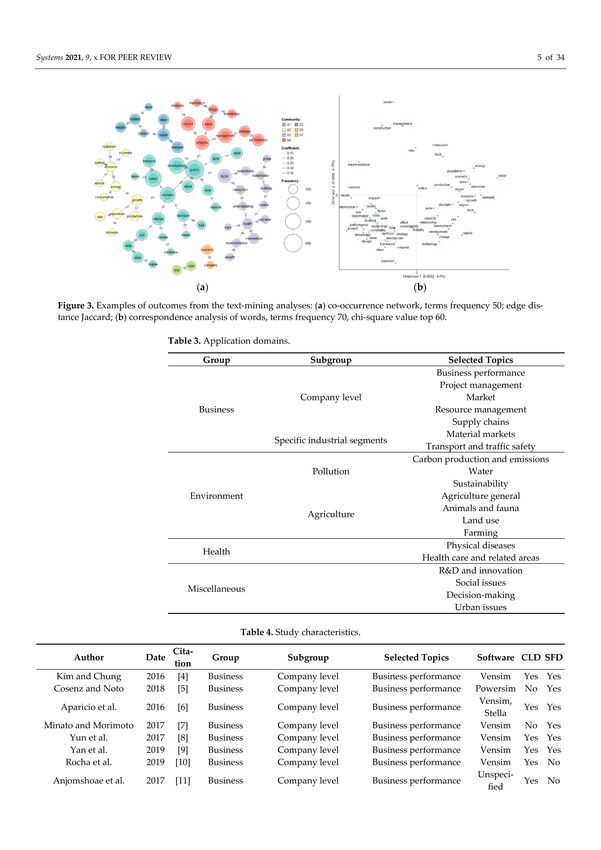
Systems 2021, 9, 28                                                                                           2 of 34

                      water management, the farming industry, and sustainability are currently being prioritized
                      globally. As to date the literature does not include a comprehensive analysis of domains
                      in which SD has been applied as a methodological approach, the main objective of this
                      systematic review is to provide insight into the overall context of SD as an approach for
                      modeling and simulation of various issues. This can help to understand when SD can be
                      chosen as a modeling alternative, identify gaps in application areas, and suggest further
                      steps to make progress in this manner. This systematic review provides a comprehensive
                      overview of contemporary research and shows major application domains. The attention
                      was focused on topical research studies, providing transparent overview of current research
                      trends in the domain of SD. The review also provides pointers toward potential future
                      research areas. It is shown that possible applications lie in a wide selection of domains.
                           This paper is structured as follows. Section 2 describes the systematic review of major
                      application domains in SD, divided into 20 subcategories. Section 3 presents discussion
                      about various types of SD models. The next section describes methodological details and
                      results of the application of the Preferred Reporting Items for Systematic reviews and
                      Meta-Analyses (PRISMA) methodology, and the final section concludes the paper.

                      2. Materials and Methods
                            The first step of the review was the acquisition of a data set that could be used for
                      further analysis. In fact, two approaches can be used. The first approach is based on
                      searching for relevant information resources in databases provided by single publishing
                      houses (Elsevier, Springer, Wiley, etc.). The second approach takes advantage of databases
                      in which selected journals are indexed. Both approaches have their own strong and
                      weak points. For instance, the former provides a more comprehensive data set, while
                      the latter works with journals in which quality is acknowledged by an authority and a
                      community. We found the latter more suitable for the purpose of this study due to the
                      absence of redundant records (see Figure 1 with the PRISMA flowchart). Thus, a search
                      in the Scopus database for published papers was conducted. The object of the search was
                      the concept of SD and its applications in various domains. The main eligibility criteria
                      were English language (i.e., readability and understandability at the global scale); year of
                      publication between 2016 and 2019 (an arbitrary choice intending to highlight recent topics;
                      the search for papers took place during the second half of 2020 and thus 2020 records were
                      considered as incomplete for a yearlong analysis); full-text availability (in order to conduct
                      the content analysis); and usage of SD as a specific methodology Especially due to the
                      last criterion, the search query was intricate, as specific methods for modeling dynamics
                      in engineering and the natural sciences had to be excluded. For instance, the query
                      returned papers dealing with multibody system dynamics in astronomy, modeling of fluid
                      dynamics in hydrodynamics, power system dynamics in the energy industry, and control
                      system dynamics. It is apparent that these and similar fields of research both use different
                      methods and apply different tools, and the concept of SD is formulated in a different
                      methodological context. Eventually, papers from the following Scopus domains were
                      included: environmental science, business, social sciences, decision sciences, economics,
                      medicine, agriculture and the biological sciences, psychology, multidisciplinary studies,
                      health, and nursing.
Systems 2021, 9, 28                                                                                            3 of 34

                      Figure 1. PRISMA flowchart [3].

                           We identified 1163 papers, of which 912 were selected for full-text screening. Alto-
                      gether, 212 papers passed the full-text screening.
                           Grounded in PRISMA results, two types of analyses were conducted—quantitative
                      and the content analysis. The former was based on both the conceptual network analysis
                      of keywords and nouns conducted via VOSviewer, and multidimensional scaling, co-
                      occurrence network, correspondence analysis and the hierarchical clustering conducted
                      in KHCoder. As abstracts contain concepts that are not suitable for text analysis, these
                      had to be excluded. Their list is provided in Table 1. To achieve a trade-off between
                      comprehensibility and complexity of the diagram, all keywords with a minimum number
                      of occurrences equal to nine were included in the developed network presented in Figure 2
                      (VOSviewer). Parametrization of methods applied in KHCoder are presented in Table 2.
                      These details are provided due to potential replication of the analysis and further technical
                      details are not explained. For instance, in the multidimensional scaling, the Kruskal
                      method is considered to be a standard. However, if Kruskal creates a map too difficult
                      to read, the Sammon method can be considered as an alternative as it tries to keep the
                      distances between words from getting crowded. Furthermore, the Jaccard method is used
                      for reckoning distance between words in sparse data. The Jaccard coefficient emphasizes
                      whether or not specific words co-occur. If documents are long and contain many words,
                      other options such as Euclidean distance or Cosine coefficient are at hand. Curious readers
                      can search for methods’ features in relevant information resources.

                      Table 1. Nouns excluded from text mining.

                                                              Type of Word
                         Research-related        SD-related          General concepts without domain associations
                                                                  Examples
                          Methodology            Diagram                               Process
                          Introduction           Dynamics                             Number
                           Discussion              Loop                                 Year
                              Paper              Feedback                               Work
                            Purpose              Behavior                             Approach
                            Objective             Variable                            Problem
                           Literature              Loop                               Research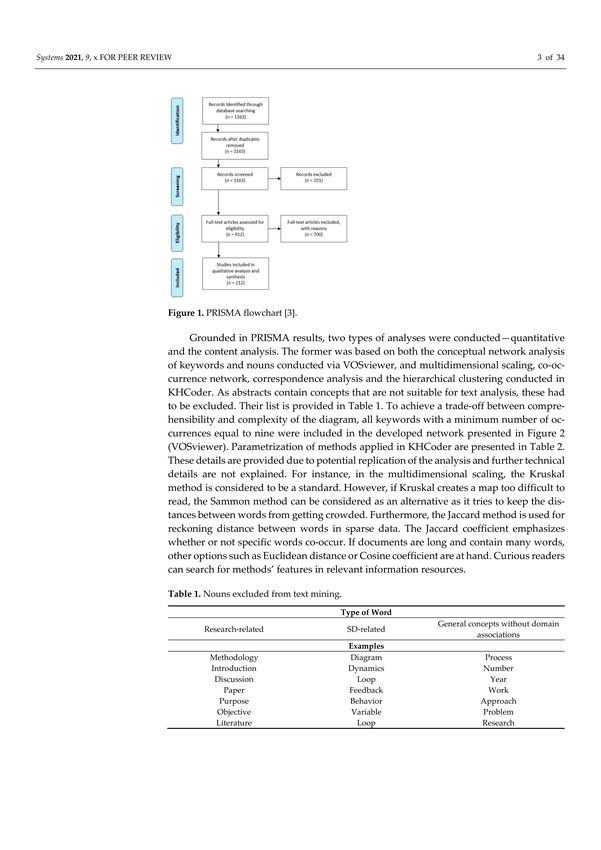
Systems 2021, 9, 28 4 of 34
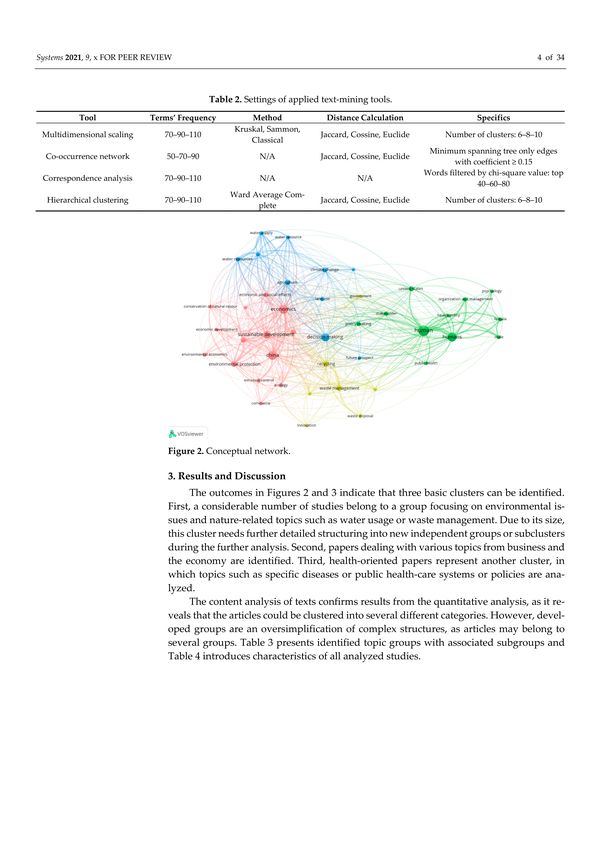
Figure 2. Conceptual network.
Table 2. Settings of applied text-mining tools.
Tool Terms’ Frequency Method Distance Calculation Specifics
Kruskal, Sammon, Jaccard, Cossine,
Multidimensional scaling 70–90–110 Number of clusters: 6–8–10
Classical Euclide
Jaccard, Cossine, Minimum spanning tree only
Co-occurrence network 50–70–90 N/A
Euclide edges with coefficient ≥ 0.15
Words filtered by chi-square
Correspondence analysis 70–90–110 N/A N/A
value: top 40–60–80
Ward Average Jaccard, Cossine,
Hierarchical clustering 70–90–110 Number of clusters: 6–8–10
Complete Euclide
3. Results and Discussion
The outcomes in Figures 2 and 3 indicate that three basic clusters can be identified.
First, a considerable number of studies belong to a group focusing on environmental issues
and nature-related topics such as water usage or waste management. Due to its size, this
cluster needs further detailed structuring into new independent groups or subclusters
during the further analysis. Second, papers dealing with various topics from business and
the economy are identified. Third, health-oriented papers represent another cluster, in
which topics such as specific diseases or public health-care systems or policies are analyzed.
The content analysis of texts confirms results from the quantitative analysis, as it
reveals that the articles could be clustered into several different categories. However,
developed groups are an oversimplification of complex structures, as articles may belong
to several groups. Table 3 presents identified topic groups with associated subgroups and
Table 4 introduces characteristics of all analyzed studies.Systems 2021, 9, 28 5 of 34
Figure 3. Examples of outcomes from the text-mining analyses: (a) co-occurrence network, terms frequency 50; edge
distance Jaccard; (b) correspondence analysis of words, terms frequency 70, chi-square value top 60.
Table 3. Application domains.
Group Subgroup Selected Topics
Business performance
Project management
Company level Market
Business Resource management
Supply chains
Material markets
Specific industrial segments
Transport and traffic safety
Carbon production and emissions
Pollution Water
Sustainability
Environment Agriculture general
Animals and fauna
Agriculture
Land use
Farming
Physical diseases
Health
Health care and related areas
R&D and innovation
Social issues
Miscellaneous
Decision-making
Urban issues
The following sections present examples of topics that were analyzed by authors in
selected studies. The most frequently analyzed issues are selected, and representative
papers are mentioned. Specific values of any quantitative indicators, such as number
of occurrences or ratios, were not used. Rather, rule of thumb was applied to obtain a
reasonable structure and number of topics. Thus, the following paragraphs do not aim to
enumerate the identified studies exhaustively. Only a digest enabling better insight into
the SD environment is provided.Systems 2021, 9, 28 6 of 34
Table 4. Study characteristics.
Author Date Citation Group Subgroup Selected Topics Software CLD SFD
Kim and Chung 2016 [4] Business Company level Business performance Vensim Yes Yes
Cosenz and Noto 2018 [5] Business Company level Business performance Powersim No Yes
Aparicio et al. 2016 [6] Business Company level Business performance Vensim, Stella Yes Yes
Minato and Morimoto 2017 [7] Business Company level Business performance Vensim No Yes
Yun et al. 2017 [8] Business Company level Business performance Vensim Yes Yes
Yan et al. 2019 [9] Business Company level Business performance Vensim Yes Yes
Rocha et al. 2019 [10] Business Company level Business performance Vensim Yes No
Anjomshoae et al. 2017 [11] Business Company level Business performance Unspecified Yes No
Yu et al. 2019 [12] Business Company level Business performance Vensim Yes Yes
Mhatre et al. 2017 [13] Business Company level Project management Vensim No Yes
Wang et al. 2017 [14] Business Company level Project management Vensim Yes Yes
van Oorschot et al. 2018 [15] Business Company level Project management Vensim Yes Yes
Li et al. 2018 [16] Business Company level Project management Vensim Yes Yes
Pargar et al. 2019 [17] Business Company level Project management Vensim Yes Yes
Wang et al. 2019 [18] Business Company level Project management Vensim No Yes
Abbaspour and Dabirian 2019 [19] Business Company level Project management Vensim Yes Yes
Lee et al. 2019 [20] Business Company level Project management Unspecified Yes No
Chung et al. 2016 [21] Business Company level Resource management Vensim Yes No
Škraba et al. 2016 [22] Business Company level Resource management Unspecified Yes No
Kunc and O’Brien 2017 [23] Business Company level Resource management Vensim No Yes
Alizadeh-Zoeram et al. 2019 [24] Business Company level Resource management Vensim Yes Yes
Xing et al. 2019 [25] Business Company level Resource management Vensim Yes Yes
Wang et al. 2016 [26] Business Company level Resource management Vensim Yes Yes
Nair and Anbuudayasankar 2016 [27] Business Company level Supply chain Vensim Yes No
Keilhacker and Minner 2017 [28] Business Company level Supply chain Unspecified Yes No
Cagliano et al. 2017 [29] Business Company level Supply chain Vensim Yes Yes
Zhang 2016 [30] Business Company level Supply chain Vensim Yes Yes
Rawlins et al. 2018 [31] Business Company level Supply chain Vensim Yes No
Choi 2018 [32] Business Company level Supply chain Vensim Yes Yes
Armendáriz et al. 2016 [33] Business Company level Supply chain Vensim Yes No
Chang and Lin 2019 [34] Business Company level Supply chain Unspecified Yes No
Olafsdottir and Sverdrup 2019 [35] Business Company level Supply chain Unspecified Yes No
Bahadir and Akdag 2019 [36] Business Company level Supply chain Vensim Yes Yes
Jin 2019 [37] Business Company level Supply chain Unspecified No Yes
Jeon and Yeo 2017 [38] Business Company level Supply chain Vensim Yes YesSystems 2021, 9, 28 7 of 34
Table 4. Cont.
Author Date Citation Group Subgroup Selected Topics Software CLD SFD
Tong et al. 2019 [39] Business Company level Supply chain Vensim Yes Yes
Choi et al. 2016 [40] Business Specific industrial segments Mineral markets Powersim Yes Yes
Sverdrup 2016 [41] Business Specific industrial segments Mineral markets Stella Yes Yes
Sverdrup and Ragnarsdottir 2016 [42] Business Specific industrial segments Mineral markets Unspecified Yes No
Wang et al. 2018 [43] Business Specific industrial segments Mineral markets Vensim No Yes
Arango-Aramburo et al. 2017 [44] Business Specific industrial segments Mineral markets Vensim Yes No
Liu et al. 2019 [45] Business Specific industrial segments Mineral markets Vensim Yes Yes
Hazra et al. 2019 [46] Business Specific industrial segments Mineral markets Stella No Yes
Sverdrup et al. 2019 [47] Business Specific industrial segments Mineral markets Unspecified Yes No
Zhang et al. 2018 [48] Business Company level Market Vensim Yes Yes
Chung et al. 2018 [49] Business Company level Market Vensim Yes Yes
Gonçalves 2018 [50] Business Company level Market Vensim Yes Yes
Wang, Y. et al. 2019 [51] Business Company level Market Vensim Yes Yes
Wang, J. et al. 2016 [52] Business Company level Market Vensim Yes Yes
Yun et al. 2019 [53] Business Company level Market Vensim Yes Yes
Pasaoglu et al. 2016 [54] Business Specific industrial segments Transport and traffic safety Unspecified Yes No
Azmi and Tokai 2017 [55] Business Specific industrial segments Transport and traffic safety Vensim No Yes
Wen and Bai 2017 [56] Business Specific industrial segments Transport and traffic safety Vensim Yes Yes
Wang 2018 [57] Business Specific industrial segments Transport and traffic safety Vensim Yes Yes
Fontoura et al. 2019 [58] Business Specific industrial segments Transport and traffic safety Vensim Yes Yes
Kim et al. 2019 [59] Business Specific industrial segments Transport and traffic safety Vensim Yes No
Oliveira et al. 2019 [60] Business Specific industrial segments Transport and traffic safety Vensim No Yes
Jeon et al. 2016 [61] Business Specific industrial segments Transport and traffic safety Vensim Yes Yes
Estay-Ossandon and Mena-Nieto 2018 [62] Environment Pollution Pollution Vensim No Yes
Gutberlet et al. 2017 [63] Environment Pollution Pollution Unspecified Yes No
Phonphoton and Pharino 2019 [64] Environment Pollution Pollution Vensim Yes Yes
Sukholthaman and Sharp 2016 [65] Environment Pollution Pollution Vensim Yes Yes
Ardi and Leisten 2016 [66] Environment Pollution Pollution Unspecified Yes Yes
Dasgupta et al. 2017 [67] Environment Pollution Pollution Stella No Yes
Ghisolfi et al. 2017 [68] Environment Pollution Pollution Vensim Yes Yes
Breach and Simonovic 2018 [69] Environment Pollution Pollution Vensim Yes Yes
Nascimento et al. 2018 [70] Environment Pollution Pollution Vensim Yes Yes
Prouty et al. 2018 [71] Environment Pollution Pollution Vensim No Yes
Rinsatitnon et al. 2018 [72] Environment Pollution Pollution Stella No Yes
Sea-lim et al. 2018 [73] Environment Pollution Pollution Stella No YesSystems 2021, 9, 28 8 of 34
Table 4. Cont.
Author Date Citation Group Subgroup Selected Topics Software CLD SFD
Nedelciu et al. 2019 [74] Environment Pollution Pollution Unspecified Yes No
Chinda et al. 2018 [75] Environment Pollution Pollution Stella No Yes
Ding et al. 2016 [76] Environment Pollution Pollution Vensim Yes Yes
Sharma and Vrat 2018 [77] Environment Pollution Pollution Stella Yes Yes
Treadwell et al. 2018 [78] Environment Pollution Pollution Stella No Yes
Xiao et al. 2016 [79] Environment Pollution Emissions and pollution Vensim No Yes
Liu and Xiao 2018 [80] Environment Pollution Emissions and pollution Vensim No Yes
Zhang et al. 2018 [81] Environment Pollution Emissions and pollution Unspecified Yes Yes
Li et al. 2017 [82] Environment Pollution Emissions and pollution Vensim Yes Yes
Freeman et al. 2016 [83] Environment Pollution Emissions and pollution Vensim Yes No
Scolozzi and Geneletti 2017 [84] Environment Pollution Emissions and pollution Vensim Yes No
Navarro and Tapiador 2019 [85] Environment Pollution Emissions and pollution Vensim No Yes
Zhao et al. 2018 [86] Environment Pollution Emissions and pollution Stella No Yes
Liu et al. 2017 [87] Environment Pollution Emissions and pollution AnyLogic No Yes
Scolozzi et al. 2019 [88] Environment Pollution Emissions and pollution Vensim Yes Yes
Bixler et al. 2019 [89] Environment Pollution Emissions and pollution Vensim No Yes
Chiu et al. 2019 [90] Environment Pollution Emissions and pollution Vensim Yes No
Li, J.W. 2019 [91] Environment Pollution Emissions and pollution Vensim No Yes
Li, T. et al. 2019 [92] Environment Pollution Emissions and pollution Vensim Yes Yes
Matthew et al. 2019 [93] Environment Pollution Emissions and pollution Vensim Yes Yes
Cordier et al. 2019 [94] Environment Pollution Emissions and pollution Powersim No Yes
Dianati et al. 2019 [95] Environment Pollution Emissions and pollution Vensim Yes Yes
Tseng et al. 2019 [96] Environment Pollution Emissions and pollution Stella No Yes
da Silva et al. 2019 [97] Environment Pollution Emissions and pollution Vensim Yes No
Ma et al. 2018 [98] Environment Pollution Sustainability Vensim No Yes
Fouseki and Nicolau 2018 [99] Environment Pollution Sustainability Vensim Yes Yes
Kotir et al. 2016 [100] Environment Pollution Sustainability Vensim, Stella Yes Yes
Iandolo et al. 2018 [101] Environment Pollution Sustainability Vensim Yes Yes
Liu et al. 2019 [102] Environment Pollution Sustainability Vensim Yes No
Ulli-Beer et al. 2017 [103] Environment Pollution Sustainability Unspecified No Yes
Wang et al. 2016 [104] Environment Pollution Water Vensim No Yes
Baki et al. 2018 [105] Environment Pollution Water Vensim Yes Yes
Qin et al. 2018 [106] Environment Pollution Water Vensim Yes Yes
Garg et al. 2019 [107] Environment Pollution Water Vensim Yes Yes
Hu et al. 2018 [108] Environment Pollution Water NetLogo No YesSystems 2021, 9, 28 9 of 34
Table 4. Cont.
Author Date Citation Group Subgroup Selected Topics Software CLD SFD
Huang et al. 2019 [109] Environment Pollution Water Vensim No Yes
Jin et al. 2019 [110] Environment Pollution Water Vensim Yes Yes
Li et al. 2019 [111] Environment Pollution Water Vensim Yes Yes
Mahdavi et al. 2019 [112] Environment Pollution Water Vensim No Yes
Su et al. 2019 [113] Environment Pollution Water Vensim No Yes
Zare et al. 2019 [114] Environment Pollution Water Vensim Yes Yes
Bester et al. 2019 [115] Environment Pollution Water Vensim Yes Yes
Cui et al. 2019 [116] Environment Pollution Water Unspecified Yes No
Hosseinzadeh Ghazichaki et al. 2019 [117] Environment Pollution Water Vensim Yes Yes
Shahbazbegian et al. 2016 [118] Environment Pollution Water Vensim Yes No
Pagano et al. 2019 [119] Environment Pollution Water Stella No Yes
Walters et al. 2016 [120] Environment Agriculture Agriculture general Vensim, Stella Yes Yes
Kumari 2017 [121] Environment Agriculture Agriculture general Stella No Yes
Rich et al. 2018 [122] Environment Agriculture Agriculture general Vensim Yes Yes
Ndhleve et al. 2017 [123] Environment Agriculture Agriculture general Vensim No Yes
Banson et al. 2016 [124] Environment Agriculture Agriculture general Vensim Yes No
Cheng et al. 2018 [125] Environment Agriculture Agriculture general Vensim Yes Yes
Kumar et al. 2016 [126] Environment Agriculture Agriculture general Stella No Yes
Matinzadeh et al. 2017 [127] Environment Agriculture Agriculture general Vensim Yes Yes
Gao et al. 2016 [128] Environment Agriculture Agriculture general Vensim No Yes
Hosseinzadeh et al. 2017 [129] Environment Agriculture Agriculture general Vensim Yes No
Gunda et al. 2018 [130] Environment Agriculture Agriculture general Vensim Yes No
Mesgari 2017 [131] Environment Agriculture Agriculture general Vensim No Yes
Kuhmonen 2018 [132] Environment Agriculture Agriculture general Unspecified Yes No
Mokhtar and Aram 2017 [133] Environment Agriculture Agriculture general Vensim Yes Yes
Jin et al. 2016 [134] Environment Agriculture Agriculture general Vensim Yes Yes
Abdulla et al. 2016 [135] Environment Agriculture Animals and fauna Vensim Yes Yes
Dizyee et al. 2017 [136] Environment Agriculture Animals and fauna Vensim, Stella Yes Yes
Molina Benavides et al. 2018 [137] Environment Agriculture Animals and fauna Vensim Yes No
Dizyee et al. 2019 [138] Environment Agriculture Animals and fauna Vensim No Yes
Farrell et al. 2019 [139] Environment Agriculture Animals and fauna Stella No Yes
Godde et al. 2019 [140] Environment Agriculture Animals and fauna Vensim No Yes
Neudert et al. 2019 [141] Environment Agriculture Animals and fauna Vensim Yes No
Tinsley et al. 2019 [142] Environment Agriculture Animals and fauna Vensim Yes Yes
Lie et al. 2018 [143] Environment Agriculture Animals and fauna Stella No YesSystems 2021, 9, 28 10 of 34
Table 4. Cont.
Author Date Citation Group Subgroup Selected Topics Software CLD SFD
Wallentin and Neuwirth 2017 [144] Environment Agriculture Animals and fauna NetLogo No Yes
Crookes 2017 [145] Environment Agriculture Animals and fauna Vensim No Yes
Pérez et al. 2016 [146] Environment Agriculture Animals and fauna Vensim No Yes
Phan et al. 2016 [147] Environment Agriculture Animals and fauna Vensim Yes No
Herrera 2017 [148] Environment Agriculture Animals and fauna Vensim Yes Yes
Rodríguez-Izquierdo et al. 2019 [149] Environment Agriculture Animals and fauna Vensim Yes Yes
Liu et al. 2017 [150] Environment Agriculture Land use NetLogo Yes No
Dang et al. 2017 [151] Environment Agriculture Land use Unspecified Yes No
Sheng et al. 2018 [152] Environment Agriculture Land use Vensim No Yes
de Freitas et al. 2018 [153] Environment Agriculture Land use NetLogo No Yes
Park and Park 2018 [154] Environment Agriculture Land use Stella Yes Yes
Sanga and Mungatana 2016 [155] Environment Agriculture Land use Stella No Yes
Lim et al. 2017 [156] Environment Agriculture Land use Vensim Yes No
Yurike et al. 2018 [157] Environment Agriculture Land use Unspecified Yes No
Nazir and Ahmad 2018 [158] Environment Agriculture Land use Stella Yes Yes
Forero Montaña et al. 2019 [159] Environment Agriculture Land use Stella No Yes
Fuglestad and Palmer 2019 [160] Environment Agriculture Land use Stella Yes Yes
Tan et al. 2019 [161] Environment Agriculture Land use Vensim No Yes
Pande and Savenije 2016 [162] Environment Agriculture Farming Unspecified Yes No
Von Loeper et al. 2016 [163] Environment Agriculture Farming Vensim Yes Yes
Lie and Rich 2016 [164] Environment Agriculture Farming Vensim Yes Yes
Koláčková et al. 2017 [165] Environment Agriculture Farming Vensim Yes Yes
Ha et al. 2017 [166] Environment Agriculture Farming Vensim Yes No
Kopainsky et al. 2017 [167] Environment Agriculture Farming Vensim Yes No
Kopainsky et al. 2019 [168] Environment Agriculture Farming Vensim Yes No
Sjaifuddin et al. 2019 [169] Environment Agriculture Farming Powersim Yes Yes
Sugiyama et al. 2017 [170] Health Physical diseases Vensim No Yes
Rogers et al. 2018 [171] Health Physical diseases Stella Yes Yes
Chen et al. 2018 [172] Health Physical diseases Unspecified Yes No
Carrete et al. 2017 [173] Health Physical diseases Stella No Yes
Liu et al. 2016 [174] Health Physical diseases Vensim No Yes
Jalali et al. 2019 [175] Health Physical diseases Vensim Yes Yes
Safarishahrbijari et al. 2017 [176] Health Physical diseases Unspecified No Yes
Powell et al. 2018 [177] Health Physical diseases Vensim Yes No
Kianmehr et al. 2019 [178] Health Physical diseases Vensim No Yes
van Ackere and Schulz 2019 [179] Health Physical diseases Vensim No YesSystems 2021, 9, 28 11 of 34
Table 4. Cont.
Author Date Citation Group Subgroup Selected Topics Software CLD SFD
Cruz et al. 2019 [180] Health Physical diseases Vensim, Stella Yes Yes
Renmans et al. 2017 [181] Health Health care and related areas Vensim Yes No
Hilmola and Henttu 2016 [182] Health Health care and related areas Vensim Yes No
Best et al. 2016 [183] Health Health care and related areas Unspecified Yes No
Ishikawa et al. 2017 [184] Health Health care and related areas Stella Yes Yes
Jetha et al. 2016 [185] Health Health care and related areas Vensim No Yes
Farid et al. 2019 [186] Health Health care and related areas Vensim Yes Yes
McAvoy et al. 2019 [187] Health Health care and related areas Vensim Yes No
Morgan et al. 2019 [188] Health Health care and related areas Vensim Yes No
Zhang et al. 2019 [189] Health Health care and related areas Vensim No Yes
Luna-Reyes et al. 2018 [190] Health R&D and innovation Vensim No Yes
Wang 2019 [191] Miscellaneous R&D and innovation Vensim Yes Yes
Lansu et al. 2019 [192] Miscellaneous R&D and innovation Vensim Yes No
Lee 2019 [193] Miscellaneous R&D and innovation Unspecified Yes No
Mendes and Aleluia 2019 [194] Miscellaneous R&D and innovation Vensim No Yes
Mobus 2018 [195] Miscellaneous R&D and innovation Unspecified No Yes
Howard and Thompson 2016 [196] Miscellaneous R&D and innovation Unspecified Yes No
Davies et al. 2016 [197] Miscellaneous Social issue Vensim Yes No
Carvalho et al. 2018 [198] Miscellaneous Social issue Vensim Yes No
Stringfellow 2017 [199] Miscellaneous Social issue Vensim Yes Yes
Hossain et al. 2017 [200] Miscellaneous Social issue Stella Yes No
Givens et al. 2018 [201] Miscellaneous Social issue Vensim Yes No
Ford and White 2019 [202] Miscellaneous Social issue Vensim Yes Yes
Zhu and Liu 2017 [203] Miscellaneous Social issue Vensim Yes Yes
Ibáñez and Martínez-Valderrama 2018 [204] Miscellaneous Decision-making Vensim Yes No
Zabid and Abidin 2017 [205] Miscellaneous Decision-making Vensim Yes Yes
Macmillan et al. 2016 [206] Miscellaneous Decision-making Vensim Yes No
Yan 2018 [207] Miscellaneous Decision-making Vensim No Yes
Bao and He 2019 [208] Miscellaneous Urban issues Vensim Yes Yes
Fang et al. 2019 [209] Miscellaneous Urban issues Vensim No Yes
Li, G. et al. 2019 [210] Miscellaneous Urban issues Vensim Yes Yes
Li, Y. et al. 2019 [211] Miscellaneous Urban issues Vensim Yes No
Liu et al. 2019 [212] Miscellaneous Urban issues Stella No Yes
Shrubsole et al. 2019 [213] Miscellaneous Urban issues Vensim Yes No
Sing et al. 2019 [214] Miscellaneous Urban issues Vensim Yes Yes
Moradi et al. 2019 [215] Miscellaneous Urban issues Vensim Yes YesSystems 2021, 9, 28 12 of 34
3.1. Business
3.1.1. Business Performance
The dynamics of social capital and business performance were described in [4]; in
this schema, the discovery of the simulation included the prediction of organizational
capacity, market competitiveness, innovation capacity, cost, competitiveness, operational
performance, financial performance, relationship commitment, and trust. SD was used
for experimenting with new business venture strategies, and the results of the simulation
were the prediction of the cost of customer acquisition and customer lifetime value [5].
SD was used for the Colombian business cycle, and the outcomes of the simulation were
represented by five predictions of GDP of Colombia [6]. The coexistence of airlines and
airports was described in [7], and the results of the simulation were the prediction of
airline and airport financial stocks. SD was used for the growth of a platform business;
the findings of the simulation were the prediction of revenue for Apple and Android, as
well as hotel and bookings revenue [8]. To enhance decision-making processes during
e-business innovations, SD models were used to analyze performance and the impacts of
decisions [9]. A combination of knowledge-based system for decision support, manage-
ment flight simulations, and SD models allowed better resource allocation and improved
managerial decision-making rationale during e-business innovation projects. Results can
be applied to agile IT project management as well. Rocha et al. [10] focused their research
on economic performance using cluster policies. A theoretical model based on SD princi-
ples was developed. The results showed that even clusters that have positive economic
performance can be mitigated by negative social feedback. The results have the potential
to influence policy making in a positive way, to improve the cohesion relationship between
economic and social performance factors. Performance management was discussed in [11],
where causal loop diagrams (CLDs) were used to capture critical variables of beneficiaries
and the perspectives of donors, internal processes, earning and innovation, and finance. Yu
et al. [12] presented an SD model named the industry-effect policy to analyze environmen-
tal and economic effects of eco-industry. The stock-and-flow diagram (SFD) captures blast
furnace gas, calcium carbide furnace gas, submerged arc furnace gas, coke furnace gas,
and policy-preferential industrial sectors. Outputs of the simulation were the prediction
of the impact of presented policies, and the demand for selected gas up to the year 2030.
The model also allowed an analysis of the regulation options for industrial sectors seeking
transformation toward eco-industry.
3.1.2. Project Management
Several papers have been written with a focus on projects. In relation to an Indian
construction project, Mhatre et al. [13] were able to predict risk factors for 12 months by
instantaneous risk variables. Project implementation under uncertainty with a focus on
usage and simulation of available data can be used for the prediction of expected and
realized value [14]. The authors also focused on new product development projects that
exhibited the possibility of predicting the new product’s profitability [15]. The impact
of labor controls on large complex projects was presented in [16]. Results of the simula-
tion were the prediction of project progress. CLDs were used in the domain of project
management. Pargar et al. [17] showed an application of CLD when managing a project
alliance. All participating parties are required to share risks, make unanimous decisions,
and work efficiently together. Research was focused on four value creation processes: work
progression, rework, redesign and innovation, and rescheduling. CLD proved to be an
efficient tool in discovering the interrelationships among these core processes, allowing the
development of the stock and flow model of the SD. Another study [18] that was similarly
focused on project portfolio management showed the use of SD models with emphasis on
dealing with uncertainty and interdependencies. Handling a project portfolio is naturally a
more challenging task than managing individual projects, but SD tools have been proven
to be efficient support tools in visualizing portfolio structure and behaviors under various
conditions. A study by Abbaspour and Dabirian [19] used SD models for assessmentSystems 2021, 9, 28 13 of 34
of different labor hiring policies for construction projects. The resulting models can be
used for managerial decision support and to help identify efficient allocation of human
resources. For construction projects, human resource management is crucial because it is
closely related to the relative costs of implementing construction projects. Especially im-
portant in this context is estimation and supply of the project labor required. Policies were
divided into two categories: those based on time (hiring intervals) and those based on labor
(work crew) composition. A paper of Lee et al. [20] focused on the economic feasibility of
apartment development projects. System dynamics was used in the model using a case
study with a 1794-unit development project. The model was able to forecast, control, and
manage various risk factors and simulate their impact, even if they dynamically change
during the development project.
3.1.3. Resource Management
In this realm we identified papers focused on resource mapping used for capturing
critical-variable human resource development [21], human resource planning for capturing
critical variables of organizational human resources [22], or resource mapping, which
provided predictions for IN-store café shops and revenues of i-store café shops [23]. Human
resource dynamics is also important in medical services, where the phenomenon of a so-
called “death spiral of quality” sometimes occurs. As stated by Alizadeh-Zoeram et al. [24],
it is mostly a lack of systemic thought that considers the feedback relationships between
numerous effective variables in the system performance. SFD and CLD were used to model
human resources service capacity in a hospital clinic environment as a case study. The
relationships among the economy, resources, and the environment were studied with SD
models by Xing et al. [25]. Outputs of the simulation were the prediction of GDP, energy
consumption, chemical oxygen demand, sulfur dioxide accumulation, solid waste, and
population up to the year 2028 under seven different scenarios. Project managers’ encounter
was explored in [26], who presented results of the simulation use for the prediction of an
adaption rate. There were also other topics in this group dealing with the performance
management approach, apartment brand management, and risk management.
3.1.4. Supply Chain
The benefits of information and communication technologies (ICT) in supply chain
management were researched in [27], where CLD was used to capture the critical vari-
able of inventory control. SD was used for supply chain risk management of rare earth
elements [28], e-grocery [29], closed-loop supply chain finance risk [30], service value
chain [31], and mobile value chain [32]. The study of Armendáriz et al. [33] used SD for
analysis of food supply chains, in order to achieve a sustainable agricultural system. In the
study, the authors identified a set of critical factors having significant impact on sustainabil-
ity and resilience of the agricultural production and distribution systems. Another research
study with a similar aim was presented by Chang and Lin [34]. The attention was focused
more on logistics aspects of the supply chain, such as a supplier’s replenishment lead time
or the impact of various disruptive events. The functioning of food supply chains from a
market mechanics perspective was studied by Olafsdottir and Sverdrup [35]. Models used
causal links, and dynamic feedback was used to parametrize price functions on selected
food markets. Results allowed the optimization of supply chain models parameters. The
system dynamics model of Bahadir and Akdag [36] was used for optimizing transportation
planning. The model works with container capacity, shipping and planning processes,
warehouse capacity for expansion, and container lifetime. The simulation model improved
the prediction of container fleet size and resource use rate, with a focus on the tactical level
of container transportation. An aspect of sharing information among partners within the
supply chain was studied in [37]. CLD compared cases of supply chains with and without
information sharing. Four different scenarios were considered, and results of the simulation
showed that sharing customer demand information is generally better than sharing retailer
sales, and information sharing improves supply chain flexibility and allows optimizationSystems 2021, 9, 28 14 of 34
of inventory levels. The timing of ship orders was discussed in [38]. CLD captured the
supply and demand of ship transportation in China. Results of SFD simulation were the
optimal prediction timing for a ship order placement, price of new container ships, and
price of second-hand container ships. Based on outputs from the simulation, three optimal
timing scenarios were developed for ship order placement. The paper of Tong et al. [39] is
focused on the research of consumers’ environmental preferences. Retailer-led supply was
used in an evolutionary game used to examine the behavior of consumers and retailers.
The simulation results showed that there is a preference for low-carbon products. The
study suggests that retailers’ and manufacturers’ strategy should be adjusted accordingly
to adapt to consumers’ environmental preferences and maintain sustainable production in
the long-term perspective.
3.1.5. Mineral Markets
Several papers related to the markets with minerals have been published focusing on
indium [40], lithium [41], platinum group metal [42], coal [43], gold, and limestone [44]. The
paper [45] is focused on supply and demand dynamics of trading with lithium. The study
focused on factors influencing trends in market prices, namely the emergence of renewable
energy technologies such as electric energy storage and new energy vehicles. Results
indicated a significant future role for electric energy storage and suggested measures to
handle supply shortages and import risks. Another practical application of a SD model
in the mining industry was presented by Hazra et al. [46]. The paper focused on Indian
iron ore mining, more specifically real option valuation of the ore deposits. The planning
processes require estimation of many parameters, as it is difficult to obtain or predict exact
values during the preparation phase for the long-term mine plan. An SD model works
with various stochastic parameters and has been proven to be a viable and more efficient
alternative to more traditional methods. Outputs of the simulation were the prediction
of iron ore price, extraction rate, and the production of iron ore for 15 years. Another
application of SD models in the mining industry is focused on sustainable production
of copper, zinc, and lead [47]. The model was used for the estimation of market price
movements rather than production itself. The model showed that market prices are
expected to rise in the following decades (approximately up to the end of the 22nd century)
and become more volatile. The study showed the importance of policy changes regarding
resource efficiency and resource conservation, and advocated for strong policies to promote
the recycling of metals.
3.1.6. Market
Chinese urban housing markets were analyzed though SD. In [48], the authors de-
veloped a simulation model that enables the prediction of housing prices. The impact of
deregulation on the price of rice in Malaysia was simulated in [49], which enables predic-
tion of the wholesale price, paddy rice price, paddy production, rice production, and rice
demand. Demand bubbles were researched in [50]; the main outcomes of simulations in-
cluded the prediction of backlog, shipments, and capacity, delivery delay, and cancelations.
Y. Wang et al. [51] analyzed power-grid financial capacity in China. SFD captured electricity
sales, transmission and distribution costs, and revenue, profit, financing, and depreciation.
Outputs of the simulation were the prediction of electricity sales, electricity purchase,
and transmission capacity up to the year 2025. Juite Wang et al. [52] analyzed Taiwan’s
mobile application market. Based on the analysis, the authors created CLD focused on
developers and customers. The authors then constructed SFD and one base scenario, and
two specific scenarios for simulations; the simulation’s main findings were the prediction of
download share and app share. Yun’s paper [53] focused on market growth, investigating
the difference between already established and newly appearing market-based emerging
industry. The simulation results were the prediction of the technological market under
several different scenarios for 10 years. The paper shows that advanced business modelsSystems 2021, 9, 28 15 of 34
are highly important for a converted industry, especially for fast and substantial growth of
the initial market.
3.1.7. Transport and Traffic Safety
There are various studies focusing on transport-related topics. Scenarios of the light-
duty vehicle road transport sector were presented in [54]. Acquired simulation outcomes
were used for prediction of new sales market share, the evolution of average real-world
WtW CO2 emissions, and EU energy consumption. The future of electric vehicles in
Malaysia was presented in [55], which enables prediction of new vehicle registration.
The case study of traffic policy for Beijing was described in [56]. The presented results
of the simulation helped with the prediction of carbon emissions created by vehicles,
vehicles energy consumption and variation of the type of vehicles. Another Beijing-based
study investigated taxi management in this city. Results were useful for the prediction of
attraction coefficient, service level, empty-loaded rate, daily carrying frequency per taxi,
total demand for 120 h, empty, loaded rate, and total demand [57]. Fontoura et al. [58]
focused on Brazilian urban mobility policy, with a case of São Paulo. SFD and CLD captured
the Brazilian urban transport system. Outputs of the simulation were the prediction of
usage of public transport, level of policy implementation, and the amount of CO2 under
three different scenarios for 30 years. Kim, Lee, and Ahn [59] dealt with the transition to
aviation biofuel in the socio-technical perspective. CLD captured the interaction between
the aviation regime and the biofuel niche. Oliveira et al. [60] focused on the diffusion of
alternative fuel vehicles. SFD captured the process of choosing new vehicles. Outputs of
the simulation were the prediction of the market of alternative fuel vehicles up to the year
2053. Safety ship policy recommendations were made for Korea. The simulation model
was used for the prediction of ship accidents, ship safety, and marine safety [61].
3.2. Environment
3.2.1. Pollution
The sample of research papers contains various papers focused on environmental
pollution. Although not presented here as one specific domain, waste-related papers can be
found with a focus on several types of waste such as solid waste [62–65], e-waste [66–68],
liquid waste [69–71], paper recycling [72], steel [73] or phosphorus in urban wastewater [74],
construction waste [75,76], and food waste [77,78].
3.2.2. Emissions and Pollution
Several articles about the carbon emission target in China have been published. The
first paper targeted the year 2020, and the results of the scenarios were the predictions of the
consumption of mineral resources, electrical energy generation, and carbon emission [79].
The second paper had a target of 2025. The outcomes of the simulation were the prediction
of coal, oil, natural gas, hydropower, nuclear power, wind power, GDP, population, and
the production of carbon emissions [80]. The third paper had a target of 2030, and the
results of the simulations were the prediction of carbon emissions and carbon emissions
intensity [81]. The target of greenhouse gas until 2030 in China was described in [82]; the
results of the simulation were the prediction of exports, carbon emission intensity, energy
intensity, and household welfare. SD has been used to revisit Jevons’ paradox; the outputs
of the simulation were the prediction of carbon emissions per person, non-freight travel,
fleet efficiency, and cost of the road [83].
Emissions in the anthroposphere were described in [84], where CLD was used to
capture a critical-variable climate change paradigm. Navarro and Tapiador [85] focused
on rural socioeconomic issues and reasons for rural migration. SFD and CLD were made
from modules: economic, social, demographic, and attractiveness. The authors created 36
scenarios. The main findings were these: small villages may be incapable of producing
economic development; and education, health, and public infrastructure are the most rele-
vant services that help to retain the population. Carbon-labeled products were discussedSystems 2021, 9, 28 16 of 34
in [86]; the results of the simulation were the prediction of the probability of customers
buying a product, and the probability of enterprise labeling. Low-carbon products were
discussed in [87], where SFD was used as part of the hybrid model related to consumer
and low-carbon products. Scolozzi, Schirpke, and Geneletti [88] focused on ecosystem
services management. SFD and CLD captured regeneration and extraction of resources,
and environmental quality. Outputs of the simulation were the prediction of environmental
quality and the number of visitors under three different scenarios for 20 years. Bixler
et al. [89] focused on life cycle assessment of green infrastructures. SFD captured catchment
area and green infrastructure. Chiu et al. [90] focused on the impact of the change of
coastal land use in the Chiku coastal zone in Taiwan on regional carbon balance. The
authors created CLD to capture the main feedback loops of land-use change. Outputs of
the simulation were the prediction of the creation and absorption of carbon dioxide up
to the year 2070. Li [91] focused on the greenhouse effect. SFD and CLD captured the
CO2 cycle. Outputs of the simulation were the prediction of the total amount of CO2 for
50 years under several different scenarios. Li, Liu, and Zhang [92] focused on economic
transformation and environmentally coordinated development. SFD and CLD captured
the economy, energy consumption, carbon emissions, and social development. Outputs
of the simulation were the prediction of asset investment, GDP, energy consumption, and
CO2 emissions under three different scenarios up to 2029. Matthew et al. [93] focused on
low carbon usage on island systems. SFD and CLD captured electricity systems on an
isolated island. Outputs of the simulation were the prediction of renewables’ aggregated
capacity, fossil generation capacity, and energy storage capacity up to 2050. Cordier and
Uehara [94] dealt with the impact of innovation and policies on the amount of plastic in
oceans. Outputs of the scenarios were the prediction of the amount of plastic in oceans
up to 2030 under several different scenarios. Dianati et al. [95] investigated air pollution
created in Nairobi’s slums. The authors used CLD to capture the main driving forces of
household air pollution. Outputs of the simulation were the prediction of household air
pollution and coverage of clean appliances up to 2039 under several different scenarios.
Tseng, Lee, and Chen [96] explored hexavalent chromium concentration in water. SFD
captured the relationships among river water, sediment, and soil. Outputs of the simulation
were the prediction of the amount of hexavalent chromium in river water, sediment, and
soil for 15 years. Da Silva et al. [97] applied SD as one step in the prevention of natural
disasters. The authors used CLD to capture the dynamics of the main driving factors in
disasters (e.g., risk analysis, and losses and damages).
3.2.3. Sustainability
SD was used for technology related to sustainable development; the findings of
the simulation were the prediction of the value of soil testing and a comparison of the
production of new phosphate fertilizer and traditional phosphate fertilizer [98]. SD was
used for sustainable lifestyles, where CLD and SFD were used to capture key variables of
sustainable heritage-led regeneration [99]. SD was used for sustainable water resources,
and the outputs of the simulation were the prediction of crop yield, agricultural water
demand, net-farm income, domestic water demand, total population, and industrial water
demand [100]. SD was also used to define sustainable value; CLD and SFD were used to
capture key variables of sustainable value [101]. P. Liu et al. [102] analyzed narrow energy
performance gaps. CLD captured energy consumption gaps in general. SFD was applied to
a specific case in China. The main conclusions were these: (1) facility managers should pay
less attention to austerity occupants; and (2) facility managers should pay more attention
to standard occupants to enhance their energy-saving awareness. In [103], socio-technical
transitions were presented in the case of specific energy transition, where CLD was used to
capture key variables related to self-consumption communities.Systems 2021, 9, 28 17 of 34
3.2.4. Water
SD has seen use for models of drinkable water. Articles have mainly been focused on
distribution, demand, and usage of water. For instance, SD was used to capture irrigation
water demand in Baojixia, China [104], water demand in urban areas [105], and water
demand for megacities [106].
Garg and Azad [107] focused on Cauvery water-sharing awards. SFD and CLD
captured allocations of the Analytical Framework Model. Outputs of the simulation
were the prediction of the allocation of water and water availability. Hu et al. [108]
focused on food, water, and energy systems in sustainable resources management. SFD
captured the usage of water. Outputs of the simulation were used for the prediction of
reservoir water storage under several different scenarios for 12 months. Huang et al. [109]
focused on the impact of water regulations on environmental water stress. SFD captured
resources dependent on water (e.g., rice, wheat, cotton). Outputs of the simulation were
represented by the prediction of the water stress index. Jin et al. [110] focused on sustainable
development of water, energy, and food in China. SFD and CLD captured water, energy,
and the food system. The prediction of the consumption of water, energy, and food under
several different scenarios up to the year 2026 were the main simulation outputs. Li
et al. [111] investigated change in the drought-limited water level of a reservoir. SFD and
CLD captured the usage and accessibility of water. Outputs of the simulation were used for
the prediction of the amount of water demand, desalinated seawater, shallow groundwater,
and deep groundwater up to 2020. Mahdavi, Bagheri, and Hosseini [112] focused on water
for an integrated assessment. SFD captured the main variables related to saltwater and
inland water resources and their usage. Outputs of the simulation were the prediction of
agriculture crop area, agricultural employment, agricultural consumption, and the level of
groundwater. Su, Gao, and Guan [113] focused on water security systems in Japan. SFD
captured the economy, population, water resources, the water environment, and water
disasters. Zare et al. [114] explored an integrated water resource. SFD and CLD captured
population, land use, and water resources. Outputs of the simulation were the prediction
of the consumption of water by urban, agriculture, and vegetation area, and agricultural
GDP under different scenarios for 35 years. Bester, Blignaut, and Crookes [115] focused on
the economic lifespan of the proposed Ntabelanga and Laleni dams in South Africa. SFD
and CLD captured the main variables related to dams. Simulation outputs were used for
the prediction of environmental degradation. Cui et al. [116] focused on social economy
and the water environment in a case study of Kunming. CLD captured socioeconomic
issues and the water environmental system. Outputs of the simulation were the prediction
of population, water consumption, and GDP up to 2024. Hosseinzadeh Ghazihaki and
Monem [117] focused on irrigation networks. SFD captured the control systems of irrigation.
SD was used to analyze the hydro politics of the Helmand transboundary river. CLD was
used to capture critical variables related to the hydro environment [118]. Pagano et al. [119]
explored risk reduction. SFD captured the main variables related to the flood. Outputs of
the simulation were the prediction of primary impacts, socio-institutional dynamics, and
land use under several scenarios for 50 years.
3.2.5. Agriculture
As the quantitative analysis suggests, agriculture-related studies have used SD as a
modeling approach quite often. Various topics such as agricultural production systems
have been explored with the help of both types of diagrams associated with SD.
In [120], both CLDs and stock-and-flow diagrams were used to capture critical vari-
ables of economics, crop production, environmental quality, livestock production, and
social quality. A case study of economic development driven by agricultural growth in
the Patna Region of India was presented in [121]. The results of the simulation were a
prediction of population, population density, income per capita, agricultural outputs, and
GDP. SD was used for urban and peri-urban agriculture planning; CLD and SFD were used
to capture critical-variable organic urban farming in Christchurch [122]. A case study fromSystems 2021, 9, 28 18 of 34
Cape Province in South Africa was focused on public spending on agriculture and poverty,
with findings of the simulation being the prediction of poverty [123]. A case study from
Ghana presented drivers and barriers for sustainable agriculture; CLD and SFD were used
to capture critical-variable livestock systems, fishery systems, horticultural systems, and
agricultural systems of Africa [124]. Another case study focusing on sustainable agriculture
was from the Three Gorges Reservoir region of China, where outputs of the simulation
were the prediction of the poverty level, sewage discharge, human disease, forest area,
earthquake frequency, crop yield, use of fertilizers, use of pesticides, crop disease, and
cultivated land [125]. Three papers were devoted to nitrogen dynamics in soil [126]: find-
ings of the simulation of the first paper were the prediction of Detritus-N concentration
data; in the second paper a prediction of the drainage rate, NO3 drainage water, and NH4
drainage water [127]; and the third paper featured the prediction of oxidized N deposition,
fertilizer N application, net food and feed N imports, and agricultural N fixation [128].
Two papers were focused on irrigation. The first one was in the view of hydromechanical
gates, where CLD was used to capture the critical variable of control systems in irrigation
networks [129]. The second paper was focused on sociocultural feedbacks for the irrigation
system; CLD was used to capture the critical variable of acequia mutualism [130]. Policy
recommendations for the agricultural system in Iran were presented in [131]; the discovery
of the model can be summarized as the economical and agricultural indicators. The future
of wicked problems was addressed by the common agricultural policy; CLD was used
to capture critical variables related to common agricultural policy [132]. A case study
of agricultural groundwater management on the Firuzabad Plain in Iran was presented
in [133], where results of the simulation were the prediction of groundwater level and
benefit to farmers. The impact of land consolidation in China was analyzed in [134]; here,
the discoveries of the simulation were the prediction of agriculture labor transfer, the
secondary and tertiary industry labor, regional GDP, and social conflict.
3.2.6. Animals and Fauna
SD has been used for analysis of the beef sector. Beef cattle production in Malaysia
was investigated in [135]. The potential of policies focused on the beef sector in Botswana
was explored by [136]. Findings of the simulation were represented by the prediction
of total cattle population, adult cattle price, weaner price, producers’ profit, Botswana
meat commission gross profit, feedlots profit, traditional butchers’ profit, and modern
butchers and retailers. Description of heat stress in dairy cows was done in [137], where
CLD was used to capture critical variables of cow dynamics in heat conditions. The SFD
was used to study the impact of policy interventions in the smallholder dairy value chain
in Tanzania [138]. Results indicated a negative impact of both short-term (1 year) and
medium-term (5 year) policies on income due to the higher cost of artificial insemination of
local-breed cows. The simulation model captured milk production, profit, and consumption
rates of milk up to the year 2034. Another study on flock productivity focused on the
development of sheep and beef farms in New Zealand [139]. Changes in the value of meat
and wool caused a shift of production focus from wool production to sales of animals for
slaughter. A SD model was constructed to estimate the quality of sheep and beef farm
production, income from sheep sales, and the wastage rate of stock in the timeframe of
30 years. Godde et al. [140] focused on the impact of climate change on grazing herds,
with a case study from Australian rangelands. SFD captured forages biomass and cattle
population. Outputs of the simulation were the prediction of standing dry matter, animal
stocking rates, and precipitation under several different scenarios for 30 years. Neudert
and Salzer [141] applied system archetypes on common village pasture problems in the
South Caucasus. The tragedy of the commons, the shifting of the burden, and the success
of successful archetypes were used. Tinsley et al. [142] focused on cow herd dynamics. SFD
captured the life cycle of cattle. Outputs of the simulation were the prediction of several
mature cows, forage consumption, the cost of a cow, and net income for 121 months. An
empirical evaluation of policy options for development in Nicaragua was done by SDA;You can also read