Environmental Assessment Update (2021) of Multiklient Invest Newfoundland Offshore Seismic Program, 2018-2023 - Multiklient Invest AS
←
→
Page content transcription
If your browser does not render page correctly, please read the page content below
Environmental Assessment Update (2021)
   of Multiklient Invest Newfoundland
 Offshore Seismic Program, 2018–2023

                   Prepared by:

                   Prepared for:

           Multiklient Invest AS

                    May 2021
             LGL Report No. FA0223-02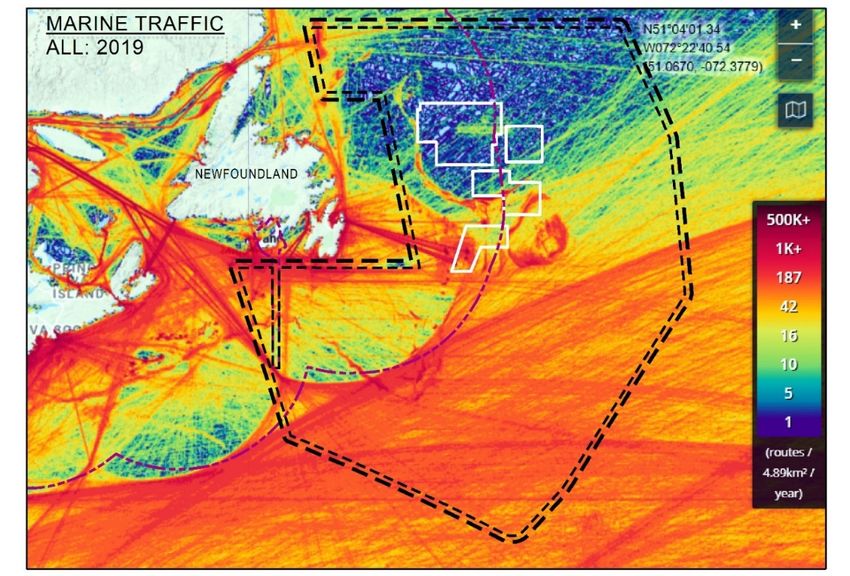
Environmental Assessment Update (2021)
  of Multiklient Invest Newfoundland
  Offshore Seismic Program, 2018–2023

                      Prepared by

     LGL Limited, environmental research associates
                 P.O. Box 13248, Stn. A
                St. John’s, NL A1B 4A5
                    Tel: 709-754-1992
                   vmoulton@lgl.com

                      Prepared for

                  Multiklient Invest AS
             Lilleakerveien 4C, P.O. Box 251
              Lilleaker, 0216, Oslo, Norway

                      May 2021
               LGL Report No. FA0223-02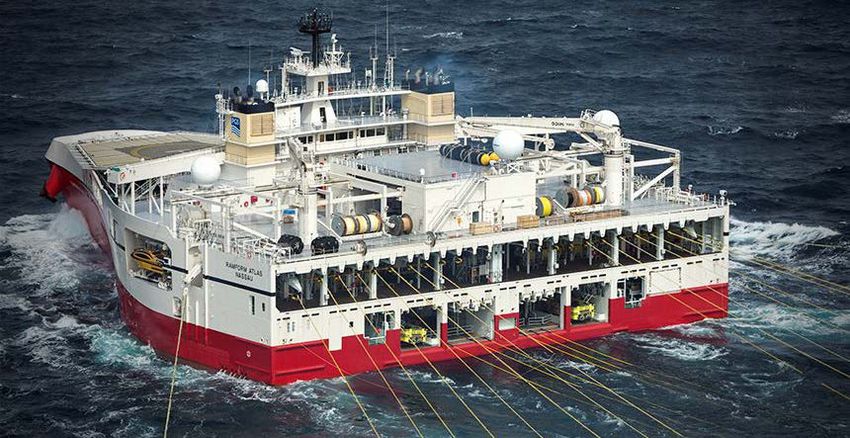
Suggested format for citation:

LGL Limited. 2021. Environmental Assessment Update (2021) of Multiklient Invest Newfoundland
       Offshore Seismic Program, 2018–2023. LGL Rep. FA0223-02. Prepared by LGL Limited, St. John’s,
       Newfoundland and Labrador, for Multiklient Invest AS, Oslo. 77 p. + appendices.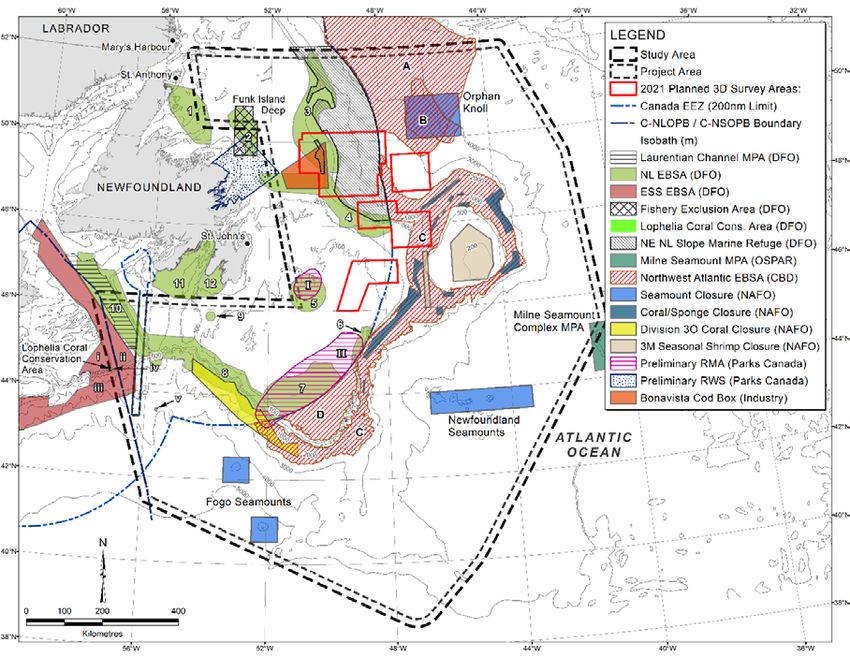
Table of Contents

                                                                                                                                                       Page

List of Figures ............................................................................................................................................iv
List of Tables ............................................................................................................................................ vii
1.0     Introduction ................................................................................................................................... 1
2.0     Project Description ........................................................................................................................ 2
        2.1      Vessels and Equipment ................................................................................................... 3
        2.2      Spatial Scope ..................................................................................................................... 3
        2.3      Temporal Scope ................................................................................................................ 3
        2.4      Seismic Survey Activities Planned for 2021 ................................................................. 3
                 2.4.1           Seismic Energy Source Parameters ............................................................... 3
                 2.4.2           Seismic Streamers ............................................................................................ 4
                 2.4.3           Support Vessels ................................................................................................ 5
                 2.4.4           Survey Locations and Timing ........................................................................ 5
        2.5      Mitigation Measures ........................................................................................................ 5
3.0     Physical Environment .................................................................................................................. 5
4.0     Biological Environment and Fisheries ........................................................................................ 6
        4.1      Fish and Fish Habitat....................................................................................................... 6
                 4.1.1            Plankton ............................................................................................................ 6
                 4.1.2            Benthic Invertebrates....................................................................................... 6
                 4.1.3            Fish..................................................................................................................... 7
        4.2      Fisheries ............................................................................................................................. 9
                 4.2.1           Commercial Fisheries ...................................................................................... 9
                 4.2.2           Indigenous Fisheries ..................................................................................... 33
                 4.2.3           Recreational Fisheries ................................................................................... 35
                 4.2.4           Aquaculture .................................................................................................... 36
                 4.2.5           Science Surveys .............................................................................................. 36
        4.3      Marine-Associated Birds ............................................................................................... 43
        4.4      Marine Mammals and Sea Turtles ............................................................................... 44
                 4.4.1           General Cetacean and Sea Turtle Surveys ................................................. 44
                 4.4.2           Updated Species Information ...................................................................... 45
        4.5      Species at Risk ................................................................................................................ 48
        4.6      Sensitive Areas ............................................................................................................... 50
                 4.6.1           Critical Habitat ............................................................................................... 53
5.0     Consultations ............................................................................................................................... 55
6.0     Environmental Assessment ....................................................................................................... 55
        6.1      Mitigation Measures ...................................................................................................... 56
        6.2      Fish and Fish Habitat..................................................................................................... 57
        6.3      Marine-Associated Birds ............................................................................................... 60

Environmental Assessment Update (2021) – MKI                                                                                                         Page ii
Newfoundland Offshore Seismic Program, 2018–2023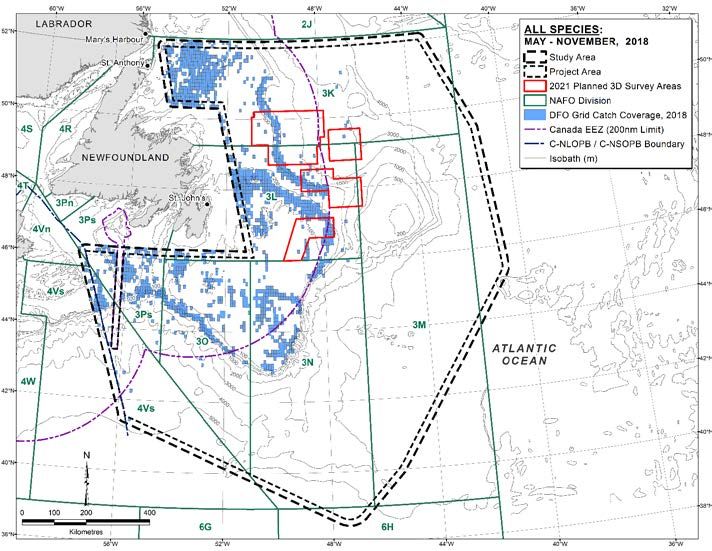
6.3.1       Vessel Lighting ............................................................................................... 60
             6.3.2       Accidental Releases ....................................................................................... 61
             6.3.3       Effects Assessment of other Routine Project Activities ............................ 62
     6.4     Marine Mammals and Sea Turtles ............................................................................... 62
     6.5     Validity of Significance Determinations ..................................................................... 65
             6.5.1       Cumulative Effects ........................................................................................ 65
7.0  Concluding Statement ................................................................................................................ 69
8.0  References .................................................................................................................................... 70
Appendix A – MKI Newsletter Distributed to Consultees ..............................................................A-1
Appendix B – List of Consultees Contacted by MKI ........................................................................ B-1

Environmental Assessment Update (2021) – MKI                                                                                                 Page iii
Newfoundland Offshore Seismic Program, 2018–2023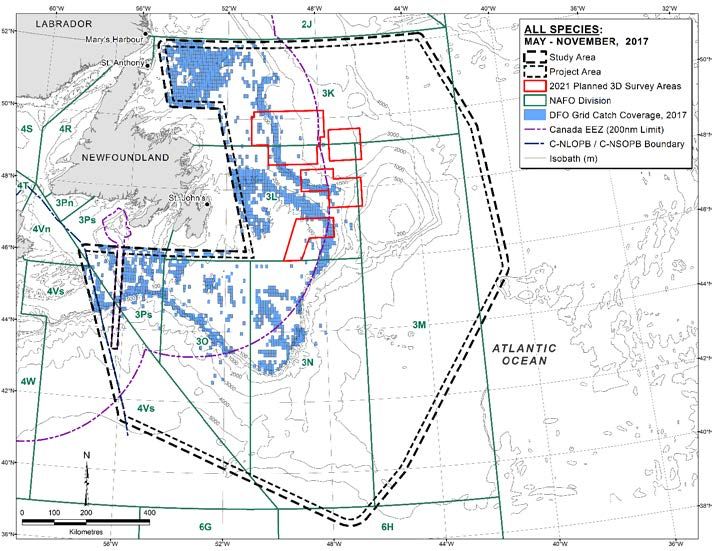
List of Figures
                                                                                                                                                Page

Figure 1.1.    Locations of the Project Area, Study Area and 2021 Planned 3D Survey Areas
               for MKI’s Newfoundland Offshore Seismic Program. ............................................... 1
Figure 2.1.    MV Ramform Atlas. ........................................................................................................... 4
Figure 2.2.    MV Ramform Titan. ........................................................................................................... 4
Figure 4.1.    Distribution of commercial fishery harvest locations, all species,
               May‒November 2017..................................................................................................... 11
Figure 4.2.    Distribution of commercial fishery harvest locations, all species,
               May‒November 2018..................................................................................................... 11
Figure 4.3.    Distribution of commercial fishery harvest locations, snow crab,
               May‒November 2017..................................................................................................... 12
Figure 4.4.    Distribution of commercial fishery harvest locations, snow crab,
               May‒November 2018..................................................................................................... 12
Figure 4.5.    Distribution of commercial fishery harvest locations, northern shrimp,
               May‒November 2017..................................................................................................... 13
Figure 4.6.    Distribution of commercial fishery harvest locations, northern shrimp,
               May‒November 2018..................................................................................................... 13
Figure 4.7.    Distribution of commercial fishery harvest locations, Atlantic halibut,
               May‒November 2017..................................................................................................... 14
Figure 4.8.    Distribution of commercial fishery harvest locations, Atlantic halibut,
               May‒November 2018..................................................................................................... 14
Figure 4.9.    Distribution of commercial fishery harvest locations, Greenland halibut,
               May‒November 2017..................................................................................................... 15
Figure 4.10.   Distribution of commercial fishery harvest locations, Greenland halibut,
               May‒November 2018..................................................................................................... 15
Figure 4.11.   Distribution of commercial fishery harvest locations, Atlantic cod,
               May‒November 2017..................................................................................................... 16
Figure 4.12.   Distribution of commercial fishery harvest locations, Atlantic cod,
               May‒November 2018..................................................................................................... 16
Figure 4.13.   Total annual catch weight quartile codes, May‒November 2017–2018 for
               snow crab in the Orphan Basin, EL1158 & Cambriol, and Jeanne d’Arc 3D
               survey areas. ................................................................................................................... 20
Figure 4.14.   Total monthly catch weight quartile codes, May‒November 2017–2018 for
               snow crab in the Orphan Basin, EL1158 & Cambriol, and Jeanne d’Arc 3D
               survey areas. ................................................................................................................... 21
Figure 4.15.   Total annual catch weight quartile codes, May‒November 2017–2018 for
               Atlantic halibut in the Orphan Basin and EL1158 & Cambriol 3D survey
               areas. ................................................................................................................................ 22

Environmental Assessment Update (2021) – MKI                                                                                                  Page iv
Newfoundland Offshore Seismic Program, 2018–2023
Figure 4.16.   Total monthly catch weight quartile codes, May‒November 2017–2018 for
               Atlantic halibut in the Orphan Basin and EL1158 & Cambriol 3D survey
               areas. ................................................................................................................................ 22
Figure 4.17.   Total annual catch weight quartile codes, May‒November 2017–2018 for
               Greenland halibut in the Orphan Basin, EL1158 & Cambriol, and EL1149 3D
               survey areas. ................................................................................................................... 23
Figure 4.18.   Total monthly catch weight quartile codes, May‒November 2017–2018 for
               Greenland halibut in the Orphan Basin, EL1158 & Cambriol, and EL1149 3D
               survey areas. ................................................................................................................... 24
Figure 4.19.   Total annual catch weight quartile codes, May‒November 2017–2018 for
               Atlantic cod in the Orphan Basin, EL1158 & Cambriol, and EL1149 3D survey
               areas. ................................................................................................................................ 25
Figure 4.20.   Total monthly catch weight quartile codes, May‒November 2017–2018 for
               Atlantic cod in the Orphan Basin, EL1158 & Cambriol, and EL1149 3D survey
               areas. ................................................................................................................................ 25
Figure 4.21.   Total annual catch weight quartile codes, May‒November 2017–2018 for
               American plaice, redfish, roughhead grenadier, and witch flounder in the
               Orphan Basin 3D survey area (top), May−November 2018 for cockle,
               propeller clam, and Arctic surfclam in the Jeanne d’Arc 3D survey area
               (middle), and May‒November 2017–2018 for American plaice, redfish, and
               witch flounder in the EL1158 & Cambriol 3D survey area (bottom). ..................... 27
Figure 4.22.   Total monthly catch weight quartile codes, May‒November 2017–2018 for
               redfish, American plaice, and witch flounder in the EL1158 and Cambriol 3D
               survey area, witch flounder, roughhead grenadier, and redfish in the orphan
               Basin 3D survey area, and May−November 2018 for cockle, propeller clam,
               and Arctic surfclam in the Jeanne d’Arc 3D survey area. ........................................ 28
Figure 4.23.   Total monthly catch weight quartile codes in the Orphan Basin, EL1158 and
               Cambriol, and the Jeanne d’Arc 3D survey areas, for all species combined
               during May‒November 2017. ...................................................................................... 29
Figure 4.24.   Total monthly catch weight quartile codes in the Orphan Basin, EL1158 and
               Cambriol, Jeanne d’Arc, and EL1149 3D survey areas, for all species
               combined during May‒November 2018. .................................................................... 30
Figure 4.25.   Harvest locations for fixed gear, all species, May‒November 2017. ...................... 31
Figure 4.26.   Harvest locations for fixed gear, all species, May‒November 2018. ...................... 31
Figure 4.27.   Harvest locations for mobile gear, all species, May‒November 2017. ................... 32
Figure 4.28.   Harvest locations for mobile gear, all species, May‒November 2018. ................... 32
Figure 4.29.   Distribution of DFO RV survey catch locations, all species, May‒November
               2017. ................................................................................................................................. 37
Figure 4.30.   Distribution of DFO RV survey catch locations, all species, May‒November
               2018. ................................................................................................................................. 37
Figure 4.31.   Distribution of DFO RV survey catch locations, all species, May‒November
               2019. ................................................................................................................................. 38

Environmental Assessment Update (2021) – MKI                                                                                                   Page v
Newfoundland Offshore Seismic Program, 2018–2023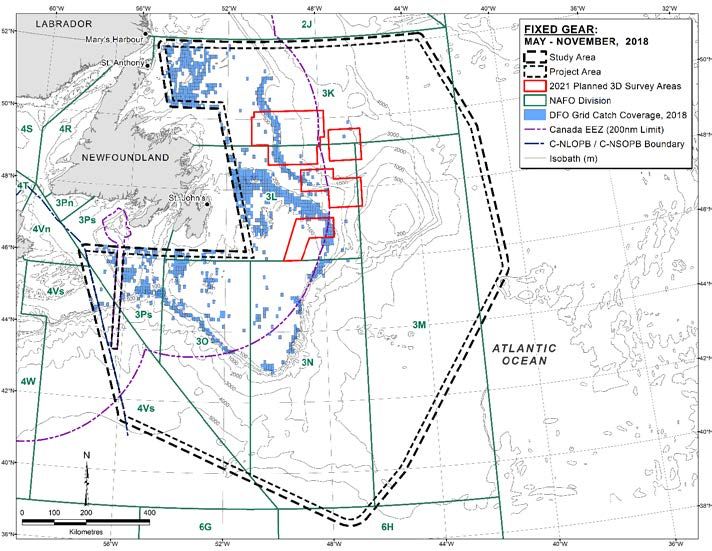
Figure 4.32. Locations of DFO-Industry collaborative 2020 post-season snow crab trap
survey stations. ............................................................................................................... 43
Figure 4.33. Sensitive areas that overlap or are adjacent to the Study Area. .............................. 50
Figure 4.34. Sensitive areas that overlap or are adjacent to the Study Area (continued):
Submarine canyons and Significant Benthic Areas (SBAs). ..................................... 51
Figure 4.35. Finalized northern and spotted wolffish critical habitat, proposed
leatherback sea turtle critical habitat, and important areas for blue whales. ........ 54
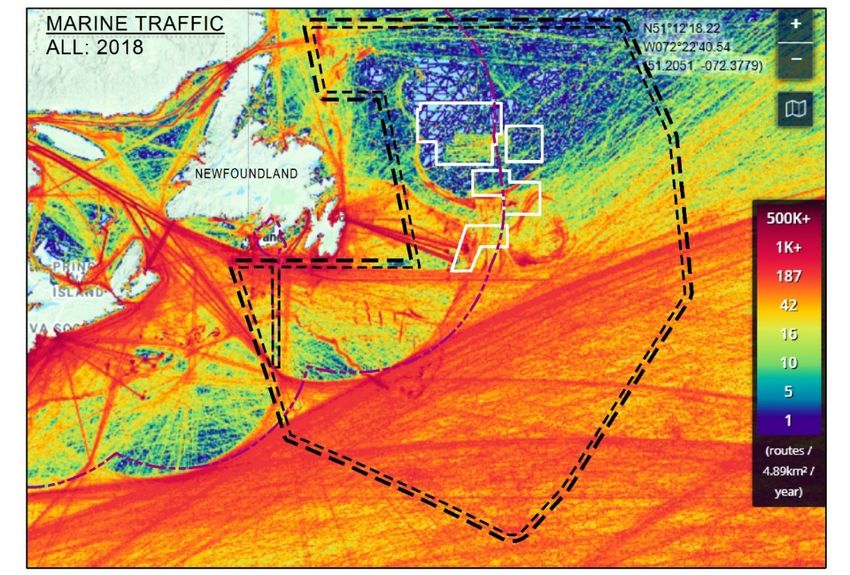
Figure 6.1. Marine shipping traffic density (routes per 4.89 km2 grid cell) in 2018 in the
MKI Project and Study Areas and the Planned 2021 3D Survey Areas. ................ 66
Figure 6.2. Marine shipping traffic density (routes per 4.89 km2 grid cell) in 2019 in the
MKI Project and Study Areas and the Planned 2021 3D Survey Areas. ................ 67
Figure 6.3. Locations of MKI’s planned 3D seismic survey areas in 2021. Also shown are
the production installations on the Grand Banks and EL 1148. .............................. 68
Environmental Assessment Update (2021) – MKI Page vi
Newfoundland Offshore Seismic Program, 2018–2023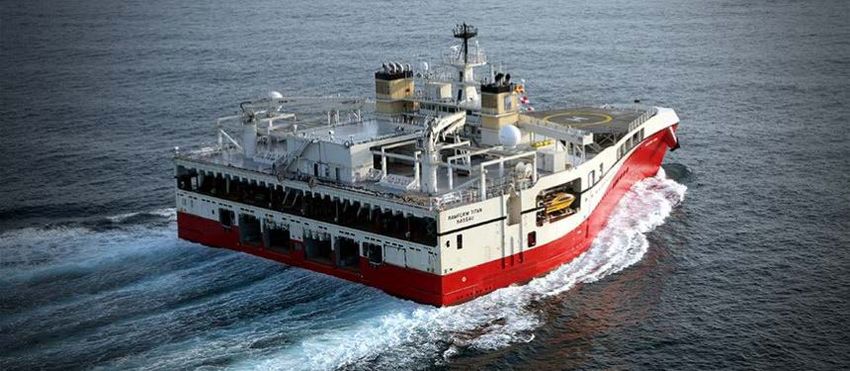
List of Tables

                                                                                                                                            Page

Table 1.1.     Environmental Assessment documents for the MKI Newfoundland Offshore
               Seismic Program, 2018–2023. .......................................................................................... 2
Table 2.1.     Planned timing of MKI’s 2021 seismic survey activities (data acquisition) in
               the Project Area. ............................................................................................................... 5
Table 4.1.     Commercial catch weights and values in the 2021 3D survey areas,
               May‒November 2017 and 2018. ................................................................................... 17
Table 4.2.     Summary of gear type used and timing of the commercial fishery in the 3D
               survey areas, May‒November 2017–2018. ................................................................. 30
Table 4.3.     Indigenous communal-commercial licences and allocations for NL-based
               groups and organizations within the Study Area, 2020–2021.. ............................... 33
Table 4.4.     Catch weights and numbers of macroinvertebrates and fishes collected
               during DFO RV surveys in the Orphan Basin, EL1158 and Cambriol, and the
               Jeanne d’Arc 3D survey areas, May‒November 2017–2019..................................... 38
Table 4.5.     Mean catch depths (m) of macroinvertebrates and fishes collected during
               DFO RV surveys in the Orphan Basin, EL1158 and Cambriol, and the Jeanne
               d’Arc 3D survey areas, May‒November 2017–2019. ................................................ 39
Table 4.6.     Predominant species caught at various mean catch depth ranges in the
               Orphan Basin, EL1158 and Cambriol, and Jeanne d’Arc 3D survey areas
               during DFO RV surveys, May‒November 2017–2019. ............................................. 40
Table 4.7.     Tentative schedule of DFO RV surveys within the Study Area during
               2021–2022. ....................................................................................................................... 42
Table 4.8.     SARA-listed and COSEWIC-assessed marine species that potentially occur
               in the Study Area. .......................................................................................................... 48
Table 4.9.     Sensitive areas that overlap or are adjacent to the Study Area. .............................. 52
Table 6.1.     Summary of environmental commitments and mitigation measures and the
               current status of these commitments and measures. ................................................ 56

Environmental Assessment Update (2021) – MKI                                                                                             Page vii
Newfoundland Offshore Seismic Program, 2018–2023
1.0 Introduction This document is an Update of the Environmental Assessment (EA) of the Multiklient Invest AS (MKI) Newfoundland Offshore Seismic Program, 2018–2023 (LGL 2018a), the associated Addendum (LGL 2018b), and EA Updates (LGL 2018c, 2019, 2020b). In 2021, MKI is proposing to conduct 3D seismic surveying in the Newfoundland Offshore Project Area (Figure 1.1). The EA Update document addresses the validity of the EA (Table 1.1) as it pertains to MKI’s proposed seismic survey activities in 2021. The EA Update is intended to assist the Canada-Newfoundland and Labrador Offshore Petroleum Board (C-NLOPB) in its regulatory review process by demonstrating that both the scope of the assessment and the mitigation measures to which MKI previously committed remain technically valid for proposed seismic survey operations in 2021. Previous EA Updates associated with this program were prepared in 2018, 2019, and 2020 (LGL 2018c, 2019, 2020b). Figure 1.1. Locations of the Project Area, Study Area and 2021 Planned 3D Survey Areas for MKI’s Newfoundland Offshore Seismic Program. Environmental Assessment Update (2021) – MKI Page 1 Newfoundland Offshore Seismic Program, 2018–2023
Table 1.1. Environmental Assessment documents for the MKI Newfoundland Offshore Seismic Program,
2018–2023. Screening determination reference number C-NLOPB File No. 45006-020-005.
Document Type Temporal Scope EA Document
Environmental Assessment of Multiklient Invest
May 1 to November 30,
Original EA Newfoundland Offshore Seismic Program, 2018–2023
2018–2023
and EA Addendum (LGL 2018a,b)a
Environmental Assessment Update (2018) of the
EA Update May 1 to November 30, 2018 Multiklient Invest Newfoundland Offshore Seismic
Program, 2018–2023 (LGL 2018c)
Environmental Assessment Update (2019) of the
EA Update May 1 to November 30, 2019 Multiklient Invest Newfoundland Offshore Seismic
Program, 2018−2023 (LGL 2019)
Environmental Assessment Update (2020) of the
EA Update May 1 to November 30, 2020 Multiklient Invest Newfoundland Offshore Seismic
Program, 2018−2023 (LGL 2020b)
Amendment to Environmental Assessment of
May 1 to November 30,
EA Amendment Multiklient Invest Newfoundland Offshore Seismic
2018–2023
Program, 2018–2023 (LGL 2020a)b
Amendment to Environmental Assessment of
May 1 to November 30,
EA Amendment Multiklient Invest Newfoundland Offshore Seismic
2018–2023
Program, 2018–2023 (LGL 2021)c
a
On 15 May 2018, the C-NLOPB made a positive determination on this EA and EA Addendum.
b
The EA Amendment is under review.
c
The EA Amendment is under review.
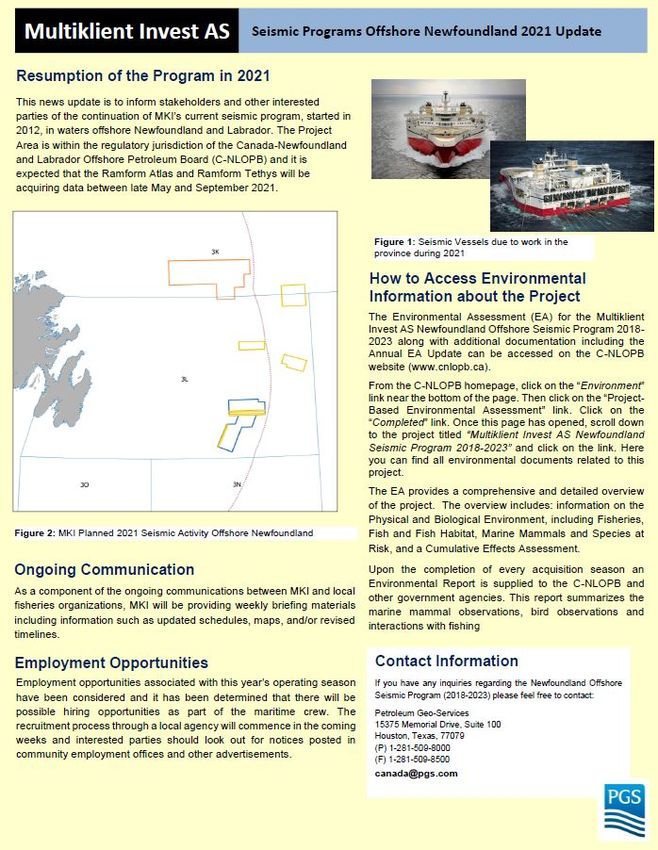
In April 2021, MKI submitted an Amendment to the EA (LGL 2021) proposing to test its eSeismic
technology. This technology involves the activation of individual airguns in a pseudo-random
pattern every 200 ms. The sound pressure level (SPL) of the sound source is reduced due to
smaller airgun volumes being activated at once but airguns are activated on a near continuous
basis. The EA Amendment is under review and MKI commits to all mitigation measures
presented in the original EA pending a determination by the C-NLOPB on the EA Amendment.
The following sections provide the information necessary to confirm the validity of the EA and
its associated documents (see Table 1.1), including assessment of the potential effects of 3D
seismic survey activities within the defined Project Area (see Figure 1.1) on the following Valued
Environmental Components (VECs): Fish and Fish Habitat; Fisheries; Marine-Associated Birds;
Marine Mammals and Sea Turtles; Species at Risk; and Sensitive Areas. This Update includes
new and relevant information not included in the EA and its associated documents.
2.0 Project Description
The information in this section provides details of the Project specific to 2021.
Environmental Assessment Update (2021) – MKI Page 2
Newfoundland Offshore Seismic Program, 2018–20232.1 Vessels and Equipment The EA assessed a project that included a maximum of four simultaneous seismic surveys within a given year: three 3D surveys and one 2D survey. For 2021, MKI will conduct two simultaneous 3D surveys with the MV Ramform Atlas and MV Ramform Titan. All project description parameters described in the EA are applicable to MKI’s 2021 activities. Specific details for 2021 are provided in Section 2.4. 2.2 Spatial Scope The Project and Study areas defined in the EA (LGL 2018a) remain unchanged (see Figure 1.1). 2.3 Temporal Scope The temporal scope defined in the EA (LGL 2018a) as 1 May–30 November during each year of the 2018–2023 period remains unchanged. 2.4 Seismic Survey Activities Planned for 2021 In 2021, MKI plans to conduct 3D seismic surveying in the Project Area. A maximum of two seismic survey vessels will be used in 2021. MKI is proposing to conduct approximately 11,000–15,000 km2 of 3D seismic surveying in the Project Area in 2021 (see Figure 1.1). In 2021, MKI will use the MV Ramform Atlas and MV Ramform Titan for the 3D seismic surveying. The Ramform Atlas and Ramform Titan are sister ships, both built in 2013 and flagged in the Bahamas (Figures 2.1 and 2.2). Both the Atlas and Titan are 104.2 m long, with a beam of 70 m and a draft of about 6.4 m. The vessels will travel at a speed of ~8.15-9 km/h (4.4-4.9 knots) while conducting the 3D seismic surveying. All other project details presented in Section 2.0 of the EA remain applicable to MKI’s seismic survey activities in 2021. 2.4.1 Seismic Energy Source Parameters For 3D seismic surveying MKI will use either a 4130 in3 (dual source) or 3280 in3 (triple source) array, operated at a pressure of 2000 psi, towed at either 7 m or 9 m depth. The shotpoint interval will be one array pulse every 12.5 m, 18.75 m or 25 m. Any change relative to the testing of the eSeismic survey procedure as proposed in the recent EA Amendment will depend on the outcome of the Amendment review process. Environmental Assessment Update (2021) – MKI Page 3 Newfoundland Offshore Seismic Program, 2018–2023
Figure 2.1. MV Ramform Atlas.

Figure 2.2. MV Ramform Titan.

2.4.2   Seismic Streamers

The Atlas and Titan will tow 14 or 16 streamers each 9.0 or 8.1 km in length, respectively. The
streamers will be spaced 75 m (14 streamers) or 100 m (16 streamers) apart for a total maximum
spread of ~8.8 and 12.2 km2, respectively.

Environmental Assessment Update (2021) – MKI                                             Page 4
Newfoundland Offshore Seismic Program, 2018–2023
2.4.3    Support Vessels

Four vessels may be used to support the 3D seismic surveys in 2021. The MV Thor Magni will be
used as support vessel. The MV Norcon Triton, MV Dantzig, and MV Palaimon will perform escort
vessel duties. The operational objective is to have one of these escort vessels available with each
seismic vessel and the support vessel(s) will be used to fill in for escort duties as required.

2.4.4    Survey Locations and Timing

The planned timing of MKI’s 3D surveys in the Project Area is summarized in Table 2.1. The
maximum number of MKI seismic vessels acquiring data within the Project Area as part of the
Project at any given time would be two; this is planned to occur through most of June, July,
August, and early September. The Ramform Titan will survey the Cape Anguille MC3D
(~10,000 km2) survey area (also referred to as the Orphan Basin MC3D survey area) and the
Ramform Atlas will survey the Cambriol MC3D (~1180 km2), EL1149 (2300 km2), and Jeanne d’Arc
HD3D Completion (~600 km2) survey areas. It is possible that the Ramform Atlas may also survey
some of EL1158 (1000 km2). The Ramform Titan plans to mobilize and deploy its seismic gear
from 21–28 May with demobilization planned for 6–10 September. The Ramform Atlas plans to
mobilize and deploy its seismic gear from 7–14 June with demobilization planned for
9–12 September. Mobilization and demobilization dates may change.

Table 2.1. Planned timing of MKI’s 2021 seismic survey activities (data acquisition) in the Project Area.

                               May       June (week)           July (week)           Aug (week)           Sep (week)
3D Survey Area                  4    1    2      3     4   1    2      3     4   1    2     3     4   1    2     3      4
Cape Anguille MC3D
Cambriol MC3D
EL1149 MC3D
Jeanne d'Arc HD3D Completion

2.5      Mitigation Measures

Mitigation measures to be implemented during seismic surveys carried out for this Project will
follow those described in the EA (LGL 2018a) and its Addendum (LGL 2018b). Further details are
provided in Table 6.1.

3.0      Physical Environment

A summary of the physical environment was provided in Section 3.0 of the EA (LGL 2018a). The
sea-ice volume across the Newfoundland and Labrador Shelf was slightly below normal in 2019
and was characterized by a large negative anomaly in March–April which led to an early
ice-retreat on the Newfoundland Shelf (Cyr et al. 2021). The sea-ice cover first appeared at
near-normal to later than normal times in 2019 and declined sharply on the Newfoundland Shelf
in March. The highest number of icebergs (1515) that drifted south of 48°N onto the Northern

Environmental Assessment Update (2021) – MKI                                                                         Page 5
Newfoundland Offshore Seismic Program, 2018–2023
Grand Bank was recorded in 2019 which was the 7th highest record since 1900. Monthly iceberg recordings in 2019 showed that 792 icebergs were documented in May alone, which was nearly four times more than the total in 2018 (Cyr et al. 2021). The annual sea-surface temperature and bottom temperature in Northwest Atlantic Fisheries Organization (NAFO) Divs. 3LNOPs were at normal levels in 2019; however, the bottom temperatures on the slopes of the Grand Banks were above normal. During fall 2019, the bottom temperatures in NAFO Divs. 2HJ3KLNO were also above normal, especially in 3K (Cyr et al. 2021). 4.0 Biological Environment and Fisheries 4.1 Fish and Fish Habitat New information is included for key points regarding plankton, oceanic conditions, benthic invertebrates, and fish species within the Study Area. The new information presented here does not change the effects predictions made in the EA (LGL 2018a). 4.1.1 Plankton The Atlantic Zone Monitoring Program (AZMP) findings in relation to oceanographic conditions in the Study Area have been updated to include findings from 2019 (DFO 2020a). Overall, the annual chlorophyll-a inventories were above normal over most of the Newfoundland and Labrador Shelf. The onset of the spring phytoplankton bloom was highly variable across the Atlantic Zone, and a delayed onset occurred on the Northeast Newfoundland Shelf. The magnitude of the bloom was near or below normal throughout the Atlantic Zone. Bloom duration was generally near or above normal on the Newfoundland and Labrador Shelf, reaching record high durations in the St. Anthony Basin and over the Southeast Shoal. The zooplankton community shift observed in recent years (2014–2018), characterized by lower abundance of large energy-rich copepod Calanus finmarchicus, higher abundance of small copepods and non-copepods, persisted in 2019 despite the apparent shift toward normal conditions in 2018. C. finmarchicus abundance levels remained near or slightly below normal across most of the Atlantic Zone. The abundance of Pseudocalanus spp. was above or near normal throughout the Atlantic Zone. The abundance of non-copepod species such as dinoflagellates, cnidarians, ctenophores, and tunicates were near or above normal throughout the Atlantic Zone. Zooplankton biomass was generally below normal across most of the Atlantic Zone with exceptions observed in the Bonavista section. 4.1.2 Benthic Invertebrates There have been no further relevant updates on benthic invertebrates since the information presented in subsection 4.1.2 of LGL (2020b). Environmental Assessment Update (2021) – MKI Page 6 Newfoundland Offshore Seismic Program, 2018–2023
4.1.3     Fish

As in the EA, ‘fish’ includes macro-invertebrates that are targeted in the commercial fisheries and
all fishes, either targeted in the commercial fisheries or otherwise. The focus in the EA is on key
commercially- and ecologically important fishes.

4.1.3.1    Principal Macro-invertebrates and Fishes Commercially Harvested

Macroinvertebrates

Snow Crab (Chionoecetes opilio)

In 2019, the exploitable biomass of snow crab in the NAFO Assessment Divisions (AD) 3K and
3LNO Offshore increased from previous years; however, there was reduced coverage in the fall
multispecies survey in 3K in 2019. In 3LNO, the trap-derived exploitable biomass index showed
a more modest increase and still remains near the time-series low (DFO 2021a). In AD 3K,
landings have remained consistently low over the past four years (6,000 t in 2019), while the
fishing effort decreased to the lowest level in 20 years in 2019. In AD 3LNO Offshore, snow crab
landings were at the lowest levels in two decades due to a 48% decline from 2016 to less than
13,000 t in 2019, in part due to reductions in the Total Allowable Catch (TAC). The TAC in NAFO
Div. 3K in 2021 had a 16% increase to 7,454 t from 6,412 t in 2020 and Div. 3LNO had an increase
of 34% to 23,648 t from 17, 587 t in 2020 (DFO 2021b).

Northern Shrimp (Pandalus borealis)

The 2020/21 fisheries management decision for Shrimp Fishing Area (SFA) 6, which occurs in the
northern portion of the Study Area, was reduced from 2017/18 to 2018/19 by 16% to 8,290 t (to
maintain a 10% exploitation rate) and was increased by 3% to 8,961 t in 2019/2020 (DFO 2021b,c).
Northern shrimp biomass in SFA 6 is currently similar to the 1980–90 period, which was at a
substantially low level compared to the peak level in the mid-2000s. Between 1996–2019 the
fishable biomass index of northern shrimp in SFA 6 averaged 380,000 t and in 2019 the fishable
biomass index decreased by 8% from 2018 to 82,900 t (DFO 2021c).

Cockles (Cardiidae)

There have been no further relevant updates on cockles since the information presented in
subsections 4.2.2.1 and 4.3.3.2 of LGL (2015a) and 4.2.2.1 of LGL (2018a).

Arctic Surfclam (Mactromeris polynyma)

In 2019, landings of Arctic surfclam (previously Stimpson’s Surf Clam) in the Maritime Fishery
Information System 1.0 and 2.0 (MARFIS) and the Newfoundland and Labrador region’s Catch

Environmental Assessment Update (2021) – MKI                                                 Page 7
Newfoundland Offshore Seismic Program, 2018–2023
and Effort Database were 14,925 t against a TAC of 14,756 t (DFO 2020a). In 2021, the TAC for the
Grand Banks remains at 14,756 t (DFO 2021b).

Atlantic Halibut (Hippoglossus hippoglossus)

There have been no further relevant updates on Atlantic halibut since the information presented
in subsection 4.1.3.1 of LGL (2019).

Greenland Halibut (Reinhardtius hippoglossoides)

The TAC for Greenland halibut in NAFO Div. 3LMNO is 12,225 t in 2021, down from 12,542 t in
2020 (NAFO 2021).

Atlantic Cod (Gadus morhua)

The one-year management plan for 2020 followed the 2019 steward fishery management
approach, which included efforts to ensure that catches for the northern cod fishery in NAFO
Div. 2J3KL did not exceed 12,350 t (DFO 2021a). Since 2016, commercial fishery removals have
been regulated by weekly limits (lbs/week) by NAFO Division and time of year. Reported
landings in 2019 were 10,559 t, including 10,410 t in the stewardship fishery, 123 t in the sentinel
surveys, and 2 t taken as by-catch. In 2019, most of the abundance (60%) and biomass (52%)
indices were located in the northern portion of the stock area (Divs. 2J). The productivity of 2J3KL
cod is associated with capelin availability, which was forecasted to decline in 2020 and will also
likely negatively impact cod (DFO 2021d). The TAC for Atlantic cod in Div. 3M decreased from
8,531 t in 2020 to 1,500 t in 2021 (NAFO 2021).

American Plaice (Hippoglossoides platessoides)

The moratorium on American plaice is still in place for 2021 and the TAC is set at 0 t in Divs.
3LMNO (NAFO 2021). Perreault et al. (2020) developed a state-stock assessment model that
accounts for uncertainties in the landings data and improves the current stock assessment model
that is used to inform management of the American plaice on the Grand Banks. The new model
has the potential to increase the confidence in the assessment output that is provided to fisheries
managers (Perreault et al. 2020). As noted in LGL (2020b), DFO has determined that there is a
high probability that stock growth of American plaice will not occur if this species is harvested
(DFO 2020c).

Yellowtail Flounder (Pleuronectes ferruginea)

There have been no further relevant updates on yellowtail flounder since the information
presented in subsection 4.1.3.1 of LGL (2019).

Environmental Assessment Update (2021) – MKI                                                  Page 8
Newfoundland Offshore Seismic Program, 2018–2023
White Hake (Urophycis tenuis)

The TAC for Yellowtail flounder in NAFO Div. 3LNO remains at 17,500 t in 2021 (NAFO 2021).

Redfish (Sebastes sp.)

The TAC for redfish in Unit 2 (NAFO Div. 3Ps, 4Va, a portion of 4W, and 3Pn + 4Pn) continues
to be set at 8,500 t for 2020/21 (DFO 2021b).

4.1.3.2    Other Fishes of Note

Capelin (Mallotus villosus)

In 2020, the TAC for capelin in NAFO Divs. 2J3KLPs was set at 19,377 t, which was divided into
77 t for Div. 2J, 6,811 t for Div. 3K, 11, 198 t for Div. 3L, and 1,291 t for Div. 3Ps (DFO 2021b).

Wolffishes (Anarhichas sp.)

There have been no further relevant updates on wolffishes since the information presented in
subsection 4.1.3.2 of LGL (2020b).

Swordfish (Xiphias gladius)

There have been no further relevant updates on swordfish since the information presented in
subsection 4.1.3.1 of LGL (2019).

Anadromous Fishes

The estimated number of Atlantic salmon retained by the recreational fishery throughout
Newfoundland and Labrador has been highly variable since 2005 as total catch has ranged from
38,900 to 76,100 individuals. Preliminary estimates of retained and released salmon in 2018 were
13,626 and 25,055 individuals, respectively, totaling 38,681 salmon (DFO 2020c).

4.2       Fisheries

The new information presented in this subsection does not change the effects predictions made
in the EA (LGL 2018a) or its associated Addendum (LGL 2018b).

4.2.1     Commercial Fisheries

The most recent available commercial fisheries data are from the 2017 and 2018 datasets. The 2017
commercial fisheries data, which were presented in the 2020 EA Update (LGL 2020b), are

Environmental Assessment Update (2021) – MKI                                                 Page 9
Newfoundland Offshore Seismic Program, 2018–2023
re-analyzed here relative to the 2021 planned 3D survey areas. Note that the Cape Anguille MC3D
survey area is referred to as the Orphan Basin MC3D or Orphan Basin 3D survey area.

The distribution of May‒November 2017 and 2018 harvest locations for all species and principal
commercial species (i.e., snow crab, northern shrimp, Atlantic halibut, Greenland halibut, and
Atlantic cod) harvested in the planned 3D survey areas (and Study Area) are shown in
Figures 4.1–4.12. There were no commercial fisheries harvest locations within the EL1149 MC3D
survey area during May−November 2017; however, there were for 2018. Harvests mainly
occurred between the 100 and 200-m isobaths in the Jeanne d’Arc HD3D Completion survey area
and the 500 and 1000-m isobaths in the Orphan Basin and EL1158 and Cambriol MC3D survey
areas. Harvests in the EL1149 MC3D survey area in 2018 occurred between the 2000 and 3000-m
isobaths.

Catch weight and quartile counts by vessel length classes and species harvested in the Orphan
Basin, EL1149, EL1158 and Cambriol, and Jeanne d’Arc HD3D Completion survey areas are
presented in Table 4.1. All commercial harvests within the 3D survey areas were caught by fishers
from Newfoundland and Labrador.

During 2017 and 2018, Greenland halibut were the main species harvested in the Orphan Basin
MC3D survey area. Other species harvested during May−November 2017 and 2018 include snow
crab, Atlantic halibut, Atlantic cod, redfish, witch flounder, and roughhead grenadier. Greenland
halibut were mostly harvested by vessels of the length class 34–44.9’ and vessels 45−64.9’. Snow
crab were mainly caught by vessels
Figure 4.1. Distribution of commercial fishery harvest locations, all species, May‒November 2017 (derived
from DFO commercial landings database, 2017).

Figure 4.2. Distribution of commercial fishery harvest locations, all species, May‒November 2018 (derived
from DFO commercial landings database, 2018).

Environmental Assessment Update (2021) – MKI                                                     Page 11
Newfoundland Offshore Seismic Program, 2018–2023
Figure 4.3. Distribution of commercial fishery harvest locations, snow crab, May‒November 2017
(derived from DFO commercial landings database, 2017).

Figure 4.4. Distribution of commercial fishery harvest locations, snow crab, May‒November 2018
(derived from DFO commercial landings database, 2018).

Environmental Assessment Update (2021) – MKI                                           Page 12
Newfoundland Offshore Seismic Program, 2018–2023
Figure 4.5. Distribution of commercial fishery harvest locations, northern shrimp, May‒November 2017
(derived from DFO commercial landings database, 2017).

Figure 4.6. Distribution of commercial fishery harvest locations, northern shrimp, May‒November 2018
(derived from DFO commercial landings database, 2018).

Environmental Assessment Update (2021) – MKI                                                 Page 13
Newfoundland Offshore Seismic Program, 2018–2023
Figure 4.7. Distribution of commercial fishery harvest locations, Atlantic halibut, May‒November 2017
(derived from DFO commercial landings database, 2017).

Figure 4.8. Distribution of commercial fishery harvest locations, Atlantic halibut, May‒November 2018
(derived from DFO commercial landings database, 2018).

Environmental Assessment Update (2021) – MKI                                                  Page 14
Newfoundland Offshore Seismic Program, 2018–2023
Figure 4.9. Distribution of commercial fishery harvest locations, Greenland halibut, May‒November 2017
(derived from DFO commercial landings database, 2017).

Figure 4.10. Distribution of commercial fishery harvest locations, Greenland halibut, May‒November 2018
(derived from DFO commercial landings database, 2018).

Environmental Assessment Update (2021) – MKI                                                   Page 15
Newfoundland Offshore Seismic Program, 2018–2023
Figure 4.11. Distribution of commercial fishery harvest locations, Atlantic cod, May‒November 2017
(derived from DFO commercial landings database, 2017).

Figure 4.12. Distribution of commercial fishery harvest locations, Atlantic cod, May‒November 2018
(derived from DFO commercial landings database, 2018).

Environmental Assessment Update (2021) – MKI                                               Page 16
Newfoundland Offshore Seismic Program, 2018–2023
Table 4.1. Commercial catch weights and values in the 2021 3D survey areas, May‒November 2017 and 2018 (values indicate the frequency of catch weight
quartile codes [i.e., 1‒4] or vessel length classes attributed to each species; derived from DFO commercial landings database, 2017/2018).

                                                                                                                                                                                         Total
                         Catch Weight Quartile Code Counts a             Catch Value Quartile Code Counts b                  Vessel Length Class Total Quartile Code Counts c
                                                                                                                                                                                        Counts d
   Species
                    1              2            3              4    1              2           3              4    1-34.9’   35-44.9’     45-64.9’     65-99.9’    100-124.9’   ≥125’

                                                                                                Orphan Basin

 2017

 Greenland
                    15             56          56              10   21            51           55             10     1          27          86            9            0         14       137
 Halibut

 Redfish            8              16          10              1    13            13           7              2      0          1           22            6            0         6        35

 Witch
                    6              12           5              0    10             5           7              1      0          0           14            0            0         9        23
 Flounder
 Atlantic
                    1              3            7              0    2              1           6              2      0          0            2            0            0         9        11
 Halibut

 Atlantic Cod       3              3            2              0    6              2           0              0      1          0            7            0            0         0         8

 Roughhead
                    1              3            1              2    1              3           1              2      0          2            1            4            0         0         7
 Grenadier

 Snow Crab          0              2            0              0    0              1           1              0      1          0            1            0            0         0         2

            Total   34             95          81              13   53            76           77             17     3          30          133          19            0         38       223

 2018

 Greenland
                    14             42          61              5    19            55           43             5      0          34          82            0            0         6        122
 Halibut

 Redfish            1              3            6              2    1              4           5              2      0          2            6            0            0         4        12

 Snow Crab          11             0            0              0    9              2           0              0      8          2            1            0            0         0        11

 Atlantic
                    1              1            3              2    1              0           4              2      0          0            1            0            0         6         7
 Halibut
 Witch
                    0              0            1              2    0              0           1              2      0          0            0            0            0         3         3
 Flounder

 Atlantic Cod       0              1            0              0    0              1           0              0      0          1            0            0            0         0         1

 Capelin            0              0            1              0    1              0           0              0      0          0            1            0            0         0         1

 Roughhead
                    0              1            0              0    0              1           0              0      0          0            1            0            0         0         1
 Grenadier

            Total   27             48          72              11   31            63           53             11     8          39          92            0            0         19       158

                                                                                             EL1158 & Cambriol

 2017

 Redfish            10             35          28              33   23            41           29             13     0          0            0            0            0        106       106

 Atlantic
                    4              27          26              29   14            34           26             12     0          0            1            0            0         85       86
 Halibut

Environmental Assessment Update (2021) – MKI                                                                                                                                             Page 17
Newfoundland Offshore Seismic Program, 2018–2023
Total
Catch Weight Quartile Code Counts a Catch Value Quartile Code Counts b Vessel Length Class Total Quartile Code Counts c
Counts d
Species
1 2 3 4 1 2 3 4 1-34.9’ 35-44.9’ 45-64.9’ 65-99.9’ 100-124.9’ ≥125’
Greenland
3 24 20 26 11 27 25 10 0 0 7 0 0 66 73
Halibut
Witch
0 10 8 13 3 12 10 6 0 0 0 0 0 31 31
Flounder
American
4 6 7 9 6 7 9 4 0 0 0 0 0 26 26
Plaice
Atlantic Cod 3 4 6 10 4 8 9 2 0 0 0 0 0 23 23
Snow Crab 3 3 0 1 1 3 3 0 0 0 5 2 0 0 7
Total 27 109 95 121 62 132 111 47 0 0 13 2 0 337 352
2018
Greenland
14 23 38 31 23 29 46 8 0 6 20 2 0 78 106
Halibut
Redfish 7 13 33 31 11 25 40 8 0 0 0 0 0 84 84
Atlantic
4 12 33 31 8 24 40 8 0 0 0 0 0 80 80
Halibut
Witch
4 7 15 20 6 11 24 5 0 0 0 0 0 46 46
Flounder
Atlantic Cod 1 7 12 15 4 11 18 2 0 0 0 0 0 35 35
American
2 3 1 4 4 2 4 0 0 0 0 0 0 10 10
Plaice
Snow Crab 2 2 1 0 1 2 2 0 0 0 4 1 0 0 5
Total 34 67 133 132 57 104 174 31 0 6 24 3 0 333 366
Jeanne d'Arc
2017
Snow Crab 12 33 37 2 5 19 34 26 0 0 62 22 0 0 84
Total 12 33 37 2 5 19 34 26 0 0 62 22 0 0 84
2018
Snow Crab 12 27 35 1 7 16 34 18 0 0 56 19 0 0 75
Arctic
0 1 2 2 1 2 0 2 0 0 0 0 0 5 5
Surfclam
Propeller
0 1 2 2 1 2 0 2 0 0 0 0 0 5 5
Clam
Cockle 0 0 2 2 0 2 0 2 0 0 0 0 0 4 4
Total 12 29 41 7 9 22 34 24 0 0 56 19 0 14 89
EL1149
Environmental Assessment Update (2021) – MKI Page 18
Newfoundland Offshore Seismic Program, 2018–2023Total
Catch Weight Quartile Code Counts a Catch Value Quartile Code Counts b Vessel Length Class Total Quartile Code Counts c
Counts d
Species
1 2 3 4 1 2 3 4 1-34.9’ 35-44.9’ 45-64.9’ 65-99.9’ 100-124.9’ ≥125’
2018
Greenland
0 - - - 1 - - - 0 0 1 0 0 0 1
Halibut
Atlantic Cod 1 - - - 1 - - - 0 1 0 0 0 0 1
Total 1 - - - 2 - - - 0 1 1 0 0 0 2
Notes:
a Quartile ranges provided by DFO (quartile ranges calculated annually by DFO based on total catch weights in a given year, all species combined). 2017 quartile ranges: 1 = 0 ‒ 1,912 kg; 2 = 1,913 ‒ 8,828 kg;
3 = 8,829 ‒ 35,206 kg; 4 = ≥35,207 kg. 2018 quartile ranges: 1 = 0 ‒ 2,045 kg; 2 = 2,046 ‒ 8,549 kg; 3 = 8,550 ‒ 33,818 kg; 4 = ≥33,818 kg.
b Quartile ranges provided by DFO (quartile ranges calculated annually by DFO based on total catch value in a given year, all species combined). 2017 quartile ranges: 1 = $0 ‒ $9,811; 2 = $9,812 ‒ $43,514;
3 = $43,515 ‒ $166,502; 4 = ≥$166,503. 2018 quartile ranges: 1 = $0 ‒ $10,353; 2 = $10,354 ‒ $45,610; 3 = $45,611 ‒ $166,300; 4 = ≥$166,301.
c Includes the total quartile code count for ranges 1‒4, combined; total counts for catch weight and catch value are equal.
d Total counts of the number of catch records per species; the total quartile range counts for catch weight and catch value are equal.
Environmental Assessment Update (2021) – MKI Page 19
Newfoundland Offshore Seismic Program, 2018–20234.2.1.1 Snow Crab
During May−November 2017–2018, snow crab catches occurred in the Orphan Basin, EL1158 and
Cambriol, and Jeanne d’Arc 3D survey areas, mainly in water depths between 100 m and 200 m
(see Figures 4.3−4.4). The 2021 snow crab TAC in NAFO Div. 3K increased by 16% to 7,454 t from
6,412 t in 2020 and increased in Div. 3LNO by 34% to 23,648 t from 17, 587 t in 2020 (DFO 2021b).
During May−November, snow crab harvest within the EL1158 and Cambriol and Jeanne d’Arc
3D survey areas slightly decreased from 2017 to 2018 and increased in the Orphan Basin 3D
survey area (Figure 4.13). Most snow crab catches occurred during May‒July in 2017 and 2018
(Figure 4.14).
300 Snow Crab
Orphan
EL1158 & Cambriol
250
Jeanne d'Arc
Sum of Quartile Catch Ranges
200
150
100
50
0
2017 2018
Year
Note: Sum of quartile catch ranges is the summation of catch weight quartile ranges (i.e., 1‒4) for all catch records for all species;
the greater the sum of quartile range counts, the greater the catch for a given year).
Figure 4.13. Total annual catch weight quartile codes, May‒November 2017–2018 for snow crab in the
Orphan Basin, EL1158 & Cambriol, and Jeanne d’Arc 3D survey areas (derived from DFO commercial
landings database, 2017–2018).
Environmental Assessment Update (2021) – MKI Page 20
Newfoundland Offshore Seismic Program, 2018–202380 Snow Crab Orphan - 2017
Orphan - 2018
EL1158 & Cambriol - 2017
Sum of Quartile Catch Ranges
60 EL1158 & Cambriol - 2018
Jeanne d'Arc - 2017
Jeanne d'Arc - 2018
40
20
0
May Jun Jul Aug Sep Oct Nov
Month
Note: Sum of quartile catch ranges is the summation of catch weight quartile ranges (i.e., 1‒4) for all species; the greater the
sum of quartile range counts, the greater the catch weight for a given month).
Figure 4.14. Total monthly catch weight quartile codes, May‒November 2017–2018 for snow crab in the
Orphan Basin, EL1158 & Cambriol, and Jeanne d’Arc 3D survey areas (derived from DFO commercial
landings database, 2017–2018).
4.2.1.2 Northern Shrimp
During May‒November 2017–2018, there were no harvest locations within the 3D survey areas
(see Figures 4.5 and 4.6).
4.2.1.3 Atlantic Halibut
During May‒November 2017 and 2018, harvest locations for Atlantic halibut occurred in the
central portions of the Orphan Basin and EL1158 and Cambriol 3D survey areas, between the
500 and 1000-m isobaths (see Figures 4.7−4.8). No TACs have been posted on the DFO website
for the Study Area since the 2014/2015 limit of 2,738 t in Div. 3NOPs4VWX+5 (includes the South
Bank 2020 survey area) (DFO 2021b). Harvests within the Orphan Basin and EL1158 and
Cambriol 3D survey areas were similar during 2017 and 2018 (Figure 4.15). Harvesting occurred
throughout May−August with peak catches in the EL1158 and Cambriol 3D survey areas in
August and September (Figure 4.16).
Environmental Assessment Update (2021) – MKI Page 21
Newfoundland Offshore Seismic Program, 2018–2023350 Atlantic Halibut Orphan
EL1158 & Cambriol
Sum of Quartile Catch Ranges 300
250
200
150
100
50
0
2017 2018
Year
Note: Sum of quartile catch ranges is the summation of catch weight quartile ranges (i.e., 1‒4) for all catch records for all species;
the greater the sum of quartile range counts, the greater the catch for a given year).
Figure 4.15. Total annual catch weight quartile codes, May‒November 2017–2018 for Atlantic halibut in
the Orphan Basin and EL1158 & Cambriol 3D survey areas (derived from DFO commercial landings
database, 2017–2018).
Atlantic Halibut Orphan - 2017
100 Orphan - 2018
EL1158 & Cambriol -2017
Sum of Quartile Catch Ranges
EL1158 & Cambriol -2018
80
60
40
20
0
May Jun Jul Aug Sep Oct Nov
Month
Note: Sum of quartile catch ranges is the summation of catch weight quartile ranges (i.e., 1‒4) for all species; the greater
the sum of quartile range counts, the greater the catch weight for a given month).
Figure 4.16. Total monthly catch weight quartile codes, May‒November 2017–2018 for Atlantic halibut in
the Orphan Basin and EL1158 & Cambriol 3D survey areas (derived from DFO commercial landings
database, 2017–2018).
Environmental Assessment Update (2021) – MKI Page 22
Newfoundland Offshore Seismic Program, 2018–20234.2.1.4 Greenland Halibut
During May‒November 2017 and 2018, harvest locations for Greenland halibut only occurred in
the Orphan Basin and EL1158 and Cambriol 3D survey areas, mainly between the 500 and 1000-m
isobaths within the central portion of the survey area (see Figures 4.9−4.10). The TAC for
Greenland halibut in NAFO Div. 3LMNO (which includes all survey areas) was set at 12,225 t for
2021, down slightly from 12,542 t in 2020 (NAFO 2021). Catches within the Orphan Basin 3D
survey area decreased from 2017 to 2018 and increased in the EL1158 and Cambriol 3D survey
area. Catches mainly occurred during the summer (Figures 4.17−4.18).
400 Orphan
Greenland Halibut
EL1158 & Cambriol
350
EL1149
300
Sum of Quartile Catch Ranges
250
200
150
100
50
0
2017 2018
Year
Note: Sum of quartile catch ranges is the summation of catch weight quartile ranges (i.e., 1‒4) for all catch records for all species;
the greater the sum of quartile range counts, the greater the catch for a given year).
Figure 4.17. Total annual catch weight quartile codes, May‒November 2017–2018 for Greenland halibut
in the Orphan Basin, EL1158 & Cambriol, and EL1149 3D survey areas (derived from DFO commercial
landings database, 2017–2018).
Environmental Assessment Update (2021) – MKI Page 23
Newfoundland Offshore Seismic Program, 2018–2023160
Greenland Halibut Orphan - 2017
140 Orphan - 2018
EL1158 & Cambriol - 2017
Sum of Quartile Catch Ranges
120
EL1158 & Cambriol - 2018
100 EL1149 - 2017
EL1149 - 2018
80
60
40
20
0
May Jun Jul Aug Sep Oct Nov
Month
Note: Sum of quartile catch ranges is the summation of catch weight quartile ranges (i.e., 1‒4) for all species; the greater the sum
of quartile range counts, the greater the catch weight for a given month).
Figure 4.18. Total monthly catch weight quartile codes, May‒November 2017–2018 for Greenland halibut
in the Orphan Basin, EL1158 & Cambriol, and EL1149 3D survey areas (derived from DFO commercial
landings database, 2017–2018).
4.2.1.5 Atlantic Cod
During May−November 2017–2018, Atlantic cod were mainly caught in water depths between
the 200–500 m and 500–1,000 m isobaths within the Orphan Basin, EL1158 and Cambriol, and
EL1149 3D survey areas (see Figures 4.11−4.12). The fishing ban for Atlantic cod has remained in
place for Div. 3LNO (NAFO 2021). The 2021 TAC for Div. 3Ps has not yet been released, but it
was set at 2,691 t for 2020 (DFO 2021b). The TAC for Atlantic cod in Div. 3M decreased from
8,531 t in 2020 to 1,500 t in 2021 (NAFO 2021). During May−November 2017–2018, Atlantic cod
catches in the Orphan Basin 3D survey area decreased from 2017 to 2018 and increased in the
EL1158 and Cambriol 3D survey area (Figures 4.19−4.20).
Environmental Assessment Update (2021) – MKI Page 24
Newfoundland Offshore Seismic Program, 2018–2023Orphan
Atlantic Cod EL1158 & Cambriol
EL1149
Sum of Quartile Catch Ranges
100
50
0
2017 2018
Year
Note: Sum of quartile catch ranges is the summation of catch weight quartile ranges (i.e., 1‒4) for all catch records
for all species; the greater the sum of quartile range counts, the greater the catch for a given year).
Figure 4.19. Total annual catch weight quartile codes, May‒November 2017–2018 for Atlantic cod in the
Orphan Basin, EL1158 & Cambriol, and EL1149 3D survey areas (derived from DFO commercial landings
database, 2017–2018).
60 Atlantic Cod Orphan - 2017
Orphan - 2018
EL1158 & Cambriol - 2017
Sum of Quartile Catch Ranges
EL1158 & Cambriol - 2018
40 EL1149 - 2017
EL1149 - 2018
20
0
May Jun Jul Aug Sep Oct Nov
Month
Note: Sum of quartile catch ranges is the summation of catch weight quartile ranges (i.e., 1‒4) for all species; the greater
the sum of quartile range counts, the greater the catch weight for a given month).
Figure 4.20. Total monthly catch weight quartile codes, May‒November 2017–2018 for Atlantic cod in the
Orphan Basin, EL1158 & Cambriol, and EL1149 3D survey areas (derived from DFO commercial landings
database, 2017–2018).
Environmental Assessment Update (2021) – MKI Page 25
Newfoundland Offshore Seismic Program, 2018–20234.2.1.6 Other Notable Commercial Species As noted in the EA (see Tables 4.3‒4.8 in LGL 2018a) and 2019/2020 EA Updates (see Table 4.1 and Section 4.2.1.6 in LGL 2019; 2020b), redfish, yellowtail flounder, white hake, and American plaice are also important commercial species in the Study Area. Redfish, yellowtail flounder, and American plaice are primarily harvested in areas where water depths are
Orphan Basin

                   Sum of Quartile Catch Ranges
                                                  80                                                                            2017
                                                                                                                                2018
                                                  60

                                                  40

                                                  20

                                                   0
                                                           Witch Flounder       Roughhead              Redfish        Capelin
                                                                                Grenadier
                                                                                            Species

                                                                                Jeanne d'Arc 2018
                   Sum of Quartile Catch Ranges

                                                  20

                                                  15

                                                  10

                                                   5

                                                   0
                                                              Propeller Clam                 Cockle              Arctic Surfclam
                                                                                            Species

                                                                                EL1158 & Cambriol
              Sum of Quartile Catch Ranges

                                                                                                                                2017
                                                  350
                                                                                                                                2018
                                                  300
                                                  250
                                                  200
                                                  150
                                                  100
                                                   50
                                                       0
                                                               Witch Flounder                Redfish             American Plaice
                                                                                             Species
           Note: Sum of quartile catch ranges is the summation of catch weight quartile ranges (i.e., 1‒4) for all
           catch records for all species; the greater the sum of quartile range counts, the greater the catch for a
           given year).

Figure 4.21. Total annual catch weight quartile codes, May‒November 2017–2018 for American plaice,
redfish, roughhead grenadier, and witch flounder in the Orphan Basin 3D survey area (top), May−November
2018 for cockle, propeller clam, and Arctic surfclam in the Jeanne d’Arc 3D survey area (middle), and
May‒November 2017–2018 for American plaice, redfish, and witch flounder in the EL1158 & Cambriol 3D
survey area (bottom) (derived from DFO commercial landings database, 2017–2018).

Environmental Assessment Update (2021) – MKI                                                                                           Page 27
Newfoundland Offshore Seismic Program, 2018–2023
You can also read