Environmental controls on surf zone injuries on high-energy beaches
←
→
Page content transcription
If your browser does not render page correctly, please read the page content below
Nat. Hazards Earth Syst. Sci., 19, 2183–2205, 2019
https://doi.org/10.5194/nhess-19-2183-2019
© Author(s) 2019. This work is distributed under
the Creative Commons Attribution 4.0 License.

Environmental controls on surf zone injuries on high-energy beaches
Bruno Castelle1,2 , Tim Scott3 , Rob Brander4 , Jak McCarroll3 , Arthur Robinet5 , Eric Tellier6,7,8 , Elias de Korte9 ,
Bruno Simonnet8 , and Louis-Rachid Salmi6,7,10
1 CNRS,    UMR EPOC, Univ. Bordeaux, Pessac, France
2 UMR    EPOC, Univ. Bordeaux, Pessac, France
3 Coastal Processes Research Group, School of Biological and Marine Sciences, University of Plymouth, Plymouth, UK
4 School of Biological, Earth and Environmental Sciences, UNSW Sydney, Sydney, Australia
5 Bureau de Recherche en Géologie Minière, Orléans, France
6 INSERM, ISPED, Centre INSERM U1219 Bordeaux Population Health Research, Univ. Bordeaux, Bordeaux, France
7 ISPED, Centre INSERM U1219 Bordeaux Population Health Research, Univ. Bordeaux, Bordeaux, France
8 Pôle Urgences Adultes, CHU de Bordeaux, SAMU-SMUR, Bordeaux, France
9 Institute for Marine and Atmospheric Research, Department of Physical Geography, Faculty of Geosciences,

Utrecht University, Utrecht, the Netherlands
10 Pôle de Santé Publique, CHU de Bordeaux, Service d’Information Médicale, Bordeaux, France

Correspondence: Bruno Castelle (bruno.castelle@u-bordeaux.fr)

Received: 28 March 2019 – Discussion started: 13 May 2019
Revised: 1 August 2019 – Accepted: 29 August 2019 – Published: 9 October 2019

Abstract. The two primary causes of surf zone injuries            tional drowning incidents occurred at spring high tide, pre-
(SZIs) worldwide, including fatal drowning and severe spinal      sumably due to small-scale swash rips. The composite wave
injuries, are rip currents (rips) and shore-break waves. SZIs     and tide parameters proposed by Scott et al. (2014) are key
also result from surfing and bodyboarding activity. In this pa-   controlling factors determining SZI occurrence, although the
per we address the primary environmental controls on SZIs         risk ranges are not necessarily transferable to all sites. Sum-
along the high-energy meso–macro-tidal surf beach coast           mer beach and surf zone morphology is interannually highly
of southwestern France. A total of 2523 SZIs recorded by          variable, which is critical to SZI patterns. The upper beach
lifeguards over 186 sample days during the summers of             slope can vary from 0.06 to 0.18 between summers, resulting
2007, 2009 and 2015 were combined with measured and/or            in low and high shore-break-related SZIs, respectively. Sum-
hindcast weather, wave, tide, and beach morphology data.          mers with coast-wide highly (weakly) developed rip channels
All SZIs occurred disproportionately on warm sunny days           also result in widespread (scarce) rip-related drowning inci-
with low wind, likely because of increased beachgoer num-         dents. With life risk defined in terms of the number of peo-
bers and hazard exposure. Relationships were strongest for        ple exposed to life threatening hazards at a beach, the ability
shore-break- and rip-related SZIs and weakest for surfing-        of morphodynamic models to simulate primary beach mor-
related SZIs, the latter being also unaffected by tidal stage     phology characteristics a few weeks or months in advance is
or range. Therefore, the analysis focused on bathers. More        therefore of paramount importance for predicting the primary
shore-break-related SZIs occur during shore-normal incident       surf zone life risks along this coast.
waves with average to below-average wave height (signifi-
cant wave height, Hs = 0.75–1.5 m) and around higher water
levels and large tide ranges when waves break on the steepest
section of the beach. In contrast, more rip-related drownings     1   Introduction
occur near neap low tide, coinciding with maximised chan-
nel rip flow activity, under shore-normal incident waves with     Sandy surf beaches are an attractive environment for a vari-
Hs > 1.25 m and mean wave periods longer than 5 s. Addi-          ety of recreational activities globally, including sunbathing,
                                                                  swimming and wading, bodyboarding, and surfing (West,

Published by Copernicus Publications on behalf of the European Geosciences Union.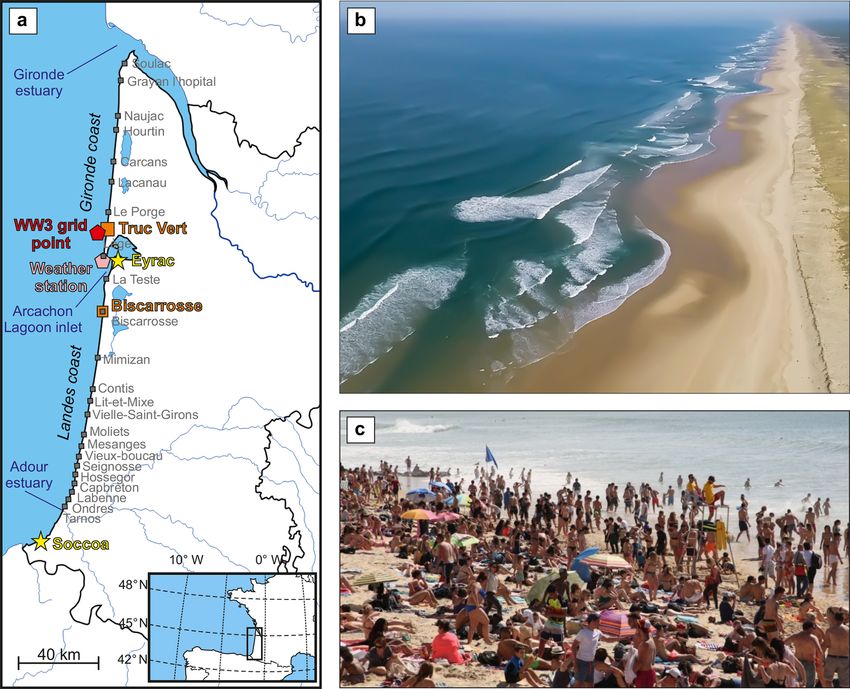
2184                                B. Castelle et al.: Environmental controls on surf zone injuries on high-energy beaches

2005). However, surf beaches can also be dangerous environ-        trum of sustained spinal pathologies (Dimmick et al., 2013;
ments to those who choose to enter the water, due to poten-        Nathanson, 2013), sprains and strains, fractures, dislocations,
tially powerful wave conditions, strong currents, and the risk     and lacerations (Moran and Weber, 2013) for the surf craft
of collision and impact injury involving surf craft. Although      users and other people in the water. Lacerations, which are
global statistics are not available, annual fatal drownings on     caused by the sharp fin, tail or nose of the surfboard, are the
surf beaches worldwide are at least in the hundreds (Gilchrist     most common injuries sustained whilst surfing (Lowdon et
and Branche, 2016).                                                al., 1983; Nathanson, 2013).
   It is well established that the leading cause of both fatal        Several attempts have been made to correlate the occur-
and non-fatal drowning incidents on surf beaches worldwide         rence of these surf zone hazards and, in some cases, result-
are strong, narrow, seaward-flowing rip currents (hereafter        ing rescues and SZIs with environmental conditions. In the
referred to as “rips”). Rips often originate close to the shore-   case of rips, it is well established that channel rip activ-
line and can extend well beyond the breakers (Brander and          ity is controlled by offshore wave conditions (e.g. Brander,
Scott, 2016). They are capable of transporting bathers of all      1999; MacMahan et al., 2005; Castelle et al., 2006; Austin
swimming abilities offshore into deeper water, increasing the      et al., 2010; Bruneau et al., 2011; Winter et al., 2014) and
risk of drowning through panic and exhaustion (Brander et          tide elevation (Aagaard et al., 1997; MacMahan et al., 2006;
al., 2011; Drozdzewski et al., 2012, 2015). Annually, they         Bruneau et al., 2009; Austin et al., 2014). Surf zone morphol-
are responsible for an estimated 57 and 21 fatal drownings         ogy is also critical to rip activity, with deeper rip channels
on surf beaches in the United States and Australia, respec-        resulting in more intense rips (Brander, 1999; Aagaard and
tively, alone (NOAA, 2017; Brighton et al., 2013). They are        Vinther, 2008; Moulton et al., 2017a; McCarroll et al., 2018).
also considered to be the cause of the vast majority of life-      Given that rip speed is an effective proxy for the physical
guard rescues and surf zone injuries (SZIs) in most docu-          hazard posed by rips (Moulton et al., 2017b) and that warm
mented regions of the world (e.g. 81 % in the US, USLA,            sunny days with low winds typically result in increased beach
2015; 57.4 % in Australia, Brighton et al., 2013; 34 % in the      attendance and beachgoer exposure to hazards (Ibarra, 2011),
UK, RNLI, 2017). Although rips can form through a variety          rip risk predictors based on simple correlations between me-
of driving mechanisms and have different hydrodynamic be-          teorological, oceanographic conditions and the incidence of
haviours, they are essentially driven by the action of breaking    rip-related rescues have been developed (Lushine, 1991; Las-
waves (Castelle et al., 2016a). One of the most common rip         cody, 1998; Dusek and Seim, 2013).
types worldwide flows through channels incised in nearshore           Such simple risk predictors are challenged in high-energy
sandbars (e.g. MacMahan et al., 2006; Houser et al., 2013;         meso–macro-tidal environments. Large water level variations
Winter et al., 2014). These channel rips exhibit considerable      deeply modulate rip flow and hazard (Austin et al., 2013)
natural variability in terms of flow characteristics and be-       and breaker type (Wright and Short, 1984) and beachgoer
haviour (McCarroll et al., 2018), preventing the public pro-       exposure can be strongly reduced for large waves as high surf
motion of any single simple and universal escape strategy for      tends to discourage beachgoers from entering the surf zone.
those who find themselves caught in one (Bradstreet et al.,        However, beachgoer exposure data are unavailable in most
2014; McCarroll et al., 2014, 2015; Castelle et al., 2016b).       instances. Therefore, reported SZI incidents and/or rescues
   More recently, attention has been given towards the threat      provide information on the full life risk signal (Stokes et al.,
posed to bathers by shore-break waves associated with              2017), where life risk can be defined in terms of the number
plunging and dumping waves at the shorelines of steep              of people exposed to life threatening hazards at a beach and
beaches. The concentrated and intense wave impact can              their vulnerability to those hazards (Kennedy et al., 2013):
cause SZIs, including severe spine injuries, to those caught
in the impact zone (Robles, 2006; Puleo et al., 2016). Shore-      liferisk = hazard × exposure.                               (1)
break waves are, on average, associated with a low propor-
tion of surf zone rescues and injuries in most of existing         In contrast to rips, studies on environmental controls on
studies (e.g. 8.5 % of leading cause of rescue in Australia,       shore-break-related SZIs are scarce and show poor correla-
Brighton et al., 2013; 13 % in UK, RNLI, 2017), although           tions. For example, along the Delaware coast of the United
higher proportions can be found (44.6 % of the SZIs on the         States, Puleo et al. (2016) did not find any statistically sig-
coarser-grained and steeper beaches of southwestern France         nificant relation between shore-break-related SZIs and en-
in Castelle et al., 2018a). More locally, shore-break waves        vironmental factors such as tidal stage and foreshore slope.
were found to be responsible for over 82 % of the SZIs on          Although plunging and/or shore-break waves are known to
the steep beaches of Ocean City, Maryland (Muller, 2018).          occur for long-period waves and/or steep beach slopes (Bat-
Another group of SZIs, which has received somewhat less            tjes, 1974), Puleo et al. (2016) only noted that the highest
attention and has been systematically treated separately from      injury rates were associated with moderate wave heights.
incidents involving bathers, are injuries associated with surf-    They therefore suggested that shore-break-related SZI rates
ing, bodyboarding and other surf craft. Such high-risk ac-         are primarily related to human factors. Finally, to our knowl-
tivity (Diehm and Armatas, 2004) can lead to a wide spec-          edge there is no scientific contribution to the environmental

Nat. Hazards Earth Syst. Sci., 19, 2183–2205, 2019                         www.nat-hazards-earth-syst-sci.net/19/2183/2019/
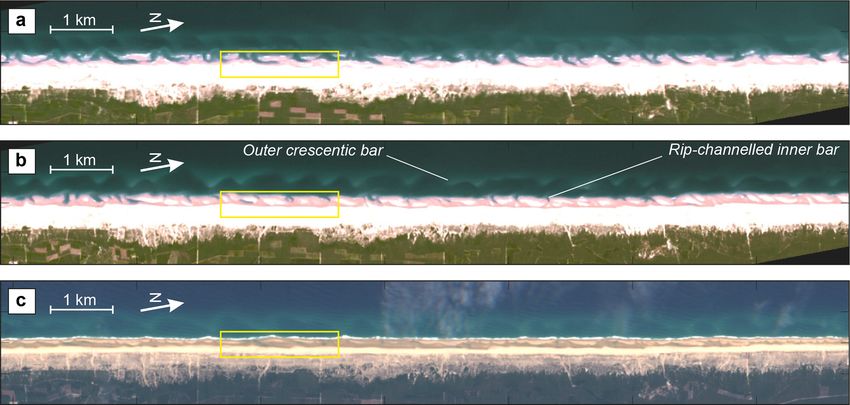
B. Castelle et al.: Environmental controls on surf zone injuries on high-energy beaches                                       2185

controls on SZIs sustained whilst using various types of surf      nate between low and high life risk conditions. This contribu-
craft.                                                             tion is the first to study the environmental controls, including
   Understanding the environmental controls on life risk           coastal morphology, on all primary causes and activity lead-
along the coast requires accurate SZI records combined with        ing to SZIs and has strong implications towards future beach
detailed wave, tide and weather data at the time of the in-        safety management and education of beach users in south-
cidents. Focusing on rips along the meso–macro-tidal rip-          western France and globally, particularly if the parameters
channelled beaches of Devon and Cornwall in the south-             can be generalised.
western UK, Scott et al. (2014) compared the average fre-
quency distribution of key environmental parameters (e.g.
wave height, tide elevation, wind speed) with those computed       2   Regional setting
from the environmental parameters associated with each
recorded rip incident. Differences between the distributions       The study area is the Gironde and Landes coasts in south-
showed that high-risk, high-exposure scenarios for bathers         western France, which extends 230 km from the Adour estu-
occur disproportionately around mean low water on days             ary in the south to the Gironde estuary in the north (Fig. 1a).
with below average wave height, long wave period, shore-           The coastline is interrupted only by the large-scale Arca-
normal wave approach and light winds. Scott et al. (2014)          chon inlet separating the Landes and Gironde coasts in the
further developed two composite wave and tide parameters           south and north, respectively (Fig. 1a). Beaches are rela-
for which thresholds were successful in discriminating be-         tively straight (Fig. 1b) and primarily composed of fine to
tween high life risk events. However, it is unclear if these       medium quartz sand with a mean grain size varying from
composite parameters work for other beaches (globally) and         200 to 400 µm, increasing southwards (Lorin and Viguier,
if similar thresholds are found, and it is unknown if they can     1987). They are all backed by high and wide coastal dunes
be useful for other SZIs such as those caused by shore-break       (Tastet and Pontee, 1998), except along some of the coastal
waves or sustained whilst surfing.                                 towns (Capbreton, Mimizan, Biscarrosse, Montalivet, Soulac
   Morphological beach state, which exerts a strong control        and Lacanau; see Fig. 1; Castelle et al., 2018b). Beaches
on the hazard posed by rips (Wright and Short, 1984) and           are exposed to high-energy ocean waves generated in the
shore-break waves (Battjes, 1974), is constantly evolving on       North Atlantic Ocean coming from the west-northwest di-
the timescales from days (storms) to seasonal to multi-annual      rection (Butel et al., 2002; Castelle et al., 2017). Overall, the
scales (e.g. Splinter et al., 2014, 2018; Pianca et al., 2015;     wave height very slightly increases (< 10 %) southwards be-
Davidson et al., 2017; Dodet et al., 2019), owing to changes       cause of the narrowing continental shelf reducing the bot-
in wave regimes. However, all existing SZI and rip-rescue          tom friction, resulting in less energy dissipation of the in-
studies have overlooked the influence on life risk at the beach    coming ocean waves (Castelle et al., 2018b). The coast is
from key morphological parameters, such as variations in rip       meso–macro-tidal with the tidal range marginally increas-
channel depth or upper beach slope. The influence of interan-      ing northwards (< 15 %) owing to the widening continental
nual morphological changes on interannual life risk variabil-      shelf (Le Cann, 1990). Neap tidal range is typically smaller
ity at a given coast is largely unexplored. Finally, shore-break   than 1.5 m, with the highest astronomical tidal range reach-
and rip SZIs and/or rescues have been systematically treated       ing approximately 5 m. The beaches are rip-dominated (e.g.
separately in previous work, despite the fact that they can co-    Bruneau et al., 2011) and mostly intermediate double barred
exist at certain surf beaches (Castelle et al., 2018a).            (Castelle et al., 2007). The outer bar is modally crescentic
   The southwestern coast of France hosts 230 km of meso–          (Lafon et al., 2005; Almar et al., 2010), while the inner bar
macro-tidal sandy beaches that are visited by millions of          is predominantly rip-channelled (Fig. 1b). Rip spacing of the
tourists each summer (Brumaud, 2016) and are considered            inner and outer bars is about 400 and 700 m, respectively, and
to be surf beaches. Castelle et al. (2018a) showed that along      progressively decreases northwards (Castelle et al., 2007).
this stretch of coast, a large number of bather SZIs occur due        The wave climate and resulting beach morphology are
to shore-break waves and channel rips, with a large number         strongly seasonally modulated. Offshore of Truc Vert, which
of additional SZIs sustained whilst surfing. The combination       is located approximately at the centre of the study region, the
of large tide range and variable incident energetic wave cli-      monthly averaged significant wave height (Hs) peaks at 2.4 m
mate and weather conditions result in complex and highly           during winter in January with a dominant W direction. The
variable patterns of SZIs. The primary aim of this paper is        99.5 % significant wave height quantile Hs99.5 % is 5.6 m and
to build upon the dataset of lifeguard-reported incidents of       severe storms Hs > 8 m can occur in winter. In contrast, sum-
SZIs used by Castelle et al. (2018a) by examining extensive        mers are characterised by milder waves with a monthly mean
environmental data, including local to large-scale morpho-         Hs of approximately 1.2 m and a dominant west-northwest
logical data, to address the primary environmental controls        direction (Castelle et al., 2017), although storms with Hs >
on the full life risk spectrum at a high-energy meso–macro-        3 m can occur. In summer, beaches become more reflective
tidal coast. This study also aims to address the genericity        with the inner bar often migrating from a transverse bar and
of the two composite wave and tide parameters to discrimi-         rip state to a more reflective low-tide terrace state according

www.nat-hazards-earth-syst-sci.net/19/2183/2019/                          Nat. Hazards Earth Syst. Sci., 19, 2183–2205, 2019
2186                                  B. Castelle et al.: Environmental controls on surf zone injuries on high-energy beaches

Figure 1. (a) Location map of southwestern France showing the 230 km long sandy beach study location encompassing the Gironde and
Landes coasts between the Adour and Gironde estuaries. Grey squares indicate coastal municipalities where incident or injury report forms
were gathered, yellow stars indicate tide gauges, and the red and pink polygons show the location of the Wave Watch III (WW3) model output
grid point and weather station, respectively. (b) Aerial photograph of Truc Vert beach taken at low tide, showing a landscape representative
of the southwestern French beaches with deep rip channels and steeper upper beach slopes (Ph. Vincent Marieu). (c) Crowded beach during
summer at high tide with lifeguards supervising a bathing area delimited by two blue flags, typically extending no more than 100 m alongshore
(Ph. Julien Lestage).

to the classification of Wright and Short (1984). Steeper up-               The southwestern coast of France also hosts some of the
per beach slopes during summer also favour beach cusp de-                finest surfing beaches in Europe, attracting many surfers.
velopment in the vicinity of the high-tide mark, and beaches             During busy summer months, large numbers of surfers of
are usually steeper in the south owing to larger mean grain              all abilities, including surf schools, expose themselves to
size (Lorin and Viguier, 1987). Summer beach morphology                  hazards related to surfing activity. Beaches are patrolled by
is also strongly variable from year to year in relation to the           lifeguards during the summer months of July and August,
strong interannual wave climate variability (Robinet et al.,             with extended periods of patrols at the busiest beaches, with
2016; Dodet et al., 2019).                                               a designated and supervised bathing zone. However, given
   Beaches are characterised by strong rips primarily flow-              the length of the coast and the many remote beach access
ing through the inner-bar rip channels (Bruneau et al., 2011,            paths through coastal dune tracks from inland car parks,
Fig. 1b) with mean flow speeds reaching 1 m s−1 even in                  many access points are situated on unpatrolled sections of
relatively low wave energy conditions (< 1 m wave height;                beaches, kilometres away from any lifeguard presence. Ap-
Castelle et al., 2016b). Rip flow is tide-modulated (through             proximately 4–5 million tourists, primarily from France and
modulation of breaking wave patterns) with maximum rip                   other European nations, come to the Gironde and Landes
activity typically between low tide and mid-tide in summer               coasts each year to enjoy the beaches (Brumaud, 2016),
wave conditions (Bruneau et al., 2009). In addition, near high           simultaneously exposing themselves to surf zone hazards
tide, waves can break close to the shoreline on the steepest             (Fig. 1c). Thousands of SZIs are sustained each year, of
beach sections, creating hazardous shore-break conditions.               which over a thousand are documented by lifeguards in in-

Nat. Hazards Earth Syst. Sci., 19, 2183–2205, 2019                               www.nat-hazards-earth-syst-sci.net/19/2183/2019/
B. Castelle et al.: Environmental controls on surf zone injuries on high-energy beaches                                     2187

jury report forms (Castelle et al., 2018a). Overall, SZIs sus-    n = 844); (2) caused by rips but excluding surfers and body-
tained range from mild contusion to fatal drowning and in-        boarders (8.7 % of the dataset, n = 220), hereafter referred
clude severe spinal injuries, wounds and dislocation (Castelle    to as rip-related injuries, which essentially consist of fatal
et al., 2018a).                                                   and non-fatal drowning incidents, with rips causing 83 % of
                                                                  the drowning incidents reported; and (3) caused by shore-
                                                                  break waves but excluding surfers and bodyboarders (41.7 %
3     Data                                                        of the dataset, n = 1053), which primarily result in contu-
                                                                  sion, sprain, or dislocation (51 %; n = 537) and spine injuries
The dataset of lifeguard-reported incidents of SZIs in south-     (29.8 %, n = 314). For each SZI, the date, time and location
western France presented in Castelle et al. (2018a) is com-       (coastal municipalities in Fig. 1a) reported in the form were
bined with extensive environmental data to address the pri-       used to estimate the wave, tide and meteorological conditions
mary environmental controls and high-risk conditions lead-        at the time of the incident using the environmental dataset de-
ing to bather SZIs caused by shore-break waves and channel        scribed below.
rips and to SZIs sustained whilst surfing. The environmen-
tal dataset includes weather data, local beach and large-scale
                                                                  3.2   Environmental data
coastal morphology, and tide and wave hindcasts.

3.1    SZI data                                                   In order to obtain a continuous time series of wave condi-
                                                                  tions, 6-hourly outputs from a wave hindcast (Boudière et
The SZI dataset collected in Castelle et al. (2018a) is used      al., 2013) based on the spectral wave model Wave Watch III
here for further analysis. Each time a medical incident oc-       (Tolman, 2014) were used. The hindcast was performed on
curs on the beach, a lifeguard responds to the scene to pro-      an unstructured grid with a resolution increasing from 10 km
vide patient care and to potentially assist paramedics. An        offshore to 200 m near the coast and has been extensively val-
injury report form, as detailed in Castelle et al. (2018a), is    idated (Boudière et al., 2013; Ardhuin et al., 2012). Given the
filed for every incident. A total of 2523 SZIs over 186 sam-      weak gradient in wave conditions along the coast, the wave
ple days during the summers of 2007, 2009 and 2015 were           data at grid point 44.7374◦ N, 1.3232◦ W at approximately
collected and examined by Castelle et al. (2018a), who ad-        30 m in depth was used and considered representative of the
dressed the epidemiology of SZIs. Amongst all the data anal-      entire coast (Castelle et al., 2018b). Using this dataset, each
ysed in Castelle et al. (2018a), only date and time (< 10 min     incident was associated with a significant wave height Hs,
accuracy) of the incident, beach location, categorically ticked   mean and peak wave periods T 02 and Tp, respectively, and
activity (e.g. wading, surfing, bodyboarding), cause of injury    wave angle θ .
(e.g. rip current, shore-break waves), and injury type (e.g.         A tidal component analysis of a 3-month time series of
drowning, spine injury) are used herein. In addition, open-       continuous, storm-free, Soccoa tide gauge data (Fig. 1) was
text-field comments in the form were sometimes used, for          performed to reconstruct a tide level time series (elevation
instance, to understand the cause of incident (e.g. collision     every 10 min). The average phase lag between the Soccoa
against someone else, or against their own surfboard) as there    tide gauge and beaches of all coastal municipalities (grey
is no such box to tick in the forms provided. In the case of a    squares in Fig. 1) was estimated using tide charts from the
drowning incident, the drowning stage was also provided ac-       Service Hydrographique et Océanographique de la Marine
cording to a four-stage classification widely used in France      (France). Errors due to the (time-varying) phase lag and am-
(Menezes and Costa, 1972; Dupoux et al., 1981): (1) exhaus-       plitude difference between real and predicted tide result in
tion but no sign of aspiration of water; (2) moderate respi-      an estimated maximum error in tide elevation of 0.3 m at all
ratory impairment, anxiety; (3) altered consciousness, severe     sites. Using this dataset, each incident was associated with a
respiratory impairment or acute pulmonary oedema, tachy-          tide elevation η and a daily tide range (TR).
cardia or hypotension; and (4) coma, respiratory or cardiac          We used RADOME (Réseau d’Acquisition de Données
arrest.                                                           d’Observations Météorologiques Etendu), which is an auto-
   Overall, Castelle et al. (2018a) showed that while rips        matic weather station network of Météo-France that collects
cause the most severe injuries (drowning), a large number of      meteorological data at 554 stations across France. Hourly
SZIs, including severe spinal injuries, are caused by shore-      data of air temperature (T ), mean wind speed (W ) and insola-
break waves. Another large proportion of injuries are re-         tion (I ) collected at the Cap Ferret station (Fig. 1) were used
lated to surfing and bodyboarding activity. Within the beach-     to estimate weather conditions at the time of each incident.
goer cohort, surfers do not enter the water for the same rea-     Given the relative homogeneity of the coast and weather pat-
sons as regular bathers. Therefore, in the present contribu-      terns in the region, as well as the lack of other weather sta-
tion we discriminate between injuries (1) sustained while         tions directly implemented on the coast, these data were as-
surfing or bodyboarding, whatever the cause, hereafter re-        sumed to be representative of the weather along the entire
ferred to as surfing-related injuries (33.5 % of the dataset,     study area. The corresponding daily mean values (T , W and

www.nat-hazards-earth-syst-sci.net/19/2183/2019/                         Nat. Hazards Earth Syst. Sci., 19, 2183–2205, 2019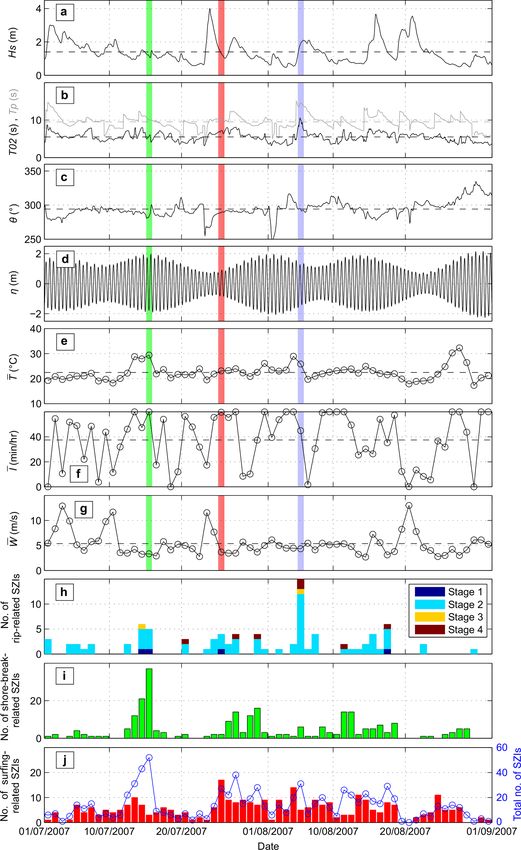
2188                                B. Castelle et al.: Environmental controls on surf zone injuries on high-energy beaches

I ), averaged during the patrolled hours between 11 and 19 h,      ber, of surfing-related SZIs (n = 1.0 with a maximum of
were also computed.                                                4, standard deviation σ = 1.5). This is likely due to strong
    The morphological state of the beaches was estimated           onshore winds being typically associated with messy and
primarily using the topographic data collected at Truc Vert        choppy sea states that strongly deteriorate surfing wave qual-
beach, located in the south of the Gironde coast (Fig. 1).         ity and, in turn, the number of surfers entering the water. Rip-
From 8 April 2005 to present, topographic surveys have been        related (n = 1.2, σ = 2.1) and shore-break-related (n = 6.0,
performed at spring low tide every 2 or 4 weeks with an            σ = 8.0) injuries are much more variable in time with many
alongshore coverage that progressively increased from ap-          days with no injury reported. These injuries tend to occur in
proximately 300 m in 2005 to approximately 1500 m since            clusters with particular days prone to rip-related drowning in-
2012 (Castelle et al., 2017). SPOT and Sentinel satellite          cidents or shore-break-related SZIs (Fig. 2h, i). Clearly, days
large-scale images taken at low tide, which therefore show         with a large number of drowning incidents caused by rips
the intertidal inner-bar system, were collected. This morpho-      are not necessarily associated with a large number of shore-
logical dataset was used to address the overall differences        break-related injuries and vice versa.
in beach morphology, rip channel characteristics and upper            Considering the entire 3-year dataset, the number of
beach slope between the three summers.                             rip- and shore-break-related daily injuries are weakly posi-
    Additional morphological data from Biscarrosse beach           tively correlated (r = 0.28), similar to rip drowning incidents
were also used. A field experiment was performed at Biscar-        and surfing-activity-related injuries (r = 0.25), while shore-
rosse on 13-17 June 2007, during which the topo-bathymetry         break-related injuries are more correlated with injuries re-
was accurately surveyed along approximately 2000 m of              sulting from surfing activity (r = 0.43). A possible explana-
beach (Bruneau et al., 2009, 2011). This morphology, which         tion of this larger correlation is that amongst all the reported
can be assumed to be representative of the beach morphol-          surfing-related injuries (n = 844), 8.5 % (n = 72) were re-
ogy throughout the 2007 summer, was used to address wave           ported to be caused by shore-break waves, as opposed to
transformation and wave-driven currents during that summer.        0.6 % (n = 5) caused by rips. This is in line with earlier stud-
For this purpose, an Xbeach model (Roelvink et al., 2009)          ies showing that injuries resulting from surfing and body-
was implemented on a 10 m × 10 m regular grid to address           boarding occur more frequently in shore-break conditions
the influence of offshore wave conditions and tidal eleva-         (e.g. Beratan and Osborne, 1987; Chang et al., 2006).
tion on rip flow dynamics and resulting hazard. The model,            Overall, there appears to be no single environmental fac-
which is depth-averaged and wave-group resolving, has been         tor controlling the occurrence of SZIs. Instead, it is possi-
demonstrated to be suitable for this purpose even when de-         ble that certain combinations of environmental controls are
fault settings were used (Castelle et al., 2016b).                 conducive to causing SZIs and that these combinations de-
                                                                   pend on the type of SZI. To better understand these combi-
                                                                   nations promoting life risk surf zone conditions, the approach
4     Results                                                      of Scott et al. (2014) was utilised, whereby the environmen-
                                                                   tal conditions during which incidents occurred were com-
4.1    Environmental controls                                      pared with the “average” background conditions of the 2007,
                                                                   2009 and 2015 summer seasons. The environmental param-
Figure 2 shows time series of environmental factors and            eters addressed here are significant wave height, Hs; mean
SZIs, discriminating rip-related drownings and SZIs related        wave period, T 02; peak wave period, Tp; wave direction, θ ;
to shore-break waves and surfing activity during the 2007          tide or water level, η; daily tide range, TR; daily averaged
summer. This time series, which is representative in the pat-      air temperature, T ; insolation, I ; and wind speed, W . The
terns of the two other summers, clearly shows some complex         average frequency distribution of these parameters was com-
relations between the occurrence of different SZIs and en-         pared with those computed from the environmental parame-
vironmental factors. During this summer, the coast was ex-         ters associated with each recorded rip incident. Differences
posed to a broad range of wave conditions, with Hs and Tp          between the distributions therefore provides an indication of
ranging between approximately 0.4 and 4 m and 5 and 16 s,          environmental conditions that may be driving SZIs (Scott et
respectively, with waves coming from the southwest to the          al., 2014).
north but predominantly from the west-northwest (Fig. 2a–             Figure 3 provides insights into the environmental con-
c), resulting in highly variable amount of daily SZIs (Fig. 2j).   trols on surfing-related injuries in southwestern France. The
The least temporally variable SZIs are those sustained whilst      frequency distributions (Fn) of the wave parameters related
surfing, which occur almost throughout the summer (daily           to reported incidents show some differences from the aver-
mean for the entire dataset n = 4.5, standard deviation σ =        age background distributions with conditions of Hs = 0.75–
3.3). The only notable exception is for days with large daily      1.5 m, T 02 = 6–8 s and θ = 290–300◦ being slightly over-
mean wind speed W (> 10 m s−1 ), coming systematically             represented by 10.5 %, 9.2 % and 6.2 %, with 60.3 %, 36.4 %
from the southwest–northwest quadrant (not shown). These           and 46.8 % occurring within this range, respectively (Fig. 3a–
windy conditions systematically result in no, or a small num-      c). In contrast, water level does not substantially affect

Nat. Hazards Earth Syst. Sci., 19, 2183–2205, 2019                         www.nat-hazards-earth-syst-sci.net/19/2183/2019/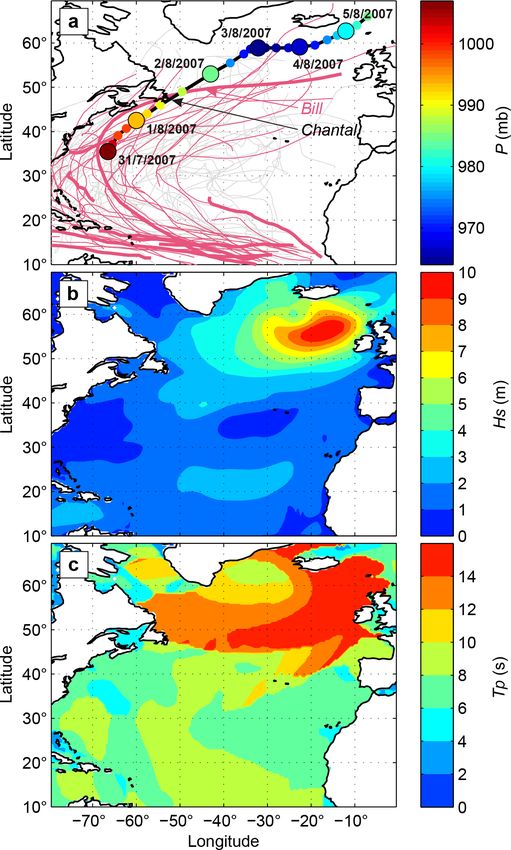
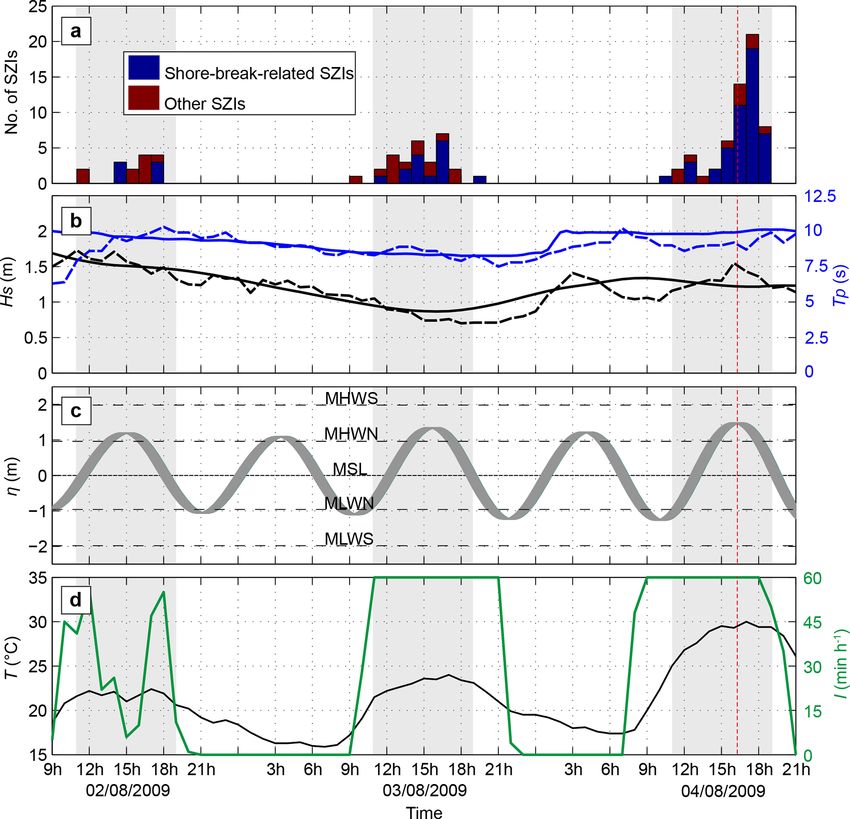
B. Castelle et al.: Environmental controls on surf zone injuries on high-energy beaches                                                    2189

Figure 2. Time series during the 2007 summer of (a) significant wave height, Hs; (b) peak and mean wave periods, Tp and T 02, respectively;
(c) wave direction, θ ; (d) water level, η, with respect to mean sea level; (e) daily mean air temperature, T ; (f) daily mean hourly insolation,
I ; (g) daily mean wind speed, W ; (h) distribution of rip-related SZIs; (i) distribution of shore-break-related SZIs; and (j) distribution of
surfing-activity-related SZIs and total number of SZIs. In panels (a)–(g) the shaded green, red and blue vertical areas indicate the days with
the largest number of shore-break-, surfing- and rip-related SZIs during the 2007 summer. In panels (a), (b), (c), (e), (f) the summer mean is
indicated by the horizontal dashed line.

www.nat-hazards-earth-syst-sci.net/19/2183/2019/                                   Nat. Hazards Earth Syst. Sci., 19, 2183–2205, 2019
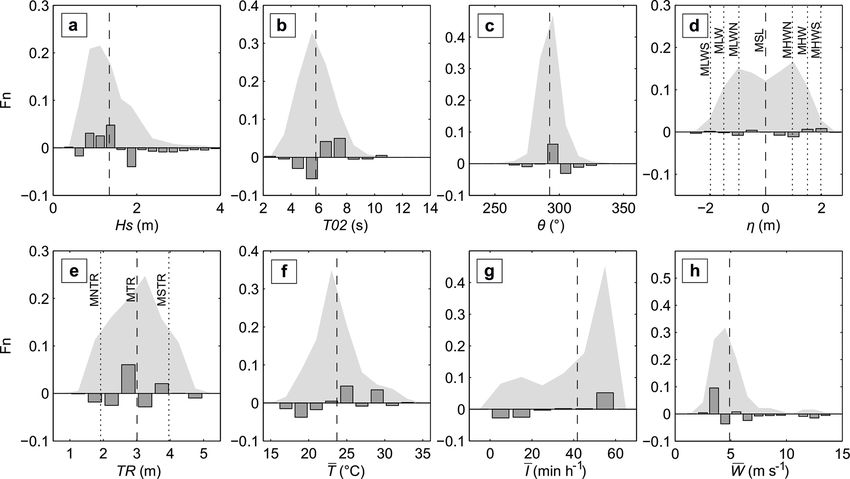
2190                                   B. Castelle et al.: Environmental controls on surf zone injuries on high-energy beaches

Figure 3. Environmental controls on surfing-activity-related SZIs: normalised frequency distributions Fn during the summers of 2007, 2009
and 2015 (light grey region), referred to as “average” background distribution, of (a) significant wave height, Hs; (b) mean wave period,
T 02; (c) wave direction, θ ; (d) water level, η; (e) daily tide range, TR; (f) daily mean air temperature, T ; (g) daily mean hourly insolation,
I ; and (h) daily mean wind speed, W . The dark grey bars show the difference between surfing-related and average background distributions
and the vertical dashed lines indicate background means.

surfing-related incidents as no clear pattern stands out                   age background distributions with conditions of Hs = 0.75–
(Fig. 3d), while daily tidal range (TR) shows a local peak                 1.5 m (average to below-average), T 02 > 7 s (above-average)
near the mid-tide range (MTR, Fig. 3e). Incidents occur-                   and θ = 290–300◦ being over-represented by 18.1 %, 6.8 %
ring for low wind speed (W < 4 m s−1 ) and for warm and                    and 8.6 %, with 70.0 %, 16.0 % and 46.8 % occurring within
sunny weather (T > 24◦ , I > 50 min h−1 ) were overrepre-                  this range, respectively (Fig. 4a–c). Incidents occurring at
sented by 10.1, 6.6 and 5.2 %, with 32.2 %, 38.2 % and                     low below-average wind speed (W < 4 m s−1 ) and for warm
45.2 % occurring within this range, respectively (Fig. 3f–h).              and sunny weather (T > 24◦ , I > 40 min h−1 ) were overrep-
Therefore, more high-risk surfing incident scenarios occur on              resented by 16.0 %, 26.5 % and 14.6 %, with 32.2 %, 38.1 %
days with low to moderate (average to below average) wave                  and 62.9 % occurring within this range, respectively (Fig. 3f–
height, large (above average) wave period (T 02 > 6 s and                  h). These are again in higher proportion than for surfing-
Tp > 9 s, not shown), west-northwest incidence and warm                    related injuries.
sunny weather with low wind (below average), regardless of                    Figure 5 shows the same analysis for rip-related injuries.
water level or daily tide range. As surfers can be considered              Similar to shore-break- and surfing-related injuries, more rip-
a more experienced beachgoer community, the SZIs involv-                   related injuries occur on warm, sunny days with light wind.
ing only bathers are assessed below, with shore-break- and                 Days with low wind speed (W < 4 m s−1 ) and warm, sunny
rip-related injuries investigated separately.                              weather (T > 24◦ , I > 40 min h−1 ) were over-represented
   Figure 4 shows the same analysis but for shore-break-                   by 7.2 %, 7.9 % and 11.6 %, with 32.2 %, 38.1 % and 62.9 %
related injuries and reveals more prominent and sometimes                  occurring within this range, respectively (Fig. 5f–h). While
different patterns compared to surfing-related injuries. The               this over-representation is less important than for shore-
most salient difference is that tide plays a critical role,                break-related injuries, it is slightly more pronounced than for
with water level η > 1.25 m (> MHWN, mean high water                       surfing-related injuries. The control of waves on rip-related
neap) and daily tide range TR > 3.5 m (spring tides) being                 SZIs contrasts with that on the other SZIs. Larger waves with
over-represented by 32.5 % and 10.6 %, with 13.5 % and                     more shore-normal incidence increase the likelihood of rip-
27.4 % occurring within this range, respectively (Fig. 4d,                 related injuries, as significant differences from the average
e). The influence of wave and weather conditions is also                   background distributions are found for conditions of Hs >
more pronounced than for surfing-related injuries. The fre-                1.25 m (average to above-average) and θ = 280–290◦ , with
quency distributions of the wave parameters related to re-                 over-representation by 22.1 % and 13.6 %, with 47.7 % and
ported incidents show some large differences from the aver-                33.2 % occurring within this range, respectively (Fig. 5a, c).

Nat. Hazards Earth Syst. Sci., 19, 2183–2205, 2019                                  www.nat-hazards-earth-syst-sci.net/19/2183/2019/
B. Castelle et al.: Environmental controls on surf zone injuries on high-energy beaches                                                       2191

Figure 4. Environmental controls on shore-break-related SZIs: normalised frequency distributions, Fn, during the summers of 2007, 2009
and 2015 (light grey region), referred to as “average” background distribution, of (a) significant wave height, Hs; (b) mean wave period,
T 02; (c) wave direction, θ ; (d) water level, η; (e) daily tide range, TR; (f) daily mean air temperature, T ; (g) daily mean hourly insolation,
I ; and (h) daily mean wind speed, W . The dark grey bars show the difference between surfing-related and average background distributions
and vertical dashed lines show the background mean.

Figure 5. Environmental controls on rip-related SZIs: normalised frequency distributions, Fn, during the summers of 2007, 2009 and 2015
(light grey region), referred to as “average” background distribution, of (a) significant wave height, Hs; (b) mean wave period, T 02; (c) wave
direction, θ ; (d) water level, η; (e) daily tide range, TR; (f) daily mean air temperature, T ; (g) daily mean hourly insolation, I ; and (h) daily
mean wind speed, W , with the dark grey bars in all panels showing the difference between the surfing-related and the average background
distributions and the vertical dashed line showing the background mean.

www.nat-hazards-earth-syst-sci.net/19/2183/2019/                                    Nat. Hazards Earth Syst. Sci., 19, 2183–2205, 2019
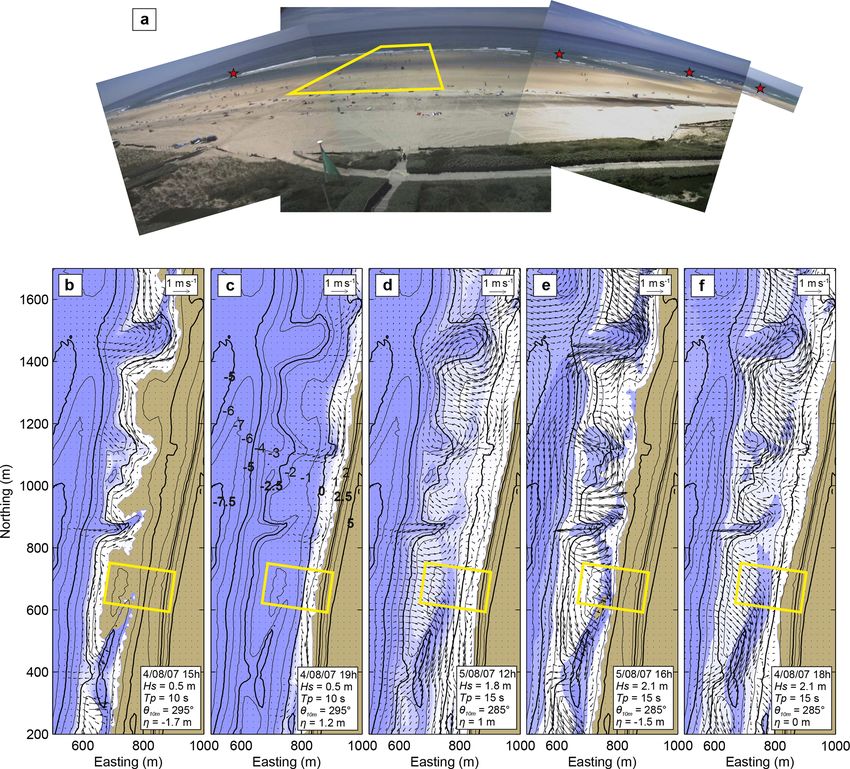
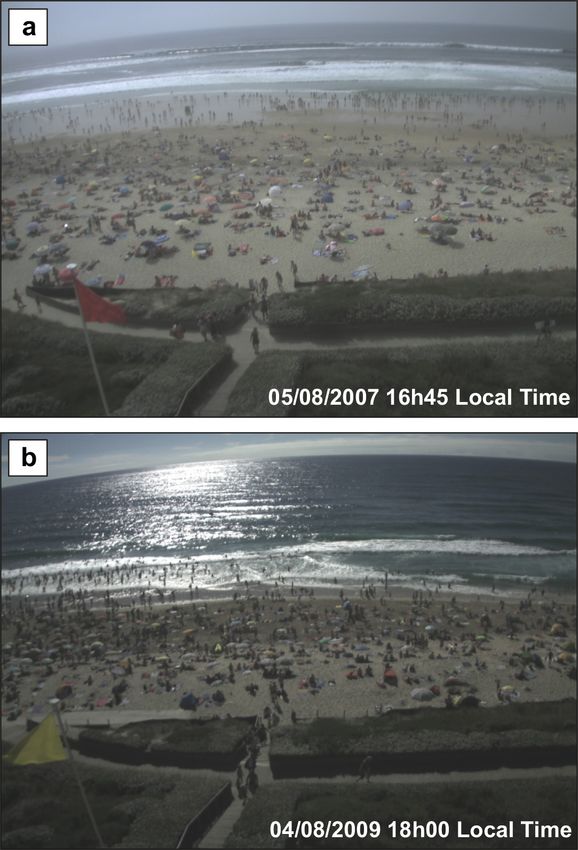
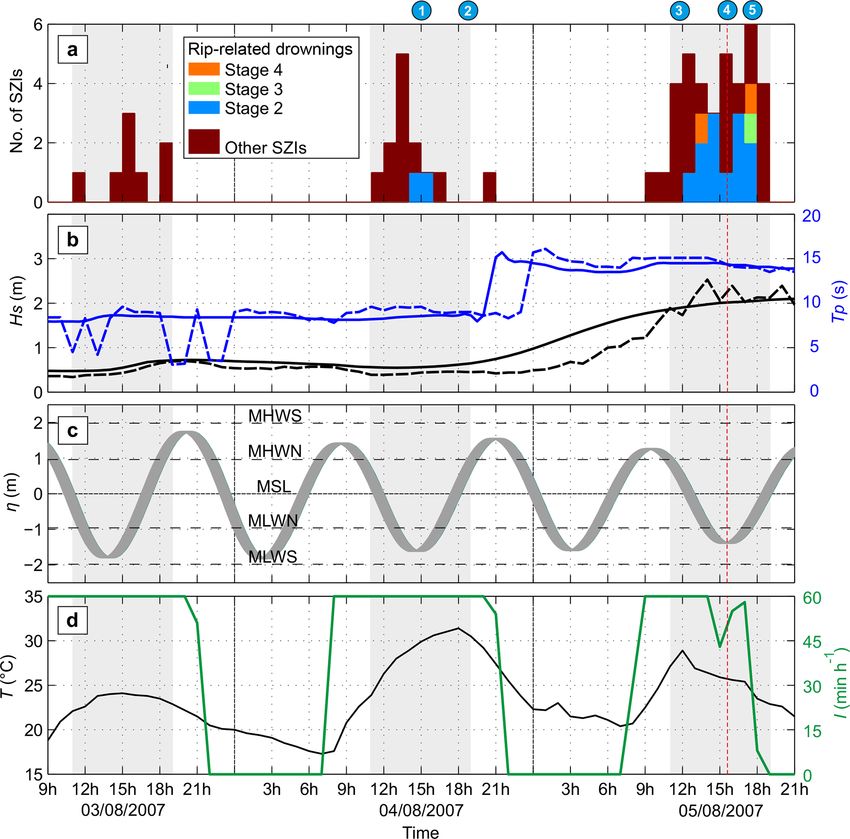
2192                              B. Castelle et al.: Environmental controls on surf zone injuries on high-energy beaches

Even more contrasting is the role of tide that shows complex
patterns. Low tide levels η < −0.75 m and, to a lesser extent,
extremely high tide levels η > 1.75 m are over-represented
by 16.1 % and 5.8 %, with 29.3 % and 2.7 % occurring within
this range, respectively (Fig. 5d). The daily tide range does
not show any clear pattern (Fig. 5e). This complex control of
tide on rip-related injuries is discussed in Sect. 5.

4.2    High life risk rip and shore-break days

As shown in Fig. 2, during the 2007 summer the number of
SZIs per day was highly variable, particularly rip- and shore-
break-related injuries, with some days having no incident re-
ported and others with a large number of SZIs (n = 13.6, σ =
11.9). Of the highest risk days, 15 July 2007 had the high-
est number of SZIs (60) with incidents reported across 17
coastal municipalities, which is the most widespread day in
the entire time series (daily average number of municipalities
reporting incidents m = 7.4, standard deviation σm = 4.2).
During that day 68.3 % (n = 43) and 13.3 % (n = 8) were
caused by shore-break waves and rips, respectively. The sec-
ond day with the largest number of SZIs (59 across 16 coastal
municipalities), 4 August 2009, was unusual because of very
high shore-break life risk 81.4 % (n = 48) SZIs caused by
shore-break waves. This corresponds to the day with the
largest number of shore-break-related injuries in the entire     Figure 6. Snapshots of Biscarrosse beach from a video station
dataset (n = 6.0). Shore-break-related SZIs were widespread      (Angnuureng et al., 2017) during the days with the largest num-
along the coast as reported across 14 coastal municipalities     ber of SZIs related to (a) rips on 5 August 2007 and (b) shore-break
(m = 3.9, σm = 3.6). Of note, no rip-related injury occurred     waves on 4 August 2009, with pictures taken approximately at the
on 4 August 2009. In contrast, 5 August 2007 was charac-         time of the most hazardous conditions (Figs. 7; 10). Note that in
terised by less reported SZIs (n = 37) but by very high rip      panel (a) the red flag is hoisted meaning that bathing was forbidden
life risk. On this day, 40.5 % (n = 15) of the reported inci-    all along the beach due to the presence of rips.
dents were drownings (maximum of the entire time series,
n = 1.2, σ = 2.1) across eight different coastal municipali-
ties (m = 1.0, σm = 1.5), including one stage three and two      beach attendance and beachgoer exposure to surf zone haz-
deadly stage four incidents. Only 18.9 % (n = 7) of the SZIs     ards and therefore a larger number of SZIs and higher life
on 5 August 2007 were caused by shore-break waves. While         risk. It was still reasonably warm (T = 25.9◦ ) and sunny
tide and wave conditions were very different for these two       (I = 44.9 min h−1 ) on 5 August 2007 and there was also high
high-risk days, both days were characterised by warm, sunny      beach attendance (Fig. 6a). In contrast, on 4–5 August 2007
weather with light wind, resulting in crowded beaches and        (the two previous days) the coast was exposed to a shore-
high beachgoer exposure to surf zone hazards (Fig. 6). The       normal high-energy groundswell (Hs ≈ 2 m, Tp ≈ 14 s) with
wave and tide controls during these 2 d are now addressed in     low tide levels occurring later in the afternoon. The tempo-
detail.                                                          ral distribution of rip-related drowning incidents is clearly
   Figure 7 shows time series of SZIs, wave and tide con-        modulated by tidal stage, as incidents were most numerous
ditions from 2 d prior to 5 August 2007 when the largest         between low tide and mid-tide, decreased at low tide, and
number of rip-related drownings in the entire dataset were       did not occur from mid-tide to high tide (Fig. 7a). Impor-
reported. On 3–4 August 2007, the coast was exposed to low-      tantly, the number of drownings caused by rips on 5 August
energy waves (Hs ≈ 0.5 m, Tp ≈ 10 s) with sunny weather          2007 could have been much larger, as the red flag prohibit-
(I = 60 min h−1 ). The daily number of reported SZIs of 8        ing bathing all along the beach was hoisted on many of the
and 13 on 3 and 4 August 2007, respectively, was rela-           beaches in the afternoon (Fig. 6a), due to the large number of
tively low or average compared to the mean (n = 13.6), with      rescues and mass rescue interventions. This can also explain
two stage two drowning incidents on 4 August. Given that         why rip-related SZIs on 5 August 2007 were reported across
the wave climate was similar for the 2 d, it is hypothesised     eight coastal municipalities. Rip-related SZIs were the most
that the increased air temperature on 4 August (T = 28.9◦ )      widespread on 25 July 2009 with 10 reporting coastal munic-
compared to 3 August (T = 23.4◦ ) contributed to greater         ipalities, under warm and sunny weather, shore-normal mod-

Nat. Hazards Earth Syst. Sci., 19, 2183–2205, 2019                       www.nat-hazards-earth-syst-sci.net/19/2183/2019/
B. Castelle et al.: Environmental controls on surf zone injuries on high-energy beaches                                                      2193

Figure 7. Time series on 3–5 August 2007, with 5 August having the largest number of rip-related drownings in the entire dataset, showing
(a) distribution of SZIs, with indicators of rip-related drowning and drowning stage coloured; (b) significant wave height, Hs, and peak
wave period, Tp, from the model (solid) and from the Candhis directional wave buoy in 50 m depth facing Truc Vert, which worked only
intermittently during the three summer seasons; (c) tide elevation, η; (d) hourly air temperature, T , and insolation, I . In all panels, the light
grey areas show the lifeguard-patrolled hours. In all panels the vertical dashed red line indicates low-tide occurrence on 5 August 2007. The
blue circles on top of panel (a) indicate the timing of the wave-driven current simulations shown in Fig. 8b–f.

erate energy waves (Hs ≈ 1.4 m, Tp ≈ 9 s), and spring low                   between mid-tide and high tide, there was no rip activity
tide occurring in mid-afternoon. However, on 25 July 2009                   observed along the entire beach and in turn no rip hazard
only 12 non-fatal drowning incidents (four stage one and                    posed to bathers, which is consistent with the absence of re-
eight stage two) were reported, corresponding to smaller rip                ported rip-related SZIs (Event 2). On 5 August 2007 simu-
life risk than on 5 August 2007 (no stage one, 12 stage two,                lations show that rips were active throughout the entire tide
1 stage three and 2 fatal drownings).                                       cycle for energetic shore-normal incident groundswell con-
   To further explore the influence of wave and tide con-                   ditions. Breaker and wave-driven current patterns at 12, 15
ditions on rip activity on 4–5 August 2007, Fig. 8 shows                    and 17 h are shown in Fig. 8d–f (Events 3–5). The time
modelled breaker and wave-driven current patterns (using                    slot with the largest number of reported rip-related drown-
the morphology surveyed in mid-June 2007 at Biscarrosse                     ings (two stage two, one stage three, two stage four) oc-
in Bruneau et al., 2009) at relevant times indicated by the                 curred between 17 and 18 h (Event 5, Fig. 8f), that is, be-
blue circles in Fig. 7. At low tide (15 h) on 4 August 2007,                tween low tide and mid-tide (η ≈ −0.9 m). Simulations show
when two moderate (stage two) drowning incidents were re-                   the presence of wide (over 200 m) breakers with high-energy
ported (Fig. 9a), low- to moderate-energy rips (0.3–0.4 m s−1               rips (0.8–1.2 m s−1 mean velocities) flushing the surf zone.
mean offshore velocities) were predicted by the model to                    These rips are associated with intense alongshore northerly
flow through a reasonably narrow surf zone (Event 1), cor-                  and southerly feeder currents, locally reaching 1.5 m s−1 and
responding to a moderate rip hazard. In contrast, 4 h later                 running close to the shoreline (Fig. 8f). These flow patterns

www.nat-hazards-earth-syst-sci.net/19/2183/2019/                                    Nat. Hazards Earth Syst. Sci., 19, 2183–2205, 2019
2194                                  B. Castelle et al.: Environmental controls on surf zone injuries on high-energy beaches

Figure 8. (a) Biscarrosse beach on 18 June 2007 with red stars showing rip channel locations. The bottom panels show wave-driven currents
(arrows) and breaking wave patterns (white areas) simulated at the same beach during the five times on 5 August 2007 indicated by the
blue circles in Fig. 9a for the following wave and tide conditions: (b) 6Hs = 0.5 m, Tp = 10 s, θ10 m = 295◦ , η = −1.7 m; (c) Hs = 0.5 m,
Tp = 10 s, θ10 m = 295◦ , η = 1.2 m; (d) Hs = 1.8 m, Tp = 15 s, θ10 m = 285◦ , η = 1 m; (e) Hs = 2.1 m, Tp = 15 s, θ10 m = 285◦ , η = −1.5 m;
(f) Hs = 2.1 m, Tp = 15 s, θ10 m = 285◦ , η = 0 m. In panels (b)–(f), the yellow box shows the preferred location of the swim-between-the-
flags area at Biscarrosse beach during most of the 2007 summer, and the topo-bathymetry is contoured in the background with contour
elevation indicated in panel (c) with respect to mean sea level.

therefore have a high potential to rapidly transport unsuspect-          ing incidents were reported the same day for higher water
ing bathers wading close to the shoreline into strong seaward-           levels (Fig. 8d, f).
flowing rips, which could take them 300 m offshore in less                  Our results indicate that the most hazardous rip conditions
than 5 min. Similar patterns are simulated earlier in the day            were caused by a high-energy shore-normal groundswell
for similar water levels but slightly milder wave conditions             (Hs ≈ 2 m, Tp ≈ 14 s), with low tide levels maximising haz-
(Event 3, Fig. 8d). Rips were the most intense (1–1.5 m s−1              ard in the afternoon, with risk also maximised due to high
mean velocities) at low tide (η = −1.5 m, Event 4, Fig. 8e).             beachgoer afternoon exposure owing to warm and sunny
However, feeder currents were, overall, less intense and/or              weather. Such wave conditions are, however, quite rare in
ran further offshore, which may explain why fewer drown-                 summer along the southwestern coast of France. The large-
                                                                         scale atmospheric patterns that resulted in these anomalous

Nat. Hazards Earth Syst. Sci., 19, 2183–2205, 2019                               www.nat-hazards-earth-syst-sci.net/19/2183/2019/
B. Castelle et al.: Environmental controls on surf zone injuries on high-energy beaches 2195
most 10 m offshore of Ireland (Fig. 9b), coming from the W
and with Tp exceeding 14 s (Fig. 9c).
The occurrence of high-energy groundswell events such
as those on 5 August 2007 is clearly linked with storm activ-
ity and trajectory during the hurricane season. The hurricane
season officially begins on 1 June and ends on 30 November
each year, with tropical storm and cyclone activity peaking
in September. August and July are characterised by weaker
tropical storm and cyclone activity. However, as shown by
the trajectories of all tropical cyclones between 2005 and
2017 (light grey) and the July–August periods (dark pink)
in Fig. 9a, there were quite a large number (12) of tropi-
cal cyclones that tracked northeastward across the North At-
lantic at > 40◦ N in July–August. These weather patterns
have the potential to generate high-energy waves towards
the beaches of southwestern France like those observed on
5 August 2007. It is worth noting that only two tropical cy-
clones tracking northeastward at > 40◦ N were observed dur-
ing the summers of 2007, 2009 and 2015, including Tropi-
cal Storm Chantal. The other one was the long-lasting (15–
26 August 2009) Hurricane Bill which drove above-average
wave height (0.8 m < Hs < 2 m) and period (9 s < Tp < 15 s)
near-shore-normal incident waves in southwestern France
between 20 and 28 August 2009. Although coinciding with
below-average air temperature and partly cloudy weather at
the end of the summer touristic season, likely resulting in de-
creased beachgoer numbers and hazard exposure, the period
was characterised by 15 drowning incidents including 2 fatal
incidents.
Figure 10 shows the time series of SZIs, wave and tide
conditions spanning the 2 d prior to 4 August 2009 when
the largest number of shore-break-related SZIs in the entire
dataset were reported. During the 3 d, incident wave condi-
Figure 9. Atmospheric conditions and resulting wave fields causing
tions varied slightly with 0.7 < Hs < 1.5 m, 7.5 < Tp < 10 s
the most hazardous rip conditions of the dataset along the south-
western French beaches on 5 August 2007: (a) trajectory, daily po- and 280◦ < θ < 300◦ with higher tide level occurring mid-
sition (large circles), and minimum central pressure of tropical cy- afternoon, and high tide occurring increasingly late in the
clone Chantal, superimposed onto all tropical cyclone trajectories day. The major difference between the 3 d is the warmer and
over the period 2007–2017 (light grey) and limited to the July– sunnier weather on 4 August 2009. This likely resulted in
August summer periods (dark prink) and only summers 2007, 2009 high beach attendance and beachgoer exposure which, co-
and 2015 (thick dark pink). (b) Significant wave height Hs and inciding with higher tide levels, resulted in a large number
(c) peak wave period field on 4 August 02:00 LT. of shore-break-related injuries. Given that wave conditions
were similar to modal summer wave conditions in southwest-
ern France, it suggests that maximised shore-break-related
risk occurs for moderate energy wave conditions, hot and
wave conditions are analysed in Fig. 9. Over a period of sunny days, and high tides that occur in late afternoon,
5 d prior to 5 August 2007 a tropical depression intensified when beach attendance is maximised. This is further em-
into Tropical Storm Chantal on 31 July, while located at ap- phasised in Fig. 11, which shows that days with milder tem-
proximately 35◦ N in the western Atlantic. The storm tracked perature (T < 22◦ ) or smaller (Hs < 0.6 m) or larger (Hs >
northeastward through an area of progressively colder wa- 2 m) waves systematically result in a reduced occurrence of
ter and cooler air and transitioned into an extratropical cy- shore-break-related SZIs. For intermediate wave conditions
clone on 1 August. It subsequently intensified to attain winds (0.6 m < Hs < 2 m), the number of shore-break-related SZIs
of near hurricane force, and on 3 August the cyclone un- increases with increasing daily maximum tidal elevation be-
derwent a slowly weakening trend in the far North Atlantic tween 15 and 19 h ηmax when beach attendance is maximised
Ocean. This storm track drove high-energy waves, funnelling during warm and sunny days. For such intermediate wave
towards the Atlantic coast of Europe with Hs peaking at al-
www.nat-hazards-earth-syst-sci.net/19/2183/2019/ Nat. Hazards Earth Syst. Sci., 19, 2183–2205, 20192196 B. Castelle et al.: Environmental controls on surf zone injuries on high-energy beaches
Figure 10. Time series on 2–4 August 2009, with 4 August having the largest number of shore-break-related injuries in the entire dataset,
showing (a) distribution SZIs with indication of shore-break-related injuries; (b) significant wave height, Hs, and peak wave period, Tp,
from the model (solid) and from the Candhis directional wave buoy in 50 m depth facing Truc Vert, which only worked intermittently during
the three summer seasons; (c) tide elevation, η; (d) hourly air temperature, T , and insolation, I . In all panels, the light grey areas show
lifeguard-patrolled hours. In all panels the vertical dashed red line indicates low-tide occurrence on 4 August 2009.
conditions, high-risk shore-break conditions are clearly ob- was working (Fig. 6). This camera covers a narrow stretch of
served for ηmax > 1.25 m and T > 22◦ (Fig. 11). beach facing the main entry of the coastal resort. This area
is rapidly filled on sunny days, with thousands of beachgoers
going further north or south along the beach to find some on
5 Discussion the dry beach. Accordingly, the number of people from this
single camera is not a good proxy for the overall beach atten-
Both shore-break- and rip-related SZIs involving bathers dance. Statistics on occupation from coastal cities or camp-
were found to occur disproportionately on warm sunny days sites is not a good beach attendance proxy, given that during
with low winds. Although no beachgoer exposure data were bad weather conditions tourists do not go to the beach. Fi-
available in this study, such environmental conditions are nally, it is important to note that beach attendance is not nec-
commonly found to contribute to increased beach atten- essarily a good proxy for exposure as, for instance, high surf
dance and beachgoer exposure to hazards (e.g. Ibarra, 2011; or cold water temperature can discourage beachgoers from
Balouin et al., 2014). It is possible to estimate beach atten- entering the water. This research has highlighted that in order
dance using video monitoring systems (e.g. Guillen et al., to definitely correlate SZI hazard to environmental param-
2008); however, it was not possible to apply such an ap- eters, exposure must be quantitatively known. Therefore, a
proach in this study. The Biscarrosse video station (Angnu- major outcome of this work is that lifeguards will now count
ureng et al., 2017), which is the only suitable video station people and will systematically provide this information in the
along this coast, has long periods with no image. In addition, new injury report forms.
during most of the summers studied here, only one camera
Nat. Hazards Earth Syst. Sci., 19, 2183–2205, 2019 www.nat-hazards-earth-syst-sci.net/19/2183/2019/B. Castelle et al.: Environmental controls on surf zone injuries on high-energy beaches 2197
which flow through the centre of beach cusps along the high-
est and steepest section of some beaches as wave uprush
diverges at the cusp horns driving concentrated backwash
streams (Masselink and Pattiaratchi, 1998). Tide also has a
strong control on shore-break-related SZIs, with more in-
juries occurring around higher water levels (Fig. 4d). This is a
logical consequence of shore-break waves being favoured by
steep beach slope, with the steepest sections of the beaches
of southwestern France being near spring high tide (Castelle
et al., 2017).
5.1 Impact of time of day and tidal range
The impact of the daily TR on SZIs is more complex (Figs. 4e
Figure 11. Daily maximum tidal elevation ηmax between 15 and and 5e), although more shore-break-related SZIs overall oc-
19 h versus daily mean air temperature averaged between 11 and cur for higher daily TR (Fig. 4e). This can be explained
19 h T , with significant wave height averaged between 11 and 19 h by the fact that higher tide ranges result in a longer dura-
coloured and circle size proportional to the daily number of shore- tion of high water level and sustained hazardous shore-break
break-related injuries. Squares show days when there was no shore- waves. In addition, Fig. 12a shows that for larger daily TR,
break-related injury. daily maximum tide elevation ηmax tends to occur during the
patrolled hours in the mid-to-late afternoon when beach at-
tendance (exposure) is maximised. This can further explain
More rip-related SZIs were found for periods with nor- why more shore-break incidents take place for a large tide
mally incident waves than for longer wave periods, which range. The same applies for the disproportionate number of
have long been known to promote the occurrence of channel rip-related SZIs for higher TR (Fig. 5e), which may be the
rips (e.g. Castelle et al., 2006). The high occurrence of rip- signature of spring high-tide swash rips. The other range of
related SZIs occurs during such conditions in southwestern TR showing a disproportionate number of rip-related SZIs is
France and are consistent with those reported along the west around mean neap tide range (MNTR; Fig. 5e). For low TR,
coasts of Devon and Cornwall in the southwest of the UK daily minimum tide elevation, which is when channel rip ac-
(Scott et al., 2014). However, given that breaker type and the tivity is maximised, tends to occur during the patrolled hours
onset of shore-break waves is not known to be affected by in the mid-to-late afternoon (Fig. 12b) when beach atten-
angle of wave incidence (Battjes, 1974), it is somewhat sur- dance (exposure) is maximised. This can explain why more
prising that more shore-break-related SZIs also occur with rip-related SZIs occur for TR close to MNTR. In summary,
near-shore-normal incident waves. An explanation is that (i) during larger tidal ranges, high tide occurs in the afternoon
more shore-normal wave incidence in summer in southwest- and is associated with more shore-break injuries and (ii) dur-
ern France is typically associated with longer-period waves ing smaller tidal ranges, low tide occurs in the afternoon and
(Castelle et al., 2016b). The longer-period waves result in is associated with more rip SZIs
higher wave energy flux and favour the presence of plunging
and collapsing waves for a given beach slope (Battjes, 1974). 5.2 Parameterised wave and tidal factors influence on
Many studies have highlighted the important tidal control SZIs
on channel rip activity with maximum rip flow speed often
observed at lower tide levels (e.g. Aagaard et al., 1997; Bran- Our results show that wave energy and tidal elevation are
der, 1999; Brander and Short, 2001; MacMahan et al., 2006). key environmental factors controlling both rip- and shore-
This is also the case on the meso–macro-tidal beaches of the break-related SZIs. Similar observations were made by Scott
southwestern coast of the UK (Austin et al., 2010; Scott et al., et al. (2014) for rip rescues along the southwestern coast
2011, 2014) and southwestern France (Castelle et al., 2006; of UK, who further developed two composite parameters
Bruneau et al., 2009, 2011), which helps explain why more to determine the mode of rip behaviour and resulting haz-
rip-related SZIs in this study occur around mean low water ard, namely the wave factor, Wf = H sT 02/H sT 02, and
(Fig. 5d). Of note, a disproportionate number of rip incidents the tide factor, Tf = LW − LW , where LW is the daily low
took place during spring high tide levels (Fig. 5d). A detailed water elevation and H sT 02 and LW are the long-term
inspection of open-text field comments in the correspond- summer averages. The average background distribution of
ing injury report forms indicates that approximately 25 % these two composite environmental parameters are com-
of these drowning incidents occurred because of small-scale pared against their distributions associated with both rip-
swash rips (Russell and McIntire, 1965; Dalrymple et al., and shore-break-related SZIs in Fig. 13. More rip-related
2011), referred to as courant de ressac by some lifeguards, SZIs took place on days when low water level was close to
www.nat-hazards-earth-syst-sci.net/19/2183/2019/ Nat. Hazards Earth Syst. Sci., 19, 2183–2205, 2019You can also read