Environmental Impacts of Shared Mobility Services in Metro Vancouver
←
→
Page content transcription
If your browser does not render page correctly, please read the page content below
Environmental Impacts of Shared Mobility Services in
Metro Vancouver
Prepared by: Elmira Berjisian, UBC Sustainability Scholar
Prepared for:
Camile dos Santos Machado, Project Manager, TransLink
Mirtha Gamiz, Planner, TransLink
Morgan Braglewicz, Senior Policy and Planning Analyst, Metro Vancouver
Erik Blair, Senior Policy and Planning Analyst, Metro Vancouver
 August, 2021
This report was produced as part of the UBC Sustainability Scholars Program, a partnership
between the University of British Columbia and various local governments and organisations in
support of providing graduate students with opportunities to do applied research on projects that
advance sustainability across the region.

This project was conducted under the mentorship of TransLink and Metro Vancouver staff. The
opinions and recommendations in this report and any errors are those of the author and do not
necessarily reflect the views of TransLink, Metro Vancouver, or the University of British Columbia.

Acknowledgments
The author would like to thank the following individuals for their contribution, feedback, and
support throughout this project:

Camile dos Santos Machado | Project Manager, New Mobility, Strategic Planning and Policy |
TransLink

Mirtha Gamiz | Planner, New Mobility, Strategic Planning and Policy | TransLink

Morgan Braglewicz | Senior Policy and Planning Analyst, Air Quality and Climate Change | Metro
Vancouver

Erik Blair | Senior Policy and Planning Analyst, Planning and Environment Department| Metro
Vancouver

Karen New | Director of Information Systems | Modo

Tai Silvey | Vice President | BCAA Evo

Mia Kohout | General Manager and Director |Mobi
Contents
Executive Summary _________________________________________________________________ 1
Introduction_______________________________________________________________________ 2
Background _______________________________________________________________________ 4
 Carsharing ______________________________________________________________________ 5
 Ridehailing ______________________________________________________________________ 6
 Bikesharing _____________________________________________________________________ 8
Methodology & Data ________________________________________________________________ 8
 Private car ______________________________________________________________________ 9
 Transit ________________________________________________________________________ 10
 Carsharing _____________________________________________________________________ 11
 Ridehailing _____________________________________________________________________ 12
 Bikesharing ____________________________________________________________________ 13
 Monte Carlo Simulation___________________________________________________________ 14
Results __________________________________________________________________________ 14
Findings & Recommendations ________________________________________________________ 27
References _______________________________________________________________________ 30
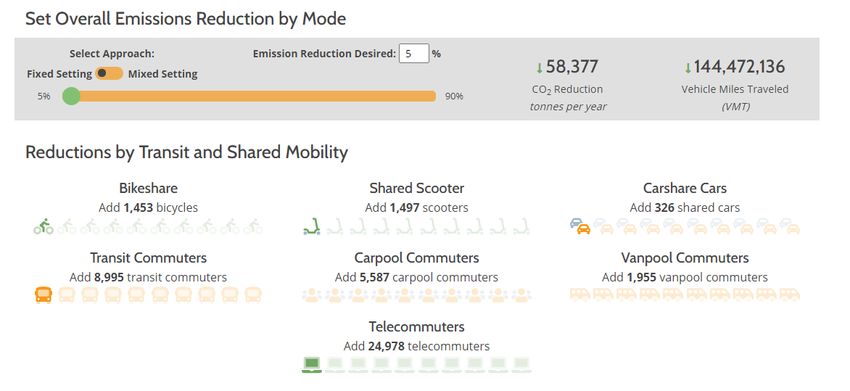
List of Figures
Figure 1 shared mobility services, from (8) _______________________________________________ 2
Figure 2 Shared mobility impacts, from (16) ______________________________________________ 4
Figure 3 distribution of topic and mode across the identified studies __________________________ 5
Figure 4 empty kilometers are the sum of driver commuting distances in the first and last leg of the
journey plus cruising for a ride and distance traveled to pick up a customer, from (48) _____________ 7
Figure 5 usage phase share of emissions from lifecycle emissions for ICEVs, from (41)based on the results
for Toronto________________________________________________________________________ 9
Figure 6 impact of occupancy on emission factors for carsharing system _______________________ 16
Figure 7 mode split for residents of Vancouver compared to one-way and round-trip users, from (42) 18
Figure 8 daily emission profile from transportation for carsharing consumers and Metro Vancouver
resident _________________________________________________________________________ 19
Figure 9 person-trip mode split from (50) _______________________________________________ 23
Figure 10 commute mode split for Washington (71) and Metro Vancouver (3), car includes car driver and
passenger for Metro Vancouver and drive alone, carpool, and vanpool for Washington. 10.2% of work trips
in Washington are “compressed work schedule day off and telework” ________________________ 23
Figure 11 Mobi system characteristics _________________________________________________ 25
Figure 12 equivalents for emissions from mode displacement across shared mobility modes _______ 27
Figure 13 set of shared mobility options to target a 5% reduction in GHG emissions ______________ 29
Executive Summary
Rapid technology advancement has facilitated the adoption of shared mobility services and
transformed the transportation landscape inarguably. Various shared mobility services are
operating in the Metro Vancouver region such as carsharing, ridehailing, and bikesharing. Metro
Vancouver residents, now more than ever, have access to a broader set of transportation options
that can influence their travel behavior. The adoption of shared mobility has the potential to reduce
greenhouse gas (GHG) emissions from the transportation sector. This study attempts to

 1. Develop a model to quantify the environmental impact of current and emerging shared
 travel modes within Metro Vancouver, in terms of GHG emissions.
 2. Determine the impact of shared mobility on mode choice and mode displacement through
 exploratory research.

The input data are acquired from local sources and in case of unavailability are synthesized from
the literature. Emission factors (in terms of GHG emissions per passenger-km traveled) are
developed for traditional transportation options (car and transit) along with shared mobility
services considering each service's unique characteristics. The mode displacement impacts are
translated into GHG emissions by calibrated emission factors. Results indicate that carsharing and
bikesharing consumers can reduce GHG emissions (in the range of 11-1255 kg CO2eq per user,
annually) through their mode displacement behavior. The current mode choice of carsharing users
reveals that one-way and round-trip users generate 55% and 64% fewer emissions, respectively,
compared to a typical Metro Vancouver resident (with mode choice behavior identical to the modal
breakdown of the region). To boost the GHG emission savings, carsharing systems can benefit from
cleaner fuels, a more efficient fleet, an optimal rebalancing system, and higher occupancy levels.
Our findings indicate that ridehailing can further contaminate the environment by generating
additional 99 kg CO2eq per user, annually (due to mode displacement impacts). Using Washington,
DC (due to its similar mode shares to Metro Vancouver), the potential future state of the region
under the influence of ridehailing is explored. If the ridehailing uptakes remain relatively low (about
3% of total trips), daily emissions are likely to increase by 1.4% compared to the current modal
breakdown of the region. However, further assessment is necessary as no empirical data were
available from ridehailing services for the Metro Vancouver context. Pooled services, zero-emission
fleets, and integration into transit networks are recommended to offset the unfavorable impacts
of ridehailing. The primary contributor to emissions in the ridehailing service is empty kilometers
(where no passenger is on board) which should be alleviated through appropriate policies. The
finding from this study can guide authorities to invest in shared mobility services proportional to

 1
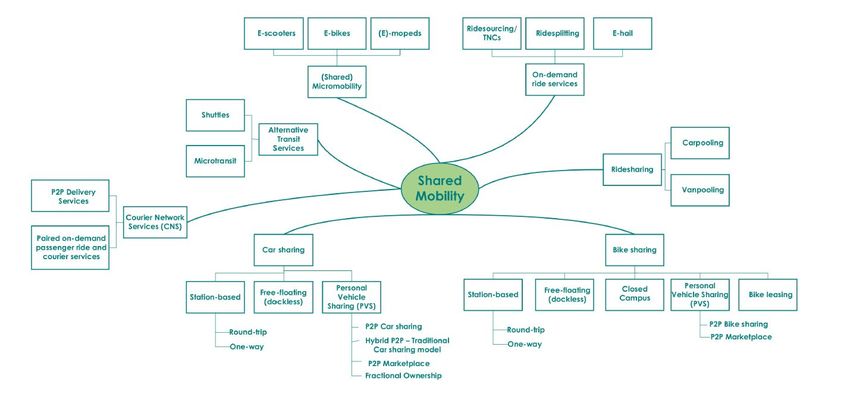
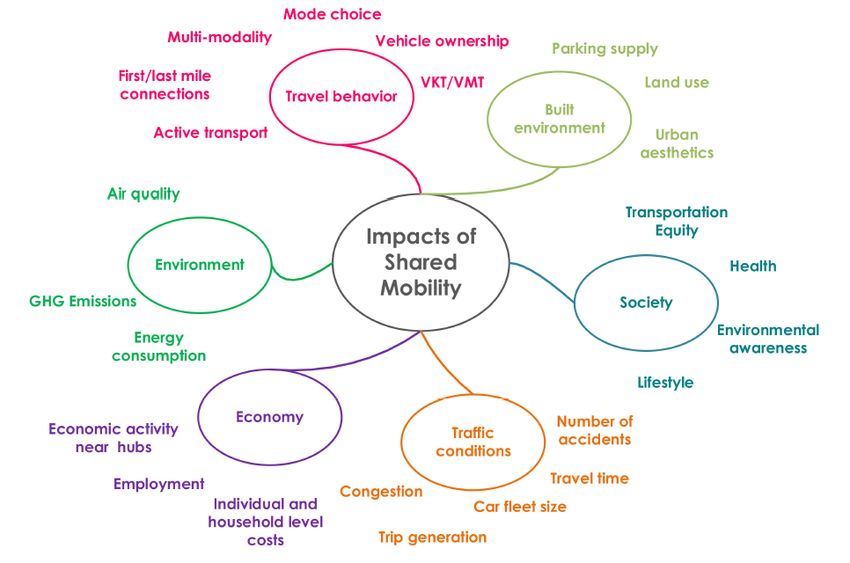
their potential of GHG emission reductions. However, the environmental impacts should not be
considered as the sole factor within the decision-making framework. Future research is needed to
shed light on other aspects of shared mobility with respect to travel behavior such as impacts on
equity, accessibility, mobility, congestion, etc.

Introduction
Metro Vancouver region has set ambitious goals to eliminate detrimental emissions. These goals
include a 45% reduction in emission by 2030 from 2010 values as the baseline and a carbon-neutral
region by 2050 (1). Passenger cars and light-duty trucks are the largest contributors to GHG
emissions in the region (30.9% by on-road mobile sources in 2015) (2). The dominant mode of
transportation in Metro Vancouver is private car (as driver or passenger) with 71.9% of total trips
undertaken in cars, followed by active travel (15.5% via walking and cycling), and transit (11.6%) in
2017 (3). In 2019, more than 318 million boardings were recorded on the bus system followed by
more than 165 million, 6.7 million, and 2.6 million boardings on Skytrain, SeaBus, and West Coast
Express (4).

Shared mobility services have the potential to alleviate environmental impacts of the
transportation sector (5). Shared mobility stems from the broader concept of shared economy
which prioritizes access to vehicles (bicycle, car, or other modes) over ownership (6, 7). Public
transit can be considered the most traditional form of shared mobility. Figure 1 displays various
forms of more recent shared mobility services.

 Figure 1 shared mobility services, from (8)

 2
This report focuses on more recent shared mobility modes (including carsharing, ridehailing, and
bikesharing) in addition to transit. For definitions of other forms of shared mobility, please refer to
(8). Carsharing users can rent a car without concerns for typical costs of ownership through
membership with an organization that provides vehicle fleet. Vehicle maintenance, fuel, and
parking costs are the responsibility of the organization while members pay a fee per usage (7).
Carsharing services can be free-floating or station-based. For free-floating service (one-way or
point-to-point), shared cars can be returned anywhere within a designated area. Evo is an example
of a free-floating carsharing service that was launched in the region in 2015 (9). Station-based
services can be either one-way or round-trip (or two-way), in latter customers are obliged to return
the vehicle to the origin station (7). Modo is an example of a round-trip station-based carsharing
service within Metro Vancouver, founded in 1997 (10). City of Vancouver is referred to as the
“carsharing capital” of North America for its 4.75 carsharing vehicles per 1000 residents (11, 12).

Ridehailing (also known as ridesourcing, transportation network companies, or on-demand ride
services) offers on-demand mobility service by connecting drivers of private vehicles to passengers
for a fee (13). Ridehailing came to Metro Vancouver in early 2020 with Uber, Lyft, and several
smaller companies (e.g., Kater) (14). Bikesharing systems offer on-demand access to bicycles for
one-way and two-way trips through dockless and station-based business models. Users of station-
based bikesharing systems must return bicycles to a station (typically any station, not necessarily
the one that users borrow the bikes from) while users of dockless systems have the flexibility to
leave the bicycle in a predesignated area (13). Mobi by Shaw Go is a one-way station-based system
that serves City of Vancouver with 2000 bicycles and over 200 stations (15).

Shared mobility services can influence travel behavior and consequently lead to various impacts
(e.g, on mode displacement and vehicle ownership) (8, 13) (Figure 2). The objectives of this report
are:

 1. Develop a model to quantify the environmental impact of current and emerging shared
 travel modes within Metro Vancouver, in terms of GHG emissions.
 2. Determine the impact of shared mobility on mode choice and mode displacement through
 exploratory research.

 3
3. Figure 2 Shared mobility impacts, from (8)

Background
This report utilized the "Google Scholar” search engine to identify publications (2010-2021) with
any of the following keywords: shared mobility, car sharing, ridehailing/ ridesourcing/
transportation network companies, bike/ bicycle sharing. Publications that used any of the listed
keywords in conjunction with the following words were also identified: GHG/greenhouse gas,
environment, impacts, and emissions. Furthermore, the ‘snowball search’ method was adopted to
expand the search to non-academic resources (policy briefs, white papers, reports, etc.). The
search identified over 250 resources through reading the abstracts/summaries and further
categorized them based on the topic, mode, method, and geographical scope. Caution should be
exercised as the search is not aimed to be exhaustive and is rather prioritized to target carsharing
and ridehailing studies. From this pool of resources, 23 studies were related directly to Metro
Vancouver. Figure 3 displays the distribution of mode and topic across the identified studies. This
research opted to use studies in North America and Europe due to intrinsic similarities between
their transportation system and Metro Vancouver’s.

 4
Figure 3 distribution of topic and mode across the identified studies

Carsharing
Evidence suggests carsharing can result in favorable environmental impacts due to reduced VKT
(vehicle kilometer traveled) and reduced vehicle ownership levels (sold vehicles or
forgone/delayed purchases) (16–29). Moreover, carsharing fleets have better fuel efficiency and
higher turnaround compared to private cars which can further amplify their positive impact (25,
30). On the other hand, carsharing attracts users who do not have access to a private car and the
new access can shift their travel from more sustainable modes of travel (i.e., transit and active
travel) to car travel. However, evidence suggests that the positive impact of people who sold their
vehicles and reduced their car travel exceeds the negative impact of those who displaced
sustainable modes of travel with carsharing (18, 22).

Reduced VKT by carsharing members after joining the organization is reported to be in the range
of 3% to 79.8% (16–18, 22, 26, 27, 30). Some of these effects also include the impact of
sold/forgone vehicles. Studies with comprehensive reviews of carsharing impacts reveal the
number of removed vehicles per carsharing vehicle for round-trip carsharing is 4.6-15.3 (30, 31)
and for one-way carsharing is 1-6 (31, 32). Specific to Metro Vancouver, round-trip carsharing
consumers reduced their ownership levels by 50% while one-way users dropped their vehicle
ownership levels by 10% (31). Another study in Metro Vancouver confirmed the trend and found
that every carsharing vehicle replaces up to 3 private cars and considering avoided purchase the
range extends to 5-11 (10).

Another prominent behavioral aspect is mode displacement patterns for carsharing users (i.e.,
what modes were/would have been used prior to/ in the absence of carsharing). There are a variety

 5
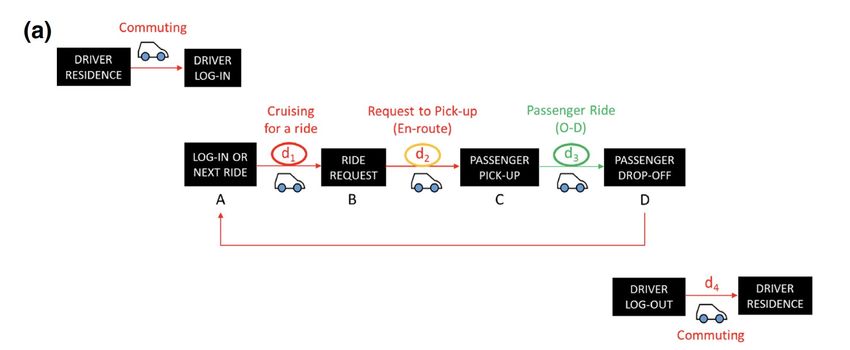
of methods to capture such impacts. While some studies capture the subjective usage of modes
before and upon joining carsharing (by asking survey respondents if they use certain modes “less
often” or “more frequently”) (16, 33), other studies ask respondents to report what mode they
would use in the absence of carsharing (20, 34, 35). Another informative lens is to ask about
displaced distance traveled by each mode in addition to displaced modes (22). Moreover, mode
displacement patterns should be distinguished for one-way and round-trip users. While one-way
users displace transit trips (34, 36, 37), round-trip carsharing seems to compete with private cars
(38). Travel purposes that carsharing services realize are different for each type of carsharing.
Round-trip carsharing services are primarily employed for shopping trips (35, 39) while one-way
services are mainly used for commuting (39). Additionally, round-trip carsharing typical travel
distances tend to be longer than one-way services (40) but with a lower weekly frequency (39, 41).

Ridehailing
Ridehailing is more novel than carsharing within the context of Metro Vancouver and consequently
less evidence exists to be able to draw conclusions about the impact of this mode on travel
behavior, locally. Evidence from ridehailing studies suggests that this service can generate new
travel demand that did not exist prior to the introduction of ridehailing (5%-22% of trips would not
be made in the absence of ridehailing, (42–48)). Car owners seem to displace their car travel with
ridehailing while non-owners displace transit trips (47). Regardless of methodological differences
in the studies that asked about mode displacement, a review study suggests around 30% of trips
would be made by private car in the absence of ridehailing (30). Recent trends show that
ridehailing seems to substitute trips that would have been made by car or taxi, otherwise (43).
Concern about environmental impacts of ridehailing stems from “deadheading”, or empty
kilometers that are traveled without a passenger. Because of deadheading, a ridehailing car can
generate more emissions than a private car, given an equal travel distance. Deadheading comprises
20-81% of the total ridehailing VKT (30, 40, 47, 49–51) and accounts for 32% of lifecycle emissions
from ridehailing services (40). The empty miles (Figure 4) can substantially exasperate the
environment as well as congestion.

 6
Figure 4 empty kilometers are the sum of driver commuting distances in the first and last leg of the journey plus cruising for a ride
and distance traveled to pick up a customer, from (47)

Conversely, ridehailing might lead users to shed vehicles or delay the purchase of new vehicles,
however, the evidence is not conclusive. In a study from Beijing, 48% of respondents reported that
their decision to sell an old vehicle or purchase a new one was influenced by the permanent
availability of ridehailing (52). Another study revealed that the majority of users did not change
their vehicle ownership and for the 9% who did sell their vehicle, the magnitude and direction of
VKT impact are unknown (48). A study conducted in Paris identified that only 4% of Uber users
shed their vehicle and listed Uber as one of the main reasons. They estimated that avoided VKT
due to shedding a car is 1.5-3% of daily VKT in private cars (53). In terms of the causal relationship
between reduction in ownership levels and ridehailing use, an intercept survey inferred changes
are irrelevant to ridehailing use (46). In line with revealed preferences, only 9% of users bought a
new vehicle after the suspension of a ridehailing service in Texas (54). Henao et al. took all these
impacts into consideration and concluded that ridehailing increases the overall VKT due to
deadheading and mode displacement despite 13% of respondents owning fewer vehicles upon
introduction of the service (47).

To offset detrimental environmental impacts, ridehailing can be used as a pooled service (as a
result increased passenger kilometers traveled (PKT)). Electrifying the fleet can also lower the
emissions while still providing a new mobility service (45). Another solution is the integration of
ridehailing services into the transit network so that access/egress trips become more convenient.
Currently, less than 1% of VKTs take place in electric vehicles (EVs) and only 15% of trips are pooled
(45). Moreover, a mere 5.5% of ridehailing trips are made in connection with other modes (47).
These solutions should be evaluated in a more comprehensive framework that accounts for other

 7
impacts of shared mobility. For instance, addressing environmental impacts of ridehailing with EVs
only resolves emissions in the usage phase while upstream emissions remain or congestion due to
induced travel cannot be alleviated by using EV fleet.

Bikesharing
Bikesharing bikes do not have tailpipe emissions but they need to be redistributed within the
network to meet the spatial travel demand (i.e., rebalancing process). Rebalancing is implemented
by light-duty trucks which engender emissions associated with bikesharing systems. Such
emissions constitute 36-43% of lifecycle GHG emissions in station-based bikesharing systems in
Toronto and the United States (40, 55). However, mode displacement impacts can, to some extent,
offset bikesharing GHG emissions. A study revealed that 35% and 45% of bikesharing trips
substituted transit trips for short-term and long-term members, respectively (30). Additionally,
bikesharing affects transit mode share. According to a two-year study, bikesharing users tend to
decrease their transit usage in larger cities while the reverse trend is observed in smaller cities.
The results imply that substitution and complementary roles of bikesharing with respect to transit
are contingent on the overall configuration of the transit network (56). Moreover, half of
bikesharing users reported reduced private car usage and vehicle ownership levels (5.5%
sold/delayed purchase) (56). The potential for bikesharing systems to reduce GHG emissions lies
in what modes users displace, with station-based systems having a greater potential to achieve
emission savings compared to dockless systems (55). The potential GHG saving per year is in the
range of 38-280 metric tons CO2 in the United States setting (in the review section of (57)).

Spatial context (characteristics of local transportation system), as well as temporal aspect (how
long has it been since shared mobility service was introduced to the city), can drastically influence
usage and mode displacement patterns for shared mobility consumers. Hence, the transferability
of findings from the literature review to the context of Metro Vancouver should be exercised with
caution. For instance, a recent study within Metro Vancouver revealed that more than 90% of
shared mobility users do not change their vehicle ownership and the majority of the sample (87%-
93%) is not likely to alter their mode choice due to the availability of ridehailing and carsharing
services (14).

Methodology & Data
This report draws its method from a recent study (40) and focuses on obtaining GHG emissions
(global warming potential) in the usage phase (i.e., tank-to-wheel emissions caused by fuel
consumption in motorized modes, excluding emissions from maintenance). Furthermore, to

 8
capture mode displacement and mode choice impacts in terms of GHG emissions, we extend our
study to include private cars and transit, as well. Figure 4 illustrates the share of GHG emissions
from the usage phase compared to lifecycle emissions. These shares constitute the majority of
lifecycle emissions for internal combustion engine vehicles (ICEV). EVs are excluded from this study
because they do not produce tailpipe emissions. However, the upstream emissions from EVs
constitute a larger portion of lifecycle emissions. The EVs’ upstream emissions are contingent on
the power grid system that generates electricity. The functional unit for this study is set to PKT. PKT
is considered a more appropriate functional unit compared to VKT as it can determine more
efficient modes of transportation in regard to occupancy (58, 59).

 83.2
 82
 USAGE PHASE SHARE FROM LIFECYCLE

 74.3

 54.4
 EMISSIONS

 CAR STATION-BASED FREE FLOATING RIDEHAILING
 CARSHARING CARSHARING

 Figure 5 usage phase share of emissions from lifecycle emissions for ICEVs, from (40)based on the results for Toronto

Emission factors for each mode j (ej) are obtained by Equation 1:
 −
 = Equation 1

Where GHGj-usage phase is the amount of GHG emissions generated by mode j and PKTj is passenger
kilometers traveled by mode j. PKT for each mode is the product of × .
Occupancy for private car and carsharing systems includes driver while for ridehailing (similar to
taxi), it excludes the driver (40).

Private car
GHG of usage phase for private cars is from fuel consumption which can be derived from Equation
2:

 9
 = × ×
Equation 2

Replacing Equation 2 in Equation 1 results in:
 ×
 = Equation 3

Fuel emission factors and consumption rates are obtained from (60) and are listed in Table 1. It is
worth noting that however the values in Table 1 are specific to British Columbia, they are average
values and not indicative of variation in passenger cars within Metro Vancouver with respect to
fuel efficiency.
Table 1 TTW emission factors and fuel consumption rates from (60)

 VEHICLE TYPE (FUEL) TTW EMISSION FACTOR FUEL CONSUMPTION RATE
 (KG CO2EQ/L) (L/100 KM)
 Passenger car (gasoline) 2.346 9.2
 Passenger car (hybrid) 2.346 7
 Light truck (gasoline) 2.379 12.3
Occupancy is set to 1.24 according to (61). Furthermore, to reflect the fleet breakdown in Metro
Vancouver a weighted average of private car emission factors based on car distribution in Metro
Vancouver is yielded. Private car distribution is inferred from ICBC vehicle registration data for the
lower mainland, 2020 1. The data are filtered to only reflect personal use. Furthermore, passenger
cars, as well as light-duty trucks (SUVs and minivans), are distinguished based on the “Body Style”
filter. The inferred shares are compared to Metro Vancouver’s projections for 2020 based on 2017
ICBC data and 2015 MOVES data to ensure accuracy.
Table 2 private car distribution in Metro Vancouver

 DATA SOURCE PASSENGER CAR PASSENGER CAR LIGHT-DUTY TRUCK
 (GASOLINE) (HYBRID) (GASOLINE)
 ICBC-2020 593,383 (48%) 21,674 (2%) 621,073 (50%)
 Metro Vancouver- 530,229 (38%) 2,155 (0%) 863,282 (62%)
 2020

Transit
The emission factors for various transit modes are elicited from (60) and listed in Table 3. Similarly,
to have a representative emission factor for transit, in general, we used the weighted average of
emission factors for each transit mode. Weights are assumed to be the number of annual boarding

1
 https://public.tableau.com/app/profile/icbc/viz/VehiclePopulationIntroPage/VehiclePopulationData

 10
times route length (extracted from (4)). The better approach is averaging by PKTs which are not
available to this study. To ensure representativeness of weights we compared our estimated
weights to 2009 PKTs (62).
Table 3 characteristics of the transit system

 VEHICLE CITY BUS SKYTRAIN SEABUS RAIL
 TYPE
 Emission
 0.002334 0.1547 0.1215
 factor (kg 0.1014
 CO2eq/PKT)
 # boarding *
 Route lengtha 4,143,520,989 7,816,880,000
 21,286,400 (0.18%) 176,800,000 (1.45%)
 (km),annaul (34.08%) (62.29%)
 2019
 2009 PKTb, 4,728,000 7,330,000
 - -
 daily (39.21%) (60.79%)
a. for bus system (216 routes), source (4) does not have route length and instead has average one-way trip distance.
To obtain route length, GFTS data are used (available from https://developer.translink.ca/ServicesGtfs/GtfsData).
Data should be filtered to exclude road_type: rail, Ferry, Subway. Metro and further cleaned to only include average
length for different directions (so only 216 rows of data). For routes 32, 43, 44, 95, 96, 125, 143, 239, 242, 258, 480,
GFTS files of August 06 and July 23, 2021 do not have any entry, so we used the average trip distance for these
routes, instead ( from
https://translink.maps.arcgis.com/apps/MapSeries/index.html?appid=482ed47ba3bd47c3a24262c7c5810275).

Carsharing
VKT of carsharing should also reflect the rebalancing that is implemented by the operator to
optimize the system. VKT for carsharing is denoted by Equation 4 (40):
 × ×
 =
 −

 Equation 4

Thus, the emission factor of carsharing based on Equation 1 is yielded by Equation 5:
 ×
 =
 Equation 5
 ×( − )

Evo and Modo provided their fleet characteristics data (as of June 2021) which are used in the
above equations to obtain emission factors for one-way and round-trip carsharing in Metro
Vancouver. While Evo’s fleet features only one type of vehicle (Toyota Prius Hybrid), Modo has
more diversity. Hence, emission factors corresponding to each vehicle type are calculated for Modo
fleet and averaged by fleet size to represent a typical round-trip carsharing trip (in the weighted
average, EVs and hydrogen fuel cell vehicles with zero tailpipe emissions (ZEVs) are taken into

 11
account). Neither operator has data on occupancy levels 2 so the occupancy levels are set equal to
private cars. Moreover, Evo reported the share of rebalancing to total lifetime mileage of carsharing
vehicles as 1.6%. Modo has a negligible rebalancing due to the round-trip design of the system and
thus rebalancing percentage is considered zero. Table 4 summarizes the necessary input to
calibrate emission factors for one-way and round-trip carsharing systems.
Table 4 characteristics of one-way (Evo) and round-trip (Modo) carsharing (as of June 2021)

 OPERATOR VEHICLE TTW FUEL FLEET SHARE REBALANCING %
 TYPE EMISSION CONSUMPTION
 (FUEL) FACTOR RATE
 (KG (L/100 KM)B
 CO2EQ/L)A
 Evo Passenger 2.346 5.91 100% 1.6%
 car (hybrid)
 Passenger 2.346 7.66 59.42%
 car
 (gasoline)
 Passenger 2.346 5.16 26.73%
 car (hybrid)
 Modo 0%
 Light truck 2.379 11.63 10.47%
 (gasoline)
 All above 2.350d 7.40d 96.62%
 Passenger - - 3.38%
 car (ZEV)c
a. from (60)
b. weighted average based on operator data
c. ZEVs consisted of battery electric vehicles and hydrogen fuel cells
d. weighted average

Ridehailing
Empty kilometers are considered in ridehailing emission factors through increased VKT (Equation
6) (40).
 × ×
 =
 Equation 6
 −
 +

Replacing Equation 6 into Equation 1 yields emission factor for ridehailing ( Equation 7)
 ×
 =
 Equation 7
 ×( − )
 +

2 Evo’s market search indicated that 10-15% of trips have more than one person in the car

 12
As local data are not available at the time of this study, the necessary input is synthesized from
literature (Table 5) and the average emission factor for ridehailing is estimated.
Table 5 characteristics of ridehailing

 VEHICLE TTW EMISSION FUEL OCCUPANCYB DEADHEADINGC %
 TYPE FACTOR CONSUMPTION
 (FUEL) (KG CO2EQ/L)A RATE
 (L/100 KM)A
 Passenger car 2.346 9.2 1.24 42%
 (gasoline)
a. from (60)
b. equal to private car from (61)
c. from (47)

Bikesharing
Occupancy of a bicycle is usually fixed and equal to one (the rider), so PKT and VKT are equal.
Although bicycles do not generate emissions, rebalancing in the usage phase leads to emissions.
Thus, the emission factor for bikesharing system is obtained by Equation 8 (40):

 = × ×
 Equation 8

To account for seasonal patterns of bicycling, we opted to use a monthly average of rebalancing
for the year 2020 (consistent with other modes temporal scope) from data provided by Mobi.
Rebalancing VKT for every 1 PKT bike trip is calculated by Equation 9:

 − = ∑
 = Equation 9

Necessary input to obtain the emission factor for bikesharing system (Mobi) is listed in Table 6.
Table 6 characteristics of bikesharing (Mobi)

 OPERATOR VEHICLE TTW EMISSION FUEL REBALANCING FOR
 TYPE (FUEL) FACTOR CONSUMPTION EVERY 1 KM BIKE TRIPD
 (KG CO2EQ/L)A RATE
 (L/100 KM)B,C
 Mobi Light truck 2.379 12.1 0.0362 km
 (gasoline)
a. from (60)
b. weighted average by km driven by each light-duty truck based on operator data, year-around (Metris cargo van
and Sprinter cargo van), this number for 2017 is 12.0

 13
c. fuel efficiency for Metris cargo van is derived from https://www.nrcan.gc.ca/energy-efficiency/transportation-
alternative-fuels/fuel-consumption-guide/21002, as EPA 3 does not provide the same information for Sprinter, the
fuel efficiency is obtained from https://www.fuelly.com/car/mercedes-benz/sprinter_2500
d. for comparison, rebalancing km per each 1 km bike trip for 2017 is 0.0722

Monte Carlo Simulation
To assess uncertainty, Monte Carlo simulation is employed. Distributions rather than a central value
are more insightful as a range addresses the uncertainty within the input data and captures how
varying input variables and their interaction can affect emission factors. To draw the range of input
data, local data and studies from the literature review are used. Table 7 lists the assumed
distribution for each variable and the sources used for informing the distribution across shared
mobility modes.

Results
This section explicates the results of the method described above and applied on a set of
transportation modes (including private car, transit, carsharing, ridehailing, and bikesharing).
Calibrated emission factors are reported and the environmental impacts of users’ mode choice
along with mode displacement behavior are discussed. Caution should be exercised with regards
to assumptions and studies used to capture travel behavior impacts of shared mobility services.
While some assumptions and inputs reflect the local context, others are elicited from the literature.
Limitations of the method and assumptions are explained for each shared mobility service. An
exhaustive survey is recommended to validate the magnitude and direction of the environmental
impacts obtained in this report. Table 7 lists emission factors associated with various types of
passenger cars.
Table 7 estimated emission factors for private car

 VEHICLE GCO2EQ
 ESTIMATED EMISSION FACTOR ( )
 PKT

 passenger car (gasoline) 174.06

 passenger car (hybrid) 132.44

 light-duty truck (gasoline) 235.98

3
 EPA (US Environmental Protection Agency) does not determine fuel efficiency for commercial vehicles with a gross-vehicle-
weight rating of more than 8500 pounds (https://www.caranddriver.com/features/g20111998/worst-mpg-highway-tested/)

 14
Following the discussed methodology, weighted emission factors for private car and transit are
 gCO2eq
204.44 and 38.09 PKT
 , these numbers are used to capture the mode displacement impacts of
shared mobility modes.

Carsharing fuel emission factors are reported in Table 8 along with distributions yielded by Monte
Carlo simulation. Increasing occupancy levels from 1.24 to 4 (which results in increased PKT) can
decrease emissions by 69% for both one-way and round-trip carsharing systems (Figure 5). Thus,
in addition to encouraging the acquisition of a more efficient fleet by carsharing operators, one of
the solutions to enhance the environmental impacts of carsharing is devising incentives for pooled
rides. Furthermore, it is suggested that carsharing organizations collect and provide occupancy
data so that the estimates become more robust.
Table 8 estimated emission factors for carsharing system (one-way: Evo and round-trip:Modo)

 OPERATOR- ESTIMATED SIMULATION RESULTS
 ATTRIBUTES EMISSION Average Standard Coefficient of 25th 75th
 FACTOR deviation variation % ( percentile percentile
 GCO2EQ
 ( ) (SD)
 PKT
 Evo-passenger 113.63 80.53 10.92 13.56 72.85 86.73
 car (hybrid)

 Modo-passenger 144.92 92.98 13.52 14.55 83.49 100.73
 car (gasoline)

 Modo-passenger 97.62 68.02 10.40 15.28 60.73 74.00
 car (hybrid)

 Modo- light-duty 223.13 134.31 18.41 13.71 121.37 144.61
 truck (gasoline)

 Modo-all above 140.24 99.74 20.60 20.66 85.45 112.21

 15
Figure 6 impact of occupancy on emission factors for carsharing system

To reflect ZEVs within the Modo fleet, the weighted average emission factors based on the
number of cars are estimated for Modo (Table 9).
Table 9 Modo overall emission factor

 OPERATOR- FLEET ESTIMATED EMISSION FACTOR ESTIMATED EMISSION FACTOR
 ATTRIBUTES SIZE GCO2EQ (OVERAL)
 ( )
 PKT
 Modo fleet (without 600 140.24
 ZEVs) 135.50
 Modo fleet-ZEVs 21 0
To capture the environmental impacts of carsharing travel behavior, usage data are necessary. Such
data are not available to this study and therefore, usage (in terms of weekly frequency) and average
trip distance (km) are inferred from carsharing studies. It is important to distinguish between one-
way and round-trip carsharing travel behavior as they are utilized for different purposes and with
different frequency levels. Average weekly frequency for one-way system is 2.75 (from (37, 40) and
approximate numbers from (41)) with average trip distance of 5.67 4 km (from (16, 20, 22, 36, 38,
40, 63, 64)). For a round-trip system, the frequency is 1.33 (from (39) and approximate numbers

4
 For study (63)travel times are reported, speed of 50 km/hr is assumed to convert the numbers to km, (22) and (16)
(in addition to average trip length) reported the annual VKT which is converted by weekly trip frequency (i.e., 2.75)
and number of weeks within a year (i.e., 52) to travel distance

 16
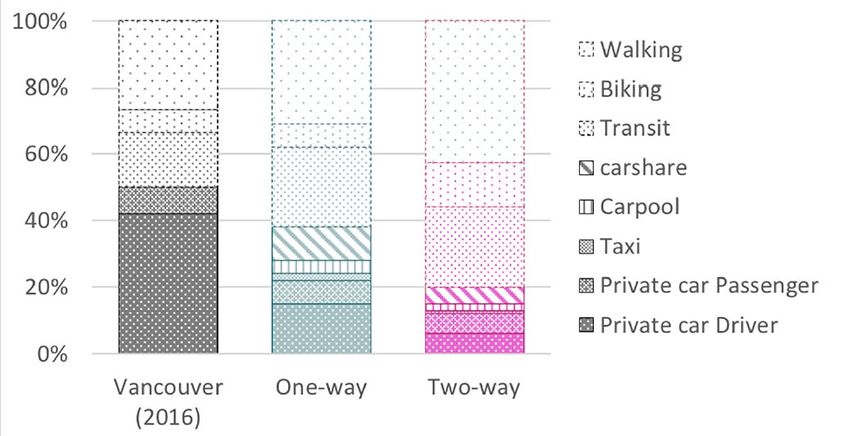
from (41)) and the average travel distance is 19.42 5 km (from (18, 22, 40)). Although these numbers
are drawn from North American and European contexts, they should be applied with caution to
Metro Vancouver as the specificity of the carsharing system and urban structure (for example,
population density) impacts travel distances and frequencies (see for instance, (16) for a range of
travel distances for cities with different population densities). Operator data can reduce
uncertainty immensely, however such data are not available to this study. Using annual VKT in
carsharing vehicles and emission factors, annual emissions generated by a carsharing user are
estimated (Table 10).
Table 10 annual GHG emissions generated by a user from carsharing

 CARSHARING ESTIMATED EMISSION FACTOR ANNUAL ESTIMATED EMISSION (KG
 GCO2EQ VKTA CO2EQ)
 ( )
 PKT
 One way 113.63 811 92.15
 Two way 135.50 1343 181.98
a. weekly frequency * average trip distance* 52

A local study provides insight into mode choices of one-way and round-trip carsharing users (41).
We used Figure 6 from their study to approximately derive the shares for modes used by carsharing
users (Table 10) and compare their mode choice behavior to the generic modal breakdown of the
region from 2017 travel diary (3) (we assume the modal breakdown is representative of typical
travel behavior of a Metro Vancouver resident). Hence, a daily emission profile is developed for
each group (one-way user, round-trip user, and typical resident). With regards to “other” modes
(carpool and taxi), as the travel diary does not report such figures we redistributed the shares
equally across other modes. For travel distances, the estimates above are used for carsharing
systems while for other modes we used average trip distance in the 2017 travel diary (3). We should
acknowledge that the assumption of the identical travel distances by transportation modes across
three groups might not be realistic. Another assumption is setting the number of trips equal across
three groups to 3.2 (based on the total number of trips 7,906,302 from (3) divided by Metro
Vancouver population of 2,463,000, i.e, the daily number of trips per capita). We assume the mode
shares listed in Table 11 reflect the distribution of daily trips made by each group. Moreover, users
that participated in the 2017 travel diary possibly included their carsharing trips into car travel.
Within the city of Vancouver for the year 2017, 31% of residents aged +18 with a driving license

5
 Similarly, for (18, 22)the annual VKT is reported which is converted to average trip distance by weekly trip
frequency (i.e., 1.33) and number of weeks within a year (i.e., 52).

 17
subscribed to a carsharing system (65), so the assumption that trip diary mode shares reflect non-
user group is limiting in itself.

 Figure 7 mode split for residents of Vancouver compared to one-way and round-trip users, from (41)

Table 11 displays that a one-way and round-trip user approximately generate 55% and 64% less
emissions due to their mode choice behavior compared to a typical resident (with mode choice
identical to the modal breakdown of the region). Figure 7 displays each mode's share of emissions
across three groups. Carsharing users use transit more often which results in more transit
emissions while their use of private cars is significantly lower. Carsharing users have lower PKTs in
cars compared to a typical resident. Lower PKTs coupled with more efficient vehicles (compare
 gCO2eq gCO2eq
113.63 PKT
 (emission factor of one-way) and 135.50 PKT
 (emission factor of round-trip) to
 gCO2eq
204.44 PKT
 (emission factor of a private car)) leads to overall lower emissions generated by
carsharing users compared to residents. Within carsharing users, round-trip members make fewer
carsharing trips however with longer distances compared to one-way members. This coupled with
greater emission factors for round-trip systems leads to higher emissions due to carsharing for
round-trip users. However, the overall private car and carsharing emissions for both user groups
are comparable since round-trip users tend to use a private car less often than one-way users.

 18
Table 11 mode choice and daily emissions by one-way and round-trip carsharing members along with Metro Vancouver resident

 MODE ONE-WAY USER ROUND-TRIP METRO AVERAGE EMISSION
 MODE SHAREA USER MODE VANCOUVER TRIP FACTOR
 SHAREA RESIDENT LENGTH GCO2EQ
 ( )
 PKT
 MODE SHAREB (KM)
 Car 22%+1.5%(from 12%+1% (from
 72% 9.67 204.44
 other)=23.5% other)=13%
 carsharing One-
 One-way=5.67
 way=113.63,
 11%+1.5%=12.5% 5%+1%=6% - and round-
 round-
 trip=19.42
 trip=135.50
 Transit 24%+1.5%=25.5% 23%+1%=24% 12% 13.40 38.09
 Walking
 and 37%+1.5%=38.5% 56%+1%=57% 16% 1.17 0
 bicycling
 Other 6% 4% - - -
 Daily
 emissions 2.16 1.72 4.75
 (kg CO2eq)
a. approximately from Figure 6
b. car travel is sum of passenger and driver, walking and bicycling are also aggregated, trip length is based on
weighted average for these modes

 Emissions kgCO2eq
 5.00
 4.50 0.20

 4.00
 3.50
 3.00
 2.50
 4.55
 2.00 0.42
 1.50 0.26 0.39
 1.00 0.51
 1.49
 0.50 0.82
 0.00
 oneway consumer twoway consumer Metro Vancouver resident

 car carsharing transit

 Figure 8 daily emission profile from transportation for carsharing consumers and Metro Vancouver resident

 19
Table 12 distribution for input variables informed by operator data and literature review

 MODE OPERATOR- INPUT DISTRIBUTION NOTE
 ATTRIBUTES VARIABLE
 One-way Evo-hybrid Fuel consumption Normal distribution Is considered equal to private car in (22, 23, 26, 29, 40, 59) and more efficient (on
 carsharing passenger car rate (average=6.45 SD=0.18 average 25%) in (16, 25, 27, 66) as well as operator data, private car from (60),
 range=[5.91-7]) operator data=5.91
 occupancy Normal distribution (average=2 Is considered equal to private car in (25, 26, 28) and more in (19, 29, 40, 59, 67) (on
 SD=0.25 range=[1.24-2.75]) average 1.98 times more)
 rebalancing Normal distribution 3.4%, 7.5%, 2.5-12.5% in (16, 40), operator data=1.6%
 (average=4.55% SD=0.98%
 range=[1.6%-7.5%
 Round-trip Modo- gasoline Fuel consumption Normal distribution (average=7.8 Is considered equal to private car in (22, 23, 26, 29, 40, 59) and more efficient in (16,
 carsharing passenger car rate SD=0.47range=[6.4-9.2]) 25, 27, 66) as well as operator data, private car from (60) for gasoline 9.2, for hybrid
 Modo- hybrid Fuel consumption Normal distribution (average=5.7 7, and for light duty truck=12.3, operator data most efficient car=6.4 for gasoline, 4.4
 passenger car rate SD=0.43range=[4.4-7]) for hybrid, and 9.9 for mini van/cargo
 Modo- Fuel consumption Normal distribution
 cargo/minivan rate (average=11.1 SD=0.4range=[9.9-
 12.3])
 Modo-all fleet Fuel consumption Normal distribution
 (except ZEV) rate (average=8.35
 SD=1.32range=[4.4-12.3])
 Modo-all fleet occupancy Normal distribution (average=2 Is considered equal to private car in (25, 26, 28) and more in (19, 29, 40, 59, 67) (on
 SD=0.25 range=[1.24-2.75]) average 1.98 times more)
 Ridehailing Fuel consumption Normal distribution (average=8.6 Compared to private car, 3.2 miles per gallon more efficient from (50),17% better
 rate SD=0.23 range=[7.9-9.2]) efficiency in (45), equal in (40, 64)
 occupancy Normal distribution 1.31 and 1.4 from (47), 30% of rides are shared between two people (50), 1.8 in (46),
 (average=1.37 SD=0.04 pooled service 1.5 and non-pooled equal to car and 1 (45), 1.66 in (30),1.56 in (44),
 range=[1.24-1.5]) 1.41 in (40)
 Deadheading % Triangular distribution 42% in (47) and literature review within (47): 56-81%,61%,46-67%, 45% in (50), 33-
 (average=45%, minimum=25%, 45% with average of 41%n (40), 33-47% and assumed 41.8% in (45), 42.5% in (49)
 maximum 65%) and 20% in literature review of (30)
 Bikesharing Mobi Fuel consumption Normal distribution Lower bound from most efficient car in operator data and upper bound for light-duty
 rate (average=11.25 SD=0.35 truck in (60)
 range=[10.2-12.3])
 Rebalancing km per Normal distribution For Toronto, 0.0275-0.0525 in (40), monthly range of operator data in 2017 and
 1 PKT bike trip (average=0.0766 SD=0.0203 2020:0.0158-0.1374
 range=[0.0158-0.1374])

 20
To capture the impacts of mode displacement for one-way carsharing user, the method from (26)
is replicated. The study uses results from another one-way carsharing study (16) to derive impacts
of mode displacement (also known as “rebound effects”) for Calgary in conjunction with three
other cities. Similarly, we used results from (16) for Vancouver to infer the current VKT and VKT
before the introduction of one-way carsharing. The advantage of this method is that it accounts
for reduced VKT (as well as reduced vehicle ownership levels) for carsharing members.
Furthermore, the method assumes a constant travel demand for both periods of “before” and
“after” carsharing (thus, it ignores the possible induced travel impact) and uses the modal
breakdown of Calgary to estimate the annual traveled distance in other modes. Due to lack of data,
we used modal breakdown of Metro Vancouver assuming a 1:1 mode -distance relationship (i.e.,
if 72% of trips are made by car so 72% of total travel distances are made in car). Replication of the
method for Metro Vancouver along with emission factors from above, the impact of mode
displacement in terms of emissions is captured (Table 13). Unfortunately, same information (VKT
for car travel before and after joining carsharing) is not available for round-trip system, locally.
However, we consider annual VKT of private car in Canada (equal to 14,520 km from (40)) to
represent the “before” period for round-trip users and use the observed average reduced VKT of
43% from a round-trip study (18) that included Vancouver as a case study along with other North
American cities. Other key data are annual VKTs in round-trip carsharing vehicles. The weekly
frequency of 1.33 and the average trip distance of 19.42 km are used to arrive at the annual
estimated VKT (estimated from literature and discussed above). For the rest of the modes, we
followed the same method from (26) as the one-way carsharing.
Table 13 impact of mode displacement for carsharing system accounting for reduced VKT

 MODE ONE-WAY ROUND-TRIP EMISSION FACTOR
 CARSHARING CARSHARING GCO2EQ
 ( )
 PKT
 before after before after
 Car 10638 9648 14,520 6993 204.44
 Carsharing - 229 - 1343 One-way=113.63, round-
 trip=135.50
 Transit 1773 2099 2420 5096 38.09
 Walking and Bicycling 2364 2799 3227 6794 0
 Total 14775 km 20167 km -

 Annual emissions (kg 2242.37 2078.41 3060.65 1805.73
 CO2eq)
According to Table 13, a one-way carsharing user can achieve 163.96 kg CO2eq saving in emissions
while the number for round-trip users is 1254.92 kgCO2eq. Although assumptions underlying the

 21
above estimates warn us to interpret these numbers with caution, the same story is confirmed in
Figure 7. Round-trip users can achieve higher savings in emissions due to their travel behavior (i.e.,
the trips that they displace by carsharing and their current mode choice).

The disadvantage of the above method is not accounting for specific displacement impacts across
non-car modes (i.e., transit and active travel). The above method assumes the demand stays
constant in both periods and therefore ignores the impact of induced travel. After estimating VKT
in carsharing and private vehicles, the rest of the demand is redistributed between transit, walking,
and cycling proportional to the region mode split. However, it should be noted that the mode
choice for carsharing users (in terms of transit and walking/cycling shares of their travel demand)
is different from the generic modal split of the region (Figure 6). The shortcoming of the mode
displacement method can be resolved by measuring all aspects of changes in travel behavior upon
joining carsharing (i.e., reduced vehicle ownership levels, induced travel, reduced VKT in private
cars, as well as km-displaced (as opposed to trip displaced) across non-car modes of
transportation). Moreover, the dynamic nature of such studies should not be neglected. The
evolution of service can impact the magnitude and direction of changes in travel behavior (17).

Table 14 details the estimated emission factor for ridehailing along with simulation results to give
the range of possible emission factors based on variation in input variables. Annual emissions by a
ridehailing user can be estimated by inferring key values for ridehailing travel behavior (trip
frequency and travel distance) from the literature. The average ridehailing trip distance (the
segment with a passenger onboard) is 6.85 km (average from (30, 40, 44–47, 50, 56, 64)) and users
tend to use the service up to 7.22 times a month (approximate average from (43, 44, 68, 69)).
Therefore, the estimated annual emissions for a ridehailing user is 178.26 kg CO2eq.
Table 14 ridehailing emission factors

 ESTIMATED SIMULATION RESULTS
 EMISSION Average SD CV % 25th percentile 75th percentile
 GCO2EQ
 FACTOR ( )
 PKT
 300.10 274.15 44.22 16.13 241.15 300.83
As ridehailing is still new to the region, the impacts are less known. However, using the National
Household Travel Survey of the United States, Fehr & Peers elicited mode splits for six American
regions (Figure 9) (49). Using Figure 9, we can have an estimate of how the future of Metro
Vancouver would be shaped by ridehailing. Washington, DC mode split profile is used as a
comparison basis as it has a similar mode split to Metro Vancouver (see commute mode split
comparison in Figure 10). Similar to carsharing, same assumptions are used in Table 15 for the daily

 22
number of trips as well as travel distances. Thus, if the ridehailing uptake follows the mode split of
Washington (i.e., low adoption rate), daily emissions will increase by 1.4%.
Table 15 mode choice and daily emissions for future and current states within Metro Vancouver

 MODE CURRRENT (2017- FUTURE AVERAGE TRIP EMISSION
 METRO (WASHINGTON- LENGTH (KM) FACTOR
 VANCOUVER) FIGURE 9) GCO2EQ
 ( )
 PKT
 Car 70%+1% (from
 72% 9.67 204.44
 other)=71%
 Transit 12% 7%+1%=8% 13.40 38.09
 Walking and
 16% 18%+1%=19% 1.17 0
 Bicycling
 ridehailing 2%+1%=3% 6.85 300.10
 Othera - 4% - -
 Daily emissions
 4.75 4.82
 (kg CO2eq)
a. other share is redistributed evenly across other modes

 Figure 9 person-trip mode split from (49)

 Commute mode split
 Washington-2016 Metro Vancouver-2017

 66.40% 69.70%

 20.10% 18.20%
 11.40%
 3.30%

 Car Transit Bike/Walk

Figure 10 commute mode split for Washington (70) and Metro Vancouver (3), car includes car driver and passenger for Metro
Vancouver and drive alone, carpool, and vanpool for Washington. 10.2% of work trips in Washington are “compressed work
schedule day off and telework”

 23
Table 16 summarizes the emission impacts of mode displacement for ridehailing users. To infer
mode displacement impacts of ridehailing, we assume a 1:1 relationship between mode and km
traveled. For instance, 26% of trips would be made by car in the absence of ridehailing service, this
assumption implies that 26% of annual VKT ridden in ridehailing service would be driven in a
private vehicle. However, such an assumption is limiting, for instance, people in private cars might
travel longer as out-of-pocket costs can be perceived lower than ridehailing services. Furthermore,
this assumption does not capture the holistic picture of travel behavior. For example, although a
ridehailing user tends to displace more transit and active travel they might reduce their annual VKT
due to shedding their personal vehicles. Thus, the estimates should be interpreted with caution.
Table 16 mode displacement impacts of ridehailing

 MODE DISPLACEMENT IMPACT EMISSION FACTOR
 GCO2EQ
 Displaced % Reference study Displaced ( )
 PKT
 km
 Car 26 (42–48, 54) 158b 204.44
 Carsharinga 11 (42, 47, 54) 69 127.27
 Transit 19 (42–48, 54) 117 38.09
 Walking and bicycling 12 (42–44, 46–48, 75 0
 54)
 Induced 10 (42–48) 63 -
 c
 Taxi 18 (43–48, 54) 111 300.10
 d
 Other 4 - -
 Total 100 594
 Annual emissions from ridehailing 178.26
 Annual emissions due to mode 78.86
 displacement
 Net emissions (kg CO2eq) +99.40
a. For carsharing as the type is not specified. Weighted average of emission factors based on annual VKT is used.
b. displaced distance is calculated based on %displaced (here 26%) times annual VKT of ridehailing user (here 594
km)+ 1/6 of other displaced distance (here 23.7 km)
c. As ridehailing competes with taxi services, we opt to report taxi, separately. The same emission factor with
ridehailing services is assumed for taxi services. Taxi services can have more deadheading (30) but as they are
regulated by cities, they are probably more fuel efficient than ridehailing services. These two factors justify the
assumed emission factor. Moreover, (40) estimated taxi emissions are very similar to ridehailing services in Toronto.
d. “Other“ is 100%- remaining mode shares, the km displaced for “other” is distributed equally across other modes

Displaced and induced travel leads to 99.40 kg more CO2eq annually per ridehailing user (excluding
other impacts such as reduced vehicle ownership level). The results are aligned with Table 15 with
respect to increased emissions expected from ridehailing services.

Figure 11 displays the average trip distance in bikesharing system in 2017 and 2020 as well as
corresponding rebalancing distances (Equation 9). Overall, in 2020 the average trip distance
increased marginally (by 0.23 km) while the efficiency of the system improved significantly (50%

 24
decrease in the average rebalancing km per 1 PKT bike trip). Furthermore, according to Mobi 2017
survey, the usage frequency for the year 2016 is approximated as 4.86 and for the year 2017 as
7.02 times a month (the monthly frequency of 7.02 is used in the rest of the analysis).

 0.1600 2017
 4

 total van km/total bike km
 0.1400
 average trip distance (km)

 3.5 2020
 0.1200
 3

 (rebalancing)
 2.5 0.1000
 2 0.0800
 1.5 0.0600
 1 0.0400
 0.5 0.0200
 0 0.0000
 September
 January

 August

 October
 February
 March

 May

 July

 December
 November
 April

 June

 September
 January

 July
 August

 October
 February
 March

 May

 December
 November
 April

 June
 Figure 11 Mobi system characteristics

The bikesharing system emission factors, as well as simulation results, are reported in Table 17.
Table 17 bikesharing emission factors

 ESTIMATED SIMULATION RESULTS
 EMISSION Average SD CV % 25th percentile 75th percentile
 GCO2EQ
 FACTOR ( )
 PKT
 10.42 20.49 5.47 26.72 16.79 24.16
Based on usage characteristics and the emission factor, bikesharing trips give rise to 2.48 kg CO2eq
per user per year. We further assessed mode displacement impacts in two years, 2017 and 2021.
Table 18 summarizes the estimates of mode displacement impact. In 2017, every user saved 8.41
kg CO2eq by undertaking their trips by bikesharing, while every user saved 11.24 kg CO2eq in 2021.
The comparison highlights the impact of the detailed mode displaced reported in the 2017 survey
(transit modes are individually reported and induced travel is considered in the 2017 survey).
Future surveys are recommended to similarly inquire about specific transit mode displaced and
take into account the trips that would not have been made in the absence of bikesharing (induced
trips).

 25
Table 18 mode displacement impacts of bikesharing

 MODE DISPLACEMENT IMPACT DISPLACEMENT IMPACT FROM EMISSION
 FROM 2021 MOBI 2017 MOBI SURVEY GCO2EQ
 FACTOR ( )
 PKT
 SURVEY
 Displaced % Displaced Displaced % Displaced km
 km
 Car 16 39b 8 17 204.44
 Carsharinga 5 12 5 11 127.27
 Transitc 23 55 Bus/seabus=20, Bus/seabus=44, For 2021: 38.09 For
 skytrain=6 skytrain=13 2017 bus/seabusd=
 101.67 and
 skytrain=2.334
 Walking and 53 126 45 98 0
 bicycling
 Inducedc - - 14 31 -
 e
 Taxi/ridehailing 3 7 2 4 300.10
 c
 Motorcycle - - 0.3 1 131.69f
 Rental bikec - - 0.2 0 0
 Total 100 238 100 218
 Annual emissions 2.48 2.27
 from bikesharing
 Annual emissions 13.61 10.68
 due to mode
 displacement
 Net emissions (kg -11.13 -8.41
 CO2eq)
a. For carsharing as the type is not specified. The weighted average of emission factors based on annual VKT is used.
b. Displaced distance is calculated based on %displaced (here, 16.25%) times annual VKT of bikesharing user (here,
238 km
c. In 2021 survey, the transit modality, motorcycle, or rental bike were not given as options. Neither was an option for
not making the trip
d. Weighted average based on information in Table 3 is used.
e. As ridehailing competes with taxi services, we opt to report taxis, separately. The same emission factor with
ridehailing services is assumed for taxi services. Taxi services can have more deadheading (30) but as they are
regulated by cities, they are probably more fuel-efficient than ridehailing services. These two factors justify the
assumed emission factor. Moreover, (40) estimated taxi emissions are very similar to ridehailing services in Toronto.
f. from (60) and assumed fuel consumption rate of 5.9 L/100 km from https://afdc.energy.gov/data/
g. average trip distance in 2017 Mobi data is 2.59 km, same monthly frequency of 7.02 is used for both years.

To put these results into perspective, the annual GHG impacts from mode displacement are
converted to tangible equivalents 6. GHG savings from carsharing and bikesharing and added
emissions in case of ridehailing are converted to miles driven in a passenger car that produce the
same emissions. Additionally, we reported the number of smartphones that their charging

6
 By EPA Greenhouse Gas Equivalencies Calculator available at https://www.epa.gov/energy/greenhouse-gas-
equivalencies-calculator

 26
You can also read


