ENVIRONMENTAL JUSTICE (EJ) PLAN - North Front Range Metropolitan Planning Organization 2021
←
→
Page content transcription
If your browser does not render page correctly, please read the page content below
North Front Range Metropolitan Planning Organization

ENVIRONMENTAL
JUSTICE (EJ) PLAN
Adopted April 1, 2021
Environmental Justice (EJ) Plan

                                            Prepared by:
                       North Front Range Metropolitan Planning Organization
                                     419 Canyon Ave, Suite 300
                                       Fort Collins, CO 80521
                                            nfrmpo.org

                                             Adopted:
                                            April 1, 2021

Preparation of this document has been financed in part through grants from the Federal Highway
Administration, Federal Transit Administration, the Colorado Department of Transportation, and the
local member communities of the NFRMPO.

                                                  i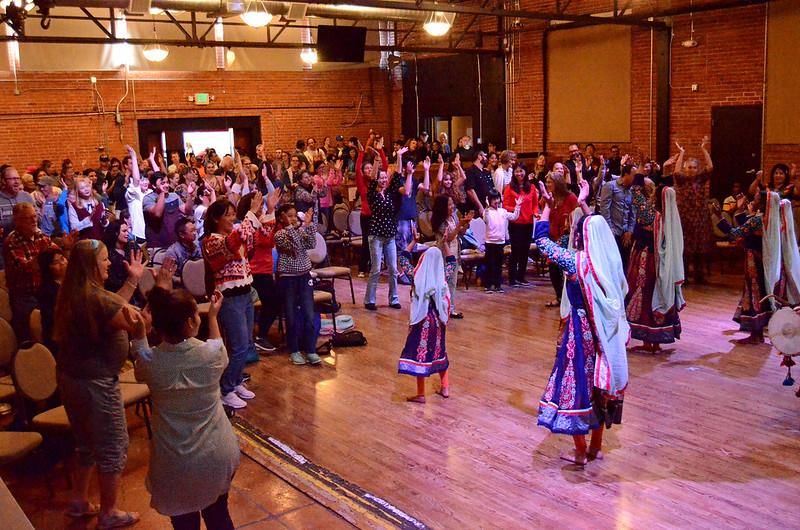
Acknowledgements

Planning Council                                         Technical Advisory Committee
Mayor Donald McLeod, Chair – Severance                   Mitch Nelson, Chair - Severance
Mayor William Karspeck, Vice Chair – Berthoud            Eric Tracy, Vice-Chair - Larimer County
Dave Clark, Past-Chair – Loveland                        Dave Klockeman, Past Chair - Loveland
Mayor Lanie Isbell – Eaton                               Stephanie Brothers - Berthoud
Mayor Pro Tem Mark Clark – Evans                         Josie Hadley - CDOT
Mayor Tem Wade Troxell – Fort Collins                    Rick Coffin - CDPHE-APCD
Mayor Fil Archuleta – Garden City                        Jeff Schreier - Eaton
Brett Payton – Greeley                                   Mark Oberschmidt - Evans
Troy Mellon – Johnstown                                  Brad Buckman - Fort Collins
Commissioner Kristin Stephens – Larimer County           Vacant - Garden City
Paula Cochran – LaSalle                                  Allison Baxter - Greeley
Mayor Elizabeth Austin – Milliken                        Marco Carani - Johnstown
Lisa Laake – Timnath                                     Vacant - LaSalle
Commissioner Scott James – Weld County                   Pepper McClenahan - Milliken
Mayor Paul Rennemeyer – Windsor                          Eric Fuhrman - Timnath
Commissioner Kathleen Bracke – Transportation            Dawn Anderson - Weld County
Commission                                               Omar Herrera - Windsor
Dena Wojtach – CDPHE-Air Pollution Control Division      Amanda Brimmer – RAQC*
                                                         Aaron Bustow - FHWA*
                                                         Darren Davis - GET*
                                                         Candice Folkers - COLT*
                                                         Ranae Tunison - FTA*
                                                         Kaley Zeisel - Transfort*
                                                         Varies - NoCo Bike & Ped Collaborative*
                                                         * = Non-voting member

NFRMPO Staff
Suzette Mallette – Executive Director
Becky Karasko, AICP – Transportation Planning Director
Cory Schmitt – Mobility Manager
Alex Gordon, PTP – Transportation Planner III
Medora Bornhoft, PTP – Transportation Planner II
Ryan Dusil – Transportation Planner II
AnnaRose Cunningham – Transportation Planner I

                                                 ii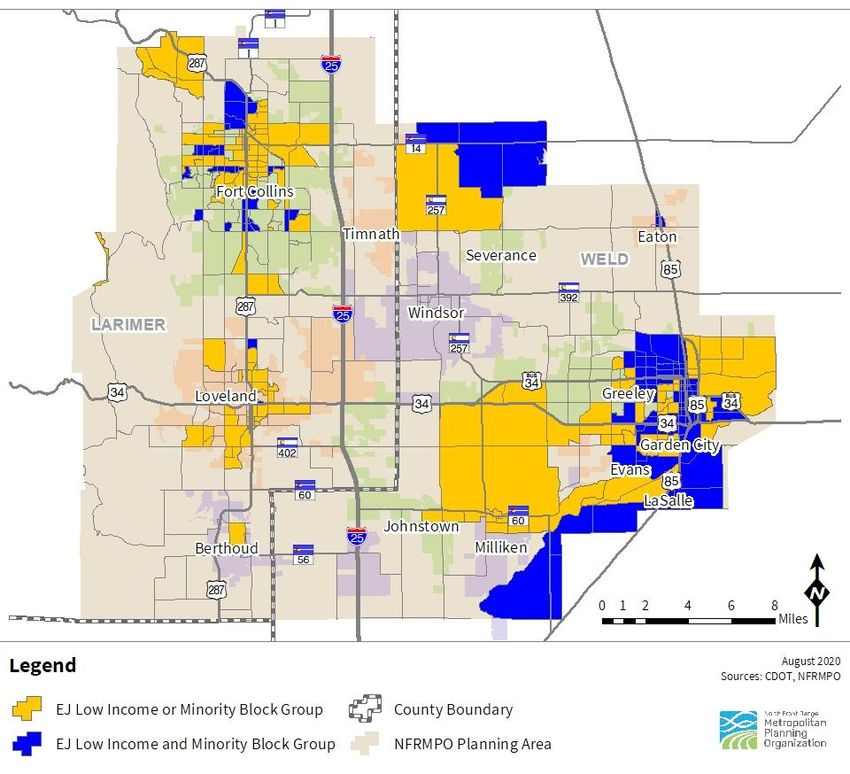
Table of Contents
Executive Summary ...................................................................................................................1
Part I / Environmental Justice Report ........................................................................................ 2
Section I / Introduction ............................................................................................................. 3
  North Front Range MPO ................................................................................................................................. 3
   Environmental Justice ................................................................................................................................... 4
   Regulations...................................................................................................................................................... 5
   Purpose ............................................................................................................................................................ 5
   Demography .................................................................................................................................................... 6
   History and Background ................................................................................................................................ 7
   Vision, Goals, and Approach .......................................................................................................................... 9
   Outreach .......................................................................................................................................................... 9
Section II / Analysis of Benefits and Burdens ............................................................................. 15
  EJ Analysis ..................................................................................................................................................... 15
   Benefits and Burdens ................................................................................................................................... 16
Section III / Demographic Analysis ............................................................................................ 21
  Demographic Profiles ................................................................................................................................... 21
   Demographic Changes ................................................................................................................................. 24
       Regional Transportation Plan (RTP) Comparisons ............................................................................... 24
   EJ Thresholds ................................................................................................................................................ 25
       Minority Concentration ............................................................................................................................ 25
       Low Income ............................................................................................................................................... 26
       Additional Communities of Concern ...................................................................................................... 27
   Future Demographics ................................................................................................................................... 31
       Looking Forward ....................................................................................................................................... 31
       Forecasts by Race ..................................................................................................................................... 31
Part II / Recommendations .......................................................................................................34
Section I / Recommendations ...................................................................................................35
Part III / Appendices.................................................................................................................40

List of Tables
Table 1: Example Benefits and Burdens ......................................................................................................... 16
Table 2: Potential Project-Specific Benefits, Burdens, and Mitigation Strategies ...................................... 17
Table 3: Population and Demographics, 2014-2018 ...................................................................................... 21

                                                                                  iii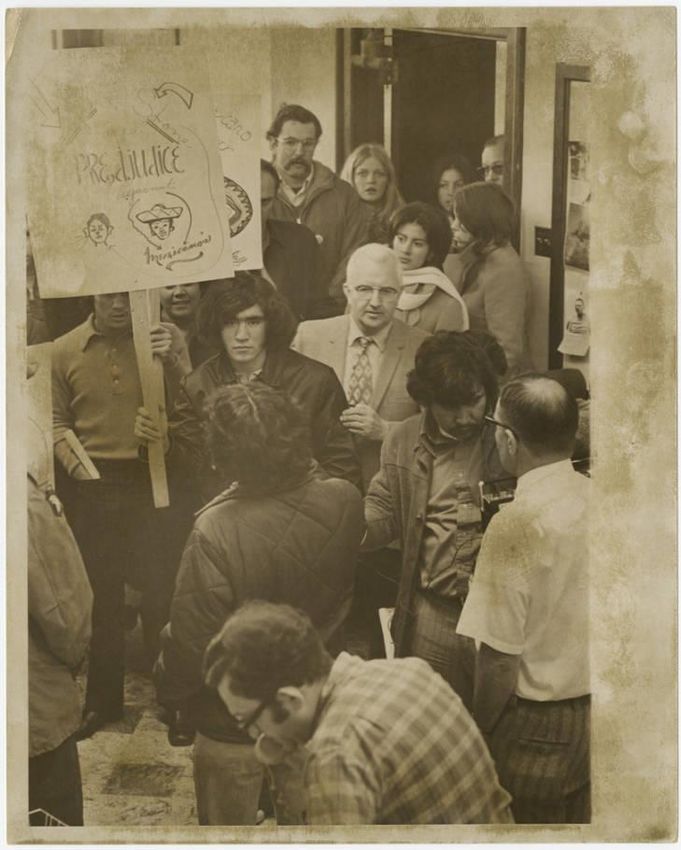
Table 4: Comparison of 2040 and 2045 RTP Race and Ethnicity Data ......................................................... 24
Table 5: Comparison of 2040 and 2045 RTP Gender and Age Data .............................................................. 25
Table 6: Minority Populations by County and NFRMPO, 2018 ...................................................................... 26
Table 7: Low Income Populations by County, 2018 ....................................................................................... 26
Table 8: Limited English Proficiency by County and NFRMPO, 2018............................................................ 28
Table 9: Older Adult Population by County and NFRMPO, 2018................................................................... 28
Table 10: Youth Population by County and NFRMPO, 2018 .......................................................................... 29
Table 11: Female-Headed Households by County and NFRMPO, 2018........................................................ 29
Table 12: Population with a Disability by County and NFRMPO, 2018 ......................................................... 30
Table 13: Households with Zero Vehicles by County and NFRMPO, 2018.................................................... 30
Table 14: Race by County, 2045 ....................................................................................................................... 31
Table 15: Total Households with an Annual Income Below $60K in the NFRMPO, 2045 ............................ 32
Table 16: Total Households by Renter and Owner Occupation, 2045 ......................................................... 32
Table 17: Older Adult Population by County, 2045 ........................................................................................ 33
Table 18: Youth Population by County and NFRMPO, 2045 .......................................................................... 33

List of Figures
Figure 1: NFRMPO Planning Area ....................................................................................................................... 3
Figure 2: NFRMPO EJ Areas, 2018 .................................................................................................................... 23

                                                                           iv
Executive Summary
The Environmental Justice (EJ) Plan serves as              Colorado. This section includes
a guide for enhancing EJ considerations in                 recommendations for the NFRMPO and its
transportation planning initiatives across                 member agencies within various time horizons.
Northern Colorado. The Environmental                       Many are adapted from best practices and will
Protection Agency (EPA) defines EJ as “the fair            require the commitment of additional resources
treatment and meaningful involvement of all                and/or other changes to business as usual.
people regardless of race, color, national origin,         Appendix A highlights various best practices
or income, with respect to the development,                from across the region, state, and nation. These
implementation, and enforcement of                         examples focus on improving EJ considerations
environmental laws, regulations, and policies.”            through engagement and outreach, analysis and
Development of the EJ Plan began in late 2019,             assessment, and effective use of technology. It
prior to the COVID-19 pandemic and many of the             also includes books, guides, groups, articles, and
landmark social justice events and movements               videos for further exploration. These resources
of 2020. This Plan acknowledges that                       can be referenced by local partners and NFRMPO
transportation plays a role in social and                  staff to better integrate equity into public
environmental equity and challenges the                    processes.
NFRMPO and its member agencies to lead with
                                                           Appendix B provides additional information
equity and inclusion.
                                                           about community-specific resources and
Part I of the EJ Plan describes demographics of            stakeholders to engage across the NFRMPO
the region and identifies current methods for EJ           region.
analysis, acknowledging strengths, weaknesses,
                                                           Finally, Appendix C lists acronyms commonly
and targeted areas for improvement.
                                                           used in the field of transportation planning.
Part II contains recommended local and
regional actions that can improve EJ in Northern

                                        Greeley Multicultural Festival
                                      Image credit: City of Greeley Flickr

                                                                                                 EJ Plan | 1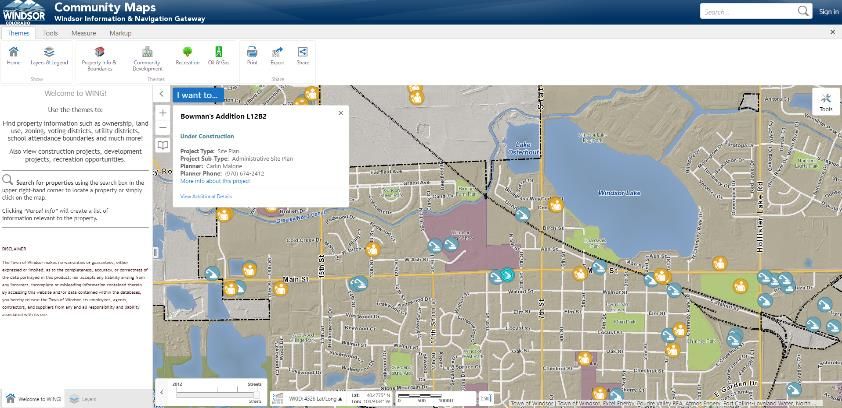
Part I / Environmental Justice Report

2 | Part I / EJ Report
Section I / Introduction
NORTH FRONT RANGE MPO
The North Front Range Metropolitan Planning            Transportation Improvement Program (TIP).
Organization (NFRMPO) is the federally                 This EJ Plan will identify other programs, plans,
mandated metropolitan planning agency for the          or efforts that would benefit from inclusion of EJ
Greeley Urbanized Area (UZA) and the Fort              policies.
Collins Transportation Management Area (TMA)           The RTP is updated every four years with a focus
as well as the surrounding areas in Larimer and        on improvements necessary for all modes of
Weld counties expected to urbanize in the next         transportation over the next two decades.
two decades. The demographics of the area are          NFRMPO staff work with partner agencies and
explored in detail in Part I, Section III.             stakeholders to include a robust public outreach
It is important to note the NFRMPO does not            program as part of this planning effort.
cover the entirety of either Larimer or Weld           The TIP is usually updated every other year in
county. Some data is only available for an entire      coordination with the Colorado Department of
county, which are noted as “(all)” in the tables,      Transportation (CDOT). The TIP is a listing of all
while other data can be analyzed for the area          programmed projects using state and federal
within the NFRMPO boundary, which are noted            transportation funding as well as locally funded
as “(part)”.                                           regionally significant projects.
Currently, NFRMPO staff completes                      In addition to these two documents, the
environmental justice (EJ) analyses for two            NFRMPO also addresses EJ in the Public
major planning processes: the Regional                 Involvement Plan (PIP) and the Title VI Plan.
Transportation Plan (RTP) and the

                                      Figure 1: NFRMPO Planning Area

                                                                                              EJ Plan | 3
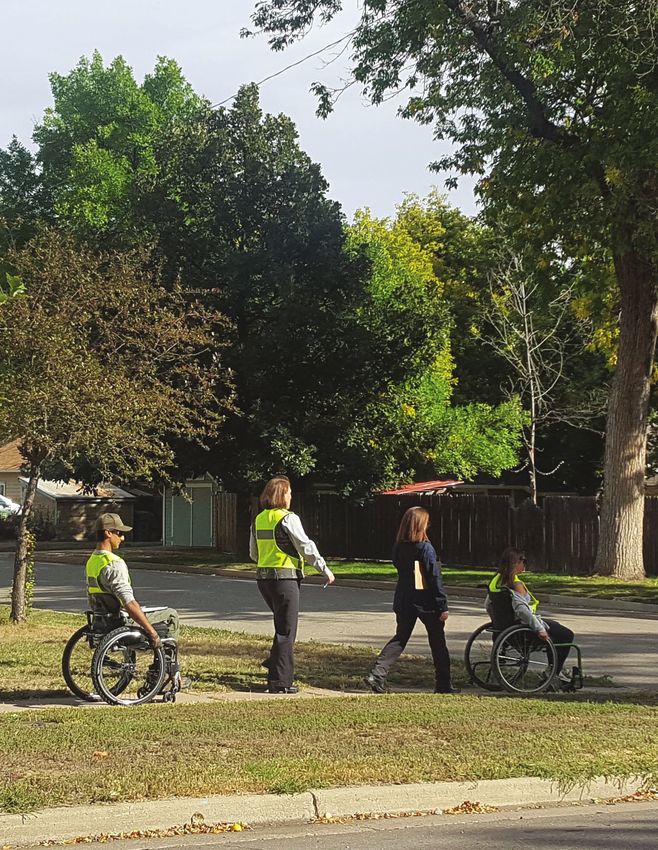
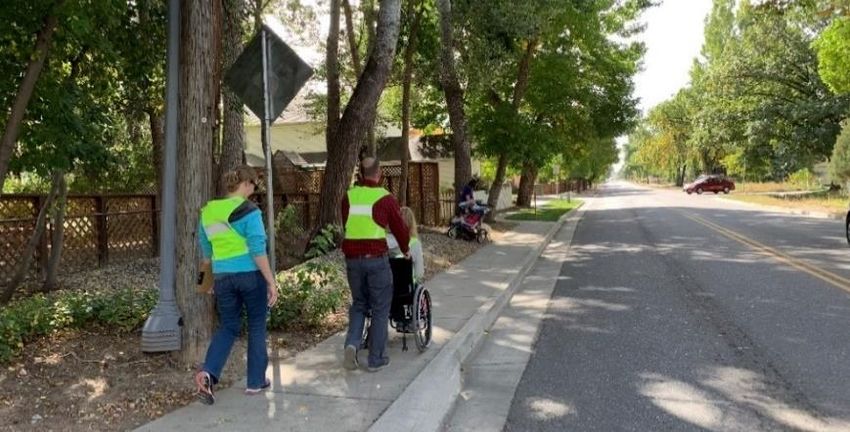
Community members complete a walk audit in Berthoud, 2019.

ENVIRONMENTAL JUSTICE
The EPA defines EJ as “the fair treatment and         overlap, Title VI and EJ requirements address
meaningful involvement of all people regardless       separate actions and regulations.
of race, color, national origin, or income, with      According to the Federal Transit Administration
respect to the development, implementation,           (FTA), “Title VI requirements are broader in
and enforcement of environmental laws,                scope than EJ”1 but do not address the impact of
regulations, and policies.” Federal Highway           projects on low-income residents. Though both
Administration (FHWA) expands on this                 are required for federal grantees, an analysis for
definition by adding EJ “identif[ies] and             one does not suffice for both.
address[es] disproportionately high and adverse
                                                      CDOT provides the following guidelines
effects of the agency's programs, policies, and
                                                      regarding EJ in its National Environmental
activities on minority populations and low-
                                                      Policy Act (NEPA) Guide:
income populations to achieve an equitable
distribution of benefits and burdens.” Benefits       •   To avoid, minimize, or mitigate
and burdens are explored more in Part I,                  disproportionately high and adverse human
Section II.                                               health and environmental effects, including
                                                          social and economic effects, on minority
Oftentimes, Title VI of the Civil Rights Act and EJ
                                                          populations and low-income populations.
are conflated. Title VI specifically addresses
                                                      •   To ensure the full and fair participation by all
discrimination on the basis of race, color, or
                                                          potentially affected communities in the
national origin, while EJ addresses the
                                                          transportation decision-making process.
distribution of benefits and burdens on low
                                                      •   To prevent the denial of, reduction in, or
income and minority residents. While they may
                                                          significant delay in the receipt of benefits by
                                                          minority and low-income populations.

1
  https://www.transit.dot.gov/faq/environmental-
justice/what-different-between-title-vi-and-ej,
Accessed 3/3/2020.

4 | Introduction
REGULATIONS
Executive Order 12898, Federal Actions to Order). The DOT Order updates the Department’s
Address Environmental Justice (EJ) in Minority original EJ Order, which was published April 15, 1997.
Populations and Low-Income Populations The DOT Order continues to be a key component of
(1994), was enacted to reinforce Title VI of the the USDOT’s strategy to promote the principles of EJ
Civil Rights Act of 1964. Executive Order 12898 in all DOT programs, policies, and activities.
states, “each Federal agency shall make President Biden signed an Executive Order on January
achieving environmental justice part of its 27, 2021 directing federal agencies to develop
mission by identifying and addressing, as programs, policies, and activities to address the
appropriate, disproportionately high and disproportionate health, environmental, economic
adverse human health or environmental effects and climate impacts on disadvantaged communities.
of its programs, policies, and activities on The order establishes a government-wide Justice40
minority populations and low-income Initiative to deliver 40 percent of overall benefits of
populations.” federal investments to disadvantaged communities.
In May 2012, the USDOT issued an updated internal These efforts will build on and update EO 12898.
Order 6110.2(a), Actions to Address EJ in Minority NFRMPO staff will continue monitoring these federal
Populations and Low-Income Populations (DOT actions and the implications for Northern Colorado.
PURPOSE
The overall purpose of the EJ Plan is to be useful “The Public Involvement Plan (PIP) should
to local communities and NFRMPO staff to include explicit procedures, strategies, and
ensure the agency has plans, programs, and outcomes for seeking out and considering the
projects that consider the needs of all residents needs of those traditionally underserved by
of the region. This should not be a plan that sits existing transportation systems, such as low‐
on the shelf but is actively used and built upon. income and minority households, who may face
Over the last few years, NFRMPO staff and challenges accessing employment and other
partner agencies have discussed ways to better services.”
integrate EJ analysis into the transportation NFRMPO staff has been working on this project
planning process. These discussions as well as since January 2020, building on the PIP adopted
feedback from FHWA and FTA provided the by the Planning Council in March 2019. MPOs and
context for the EJ Plan to be included in the communities across the country have started
NFRMPO’s current Unified Planning Work integrating more EJ into their policies, allowing
Program (UPWP), which was approved by the NFRMPO staff to research existing efforts and
Planning Council in June 2019. include best practices in the EJ Plan. The
During the NFRMPO’s Certification Review in partnerships built during this project have
2018, FHWA and FTA identified a need for the already helped the NFRMPO get greater and
NFRMPO to evaluate its public outreach and more in-depth feedback on its plans and
track how the agency interacts with low income projects.
and minority populations. Specifically, the
recommendation from FHWA and FTA reads,
EJ Plan | 5DEMOGRAPHY
This section addresses common terms used when discussing EJ. The definitions are taken from the
National Environmental Policy Act (NEPA) Guide, adopted by CDOT in 2017, or from official US Census
definitions. Specific application of these terms in Northern Colorado is addressed in Part I, Section III.
• Block Group – A combination of Census • Minority – Populations including:
blocks that is a subdivision of a Census tract o Black – a person having origins in any of
or block numbering area. the black racial groups of Africa.
• Low Income – Household income is at or o Hispanic or Latin – a person of Mexican,
below the Department of Health and Human Puerto Rican, Cuban, Central or South
Services (HHS) poverty guidelines. American, or other Spanish culture of
• Low-income population – Any readily origin, regardless of race.
identifiable group of low-income persons o Asian American – a person having origins
who live in geographic proximity. in any of the original peoples of the Far
• Minority population – Any readily East, Southeast Asia, or the Indian
identifiable group of minority persons who subcontinent.
live in geographic proximity. o American Indian and Alaskan Native – a
person having origins in any of the
original people of North America, South
America (including Central America), and
who maintains cultural identification
through tribal affiliation or community
recognition.
o Native Hawaiian or Pacific Islander – a
person having origins in any of the
original peoples of Hawaii, Guam,
Samoa, or other Pacific Islands.
• Communities of Concern – additional populations in the North Front Range region that should be
considered with additional resources in the planning process, including:
o Limited English Proficiency o Zero-car households
o Persons with disabilities o Female-headed households
o Persons over the age of 60 o Unhoused populations
o Persons under the age of 18
These demographics are discussed in Part I, Section III.
6 | IntroductionHISTORY AND BACKGROUND
Decades of anecdotal reports, case studies, and Greeley, laborer colonies on the outskirts of
community activism culminated in the EPA’s other Weld County communities such as Milliken,
1992 finding that, “racial minority and low- Eaton, Johnstown, and Greeley, and the
income populations experience higher than Buckingham, Andersonville, Alta Vista, and Holy
average exposures to selected air pollutants, Family neighborhoods in Fort Collins.3 These
hazardous waste facilities, contaminated fish, neighborhoods were intentionally located near
and agricultural pesticides in the workplace.”2 fields and factories and away from established
This includes disproportionately high exposure centers of commerce and public life. In Fort
to facilities with high emission rates such as Collins, the prevailing mindset was that
highways and factories. The specific issues faced “secluding the neighborhoods across the river
by communities across the nation vary widely from Fort Collins would keep seditious, suspect,
based on local context, but the patterns of and unwelcomed foreign influences from
disparity are often discernable. seeping into more established neighborhoods.”
In Northern Colorado, some of the These secluded neighborhoods were
environmental inequities can be traced back to disproportionately exposed to the factory smoke
the region’s well-known sugar beet industry in and odors, streams of industrial waste effluent,
the early 20th century. The Great Western Sugar odors from the city dump, and flood hazards. 4
Company assisted in developing neighborhoods As anti-European sentiment grew and
to house its field and factory laborers, originally immigration policies tightened with World War I,
consisting mainly of Germans from Russia. This the German from Russia labor force was
included areas like Spanish Colony outside replaced predominantly by Hispanic immigrants
Fort Collins Great Western Sugar Factory
Image credit: Fort Collins Museum of Discovery
2
https://www.epa.gov/sites/production/files/2015- 4
Work Renders Life Sweet: Germans from Russia in
02/documents/reducing_risk_com_vol2.pdf (page 3) Fort Collins, 1902-2000. SWCA Environmental
3
https://www.greeleytribune.com/news/local/welds- Consultants. Page 9
untold-story/
EJ Plan | 7from Mexico and the southwest United States. Over decades, these development patterns have
The low-paying agricultural, industrial, and prioritized vehicle and goods movement over
mining jobs reinforced the geographic and social quality of life factors such as noise, pollution,
disparities by income and race in the safety, and inclusion. Some of these
aforementioned neighborhoods. This history environmental inequities are captured in the
perpetuated the “other side of the tracks/river” USDOT’s list of potential burdens created by
stigma that can still be seen in some Northern transportation-related activities and are at the
Colorado communities. Loveland was notorious heart of EJ. Rapid growth, development, and the
as a “Sundown Town,” meaning people of color resulting rise in cost of living in Northern
were formally or informally banned from the city Colorado are placing increased pressures on all
limits after sunset until 1960.5 Some downtown communities of concern, reinforcing the
storefronts in Loveland, Fort Collins, and Greeley importance of EJ analysis and considerations.
included signs indicating “White-Trade Only”
and “No Dogs or Mexicans Allowed.” An
Hispanic Students Picketing, 1983
unnamed Fort Collins Police Officer stated that
among the Police Department’s duties in the
1950s and 1960s “was to keep Mexicans on their
side of town.” Some low income and minority
neighborhoods resorted to self-funding their
own road repair due to lack of investment or
responsiveness from the cities and counties. As
environmental activism grew across the nation
in the 1960s and 1970s, it caught on locally as
well. Neighborhoods partnered with
organizations such as Neighbor to Neighbor to
advocate for sewer service and paved roads,
which finally came to neighborhoods like Alta
Vista in the 1970s and 1980s.6
The infrastructure and service disparities have
continued to evolve in more recent decades but
can be linked back to the strong agricultural
roots that largely shaped the built environment
across the region. Along most Northern Colorado
highways, there are instances of auto-oriented Image credit: Greeley History Museum
development near or through neighborhoods
with higher rates of poverty or minority status,
low rates of automobile ownership, and less
access to the public decision-making process.
5
https://www.reporterherald.com/2016/07/02/lovela 6
Hang Your Wagon to a Star: Hispanics in Fort Collins,
nd-wasnt-immune-to-nations-divided-past/ 1902-2000. SWCA Environmental Consultants. Page 9
8 | IntroductionVISION, GOALS, AND APPROACH
The following is the vision created by NFRMPO stakeholders as part of the 2045 RTP. The EJ Plan seeks
to ensure this vision applies to all residents of the region, regardless of race, ethnicity, or income.
We seek to provide a multi-modal transportation system that is safe, as well as
socially and environmentally sensitive for all users that protects and enhances the
region’s quality of life and economic vitality.
To ensure all populations are included, the NFRMPO is defining the following goals for this EJ Plan:
1. Analyze access to the decision-making process across the region
2. Identify partnerships and engagement strategies
3. Define clearly the benefits and burdens that incorporate local and regional context
4. Consider additional communities of concern, including those with above average rates of LEP,
older adults, youths, individuals with disabilities (ambulatory, self-care, independent living,
hearing, vision, or cognitive difficulties), zero-car households, female-headed households, and
unhoused populations
5. Recommend improvements to local and regional EJ considerations on transportation projects
and public involvement
These goals will only be met if the NFRMPO continues to invest staff time and funding into the
following approach to EJ. This approach is adapted from the NEPA Guidance.
• Identify the potential burdens and benefits
• Identify the target populations within the study area
• Correlate the identified burdens and benefits to the target populations
• Note possible mitigation strategies for identified disproportionate burdens
• Determine which public participation methodologies to use
• Make EJ recommendations
• Evaluate the implementation of the EJ process
OUTREACH
Public involvement is the centerpiece of the planning process. Grantees of FTA and FHWA funds are
specifically required to “develop explicit procedures, strategies, and desired outcomes for public
involvement, make special efforts to engage members of low-income and minority communities, and
periodically evaluate the effectiveness of that engagement from visioning to project development and
operations.” The Interagency Working Group on EJ (EJ IWG), which is made up of a collection of federal
agencies, highlights that outreach should lead to meaningful engagement, which it defines as
community participation in agency decision-making that is inclusive, effective, and accessible to all.
Outreach should inform and involve community partners and stakeholders early, often, and
continuously.
EJ Plan | 9During the development of the EJ Plan, NFRMPO staff interviewed residents and community partners
working on equitable public engagement around the region. From these discussions, key themes for
equitable outreach emerged and are described in the following strategy list. With some of these
themes, examples are listed with corresponding page numbers from Appendix A, where they are
described in further detail alongside several additional best practices. These themes will help guide
improvements to NFRMPO outreach efforts.
NFRMPO staff conducted interviews with the following agencies, organizations, groups, or
communities as well as created a survey available in English and Spanish.
• City of Evans • Larimer County Department of Health
• City of Fort Collins and Environment, Built Environment
• City of Loveland Program
• Diverse Fort Collins • Larimer County Mobility Committee
• EnFoCo • NoCo Bike & Ped Collaborative
• The Family Center/La Familia • TAC
• Greeley-Evans School District 6 • Town of Milliken
• Immigrant and Refugee Center of • Weld County Mobility Committee
Northern Colorado • United Way of Larimer County
• United Way of Weld County
• Weld County
Get out into the community and build partnerships.
A traditional two-hour Open House at a municipal building will only attract a small, and specific
subset of the community. To broaden the reach of a project, planners and project teams need to
“meet the people where they are” by going into the community. This is important during and in
between major planning initiatives. Meaningful involvement requires building partnerships with,
and empowering community-based organizations, local businesses, faith-based institutions, or
advocates and building trust over time. This also means bringing interpreters to ensure all
residents are heard and invested. Find out if there are ways you can get your name and message
into community bulletins or newsletters, so community members become familiar with you
before you ask for their time and input.
Examples:
Community Engagement Steering Committee (CESC) and Equity Advisory Committee (EAC) –
(page A-9)
Citizen’s Academy (page A-7)
Civic Leadership Academy (page A-9)
Be interactive and have fun.
Many things are vying for people’s attention and interest. Project teams need to find interactive,
innovative, and relatable ways to discuss goals and visions, funding, and project deliverables,
10 | Introductionamong other things. Can you turn engagement into a game or contest? How can you better
incorporate arts and culture? Are your strategies or materials lively and engaging or overly formal
and technical? Can you get community members to help in the planning? Ask colleagues, friends,
or family members who are further removed from the project or process to review your materials
and provide honest feedback. Show up to the event with interesting bullet points, be open to
pivoting in conversation, and make things relatable. Your residents work hard enough already; do
not make their participation feel like work, too.
Examples:
Mobile Transit Lab (page A-9)
Take your time.
Building trust with communities takes time. Traditionally disadvantaged communities may have
lost trust in the government over time. Do not expect that trust to be restored after one or two
projects and be ready to adjust your strategies.
Allow time for people to understand a process or project. You may need to reevaluate your
process along the way and add events, have follow-up conversations, or rethink your messaging.
Good public outreach will mean deadlines or timelines need to be extended from time to time. It
takes time to identify, evaluate, and mitigate the potential impacts of a policy, program, or project
being proposed in a community. Delays can be a chance to improve the project, improve your
process the next time around, and enhance relationships with the community.
Understand and respond to the needs of the community.
Engage the leaders who live and work in the communities you are engaging with. Each
community has different needs. For many, online input opportunities are preferable and more
convenient. During the COVID-19 pandemic, online interaction became the norm. Organizations
should continue expanding their fluency with digital engagement.
When in-person meetings are possible, do not expect a standard meeting time, size, place, and
format to work for everyone. It is difficult for citizens to participate in the public process if they are
struggling to meet their own basic needs. Provide childcare, language services, a meal or snacks,
transportation and parking vouchers, and small financial incentives if possible. Additionally,
preferred learning style varies from person to person. Send a diverse team and keep meetings
small to encourage interaction and make the setting less intimidating.
Make sure you have something to offer visual, auditory, reading/writing, and kinesthetic learning
styles in a comfortable setting that is not overly formal or large. Ensure these accommodations
are identified as allowable expenses in project budgets and requests for proposals (RFPs).
Examples:
Free Child Care for City Council Meeting Attendees (page A-10)
Municipal Service Center & South Main Biz Hub (page A-14)
EJ Plan | 11Establish and maintain good communication.
The earliest stages of the planning process (long-range planning, visioning, and scenario
planning) are crucial to defining community priorities and concerns. It is equally important to
continue outreach during design, construction, and operation to ensure the values identified early
on are being addressed. Reach out early and often. Being proactive and persistent increases the
chances of addressing areas of concern or outright opposition from community members. Make
sure you are communicating updates via multiple methods, platforms, and meda.
Make the request clear upfront – What feedback do you want from the community? When do you
want it? How will that feedback be incorporated into the project? When will you follow up with the
community? What is the timeline? What project updates should the community be looking out for,
and where? How can they stay involved and contact you later? Questions like these too often go
unanswered, making community members feel their voice was not actually heard. Community
members are wondering these things, whether they ask you explicitly or not. If you do not address
them early on, do not expect the community to engage moving forward. Community
organizations and their leaders are invaluable partners for getting started on the right foot.
Use plain language.
When possible, remove industry jargon from your communications and/or define the terms in a
glossary of terms that participants can refer to. While standard industry acronyms and terms are
used by professionals in the field every day, they are often unfamiliar, or have an entirely
different meaning, to the general public. Be aware of the educational attainment and English
proficiency level of your intended audience and adjust or translate your content accordingly.
Test your content beforehand by asking people unfamiliar with your project or field of work to
review it. Your organization may have someone like a public information officer (PIO) to help you
identify if you are writing for your intended audience. The Plain Language Action and Information
Network (PLAIN) offers guidance for public agencies. PLAIN is a group of federal employees from
different agencies and fields who support the use of clear communication in government writing.
Be Intentional.
What is the intent of your public engagement? Is it to inform? Involve? Consult? Collaborate? All
of the above? The tools and strategies you employ will look a lot different depending on your
answer. Be deliberate in your approach. If you are holding a public meeting purely to inform the
public of an upcoming construction project breaking ground in a couple weeks, participants may
believe it is an opportunity to impact the design. In this instance, a public notice may be more
appropriate. Be intentional about choosing a method or medium that is better suited for the
desired outcomes. Failing to do so can damage hard-earned trust. It is obvious to community
members if you are simply “checking a box” in the public process.
Examples:
Transportation Outreach Planner (page A-8)
Practices in Engagement in the Time of COVID (page A-8)
12 | IntroductionStrive for shared decision making and community ownership.
Some public meetings leave the impression that a decision was made before the meeting ever
started. Community members are experts on what their neighborhoods need most. Ask them to
show you problem areas and work through solutions alongside them. Tap them to help you plan
events and take part in implementation. This could mean handing over or collaborating on public
art or other design components to ensure they honor area culture and history.
Examples:
Tactical Urbanism as Community Engagement (page A-7)
Milliken Skatepark – Leading with Youth Engagement (page A-3)
Get comfortable being uncomfortable.
Equity conversations can be difficult. This is not a reason to not have them. Expect criticism and
push back and follow up with those who provide it. Having these tough conversations internally
first is critical. Be prepared to consider perspectives different from your own and encourage your
colleagues to do the same. Ask critical questions about the planning process and how it might
neglect certain parts of the community. Does your planning process truly align with your
community vision and goals? Standardize a set of questions for project team members to answer
prior to starting a new project or initiative, then discuss them as a team.
Examples:
Just-In-Time (JIT) Equity Assessment (page A-6)
Local and Regional Government Alliance on Race and Equity (GARE) (page A-8)
Evaluate the effectiveness of your strategies.
Equitable values are often reflected in a community’s vision and goals but are less often reflected
in day-to-day operations. Collect and analyze data to figure out what community members you
are or are not reaching along the way. Are there certain demographic groups or neighborhoods
that are under- or overrepresented in the feedback you have collected? Agencies set performance
measures and targets to measure the success of the transportation system. This can and should
be done for your public outreach program(s) as well. National organizations such as Local and
Regional Government Alliance on Race and Equity (GARE) specialize in providing assistance in
these areas.
Examples
City Staff Racial Impact Self Assessments (page A-11)
Regional Transportation Equity Evaluation (page A-11)
EJ Plan | 13Commit resources.
Outreach and engagement strategies that tailor to the needs and preferences of a community
require staff time and financial resources. Activities that involve direct expenses may include
renting a venue, purchasing refreshments, translating, and printing materials, arranging free
transit passes and/or rides, providing translators, and hiring child-care providers. Agencies may
also consider allocating funds directly to local organizations to help boost participation in
planning studies or other activities focused on EJ populations and other communities of concern.
Examples
Community Partners, Plan Ambassadors, Online Idea Boards, and Virtual Workshops (page A-2)
14 | IntroductionSection II / Analysis of Benefits and Burdens
EJ ANALYSIS
An EJ analysis is completed for all location-specific individual projects included in or amended into the
TIP and RTP. If a project is located in, within ¼ mile of, or adjacent to an area with a substantial EJ
population, it is considered to be an EJ project. If it does not, it is considered to be a Non-EJ project.
The benefits and burdens of each project must be examined individually, regardless of its EJ status. An
overall analysis of the TIP determines if it meets EJ requirements. The analysis process follows three
guiding principles outlined in DOT Order 5610.2(a):
• To avoid, minimize, or mitigate disproportionately high and adverse human health and
environmental effects, including social and economic effects, on minority and low-income
populations in relation to transportation improvements.
• To ensure the full and fair participation by all potentially affected communities in the
transportation decision-making process.
• To prevent the denial of, reduction in, or significant delay in the receipt of benefits by minority and
low-income populations.
Under this DOT Order, an adverse effect means:
• Bodily impairment, infirmity, illness, or • Vibration
death • Adverse employment effects
• Air, noise, and water pollution and soil • Displacement of persons, businesses, farms,
contamination or non-profit organizations
• Destruction or disruption of man-made or • Increased traffic congestion, isolation,
natural resources exclusion, or separation of individuals within
• Destruction or diminution of aesthetic values a given community or from the broader
• Destruction or disruption of community community
cohesion or a community’s economic vitality • Denial of, reduction in, or significant delay in
• Destruction or disruption of the availability the receipt of benefits of USDOT programs,
of public and private facilities and services policies, or activities.
An EJ analysis also includes a determination of whether the activity will result in a “disproportionately
high and adverse effect on human health or the environment,” defined in DOT Order 5610.2(a) as:
• Being predominately borne by a minority population and/or low-income population
• Suffered by the minority population and/or low-income population and is appreciably more severe
or greater in magnitude than the adverse effect that will be suffered by the non-minority
population and/or non-low-income populations.
According to FHWA, many agencies analyze EJ benefits by overlaying projects onto maps. In these
cases, the benefit is shown as investment in a low-income or minority neighborhood or community
and the burdens are not acknowledged in detail. FHWA recommends analyzing projects with
consideration of overall benefits and burdens, which is explored in this section. EJ analysis by NFRMPO
staff is currently conducted using limited information and does not fully leverage available tools.
EJ Plan | 15There is opportunity to collect more project-level EJ information during project solicitation and apply
existing tools such as the Regional Travel Demand Model (RTDM) and Multimodal Index (MMI) during EJ
analysis, and increase EJ TIP amendment process. Applications of these tools and other in-depth
methods for analysis are highlighted in Appendix A.
BENEFITS AND BURDENS
Table 1 shows example benefits and burdens for matter experts in these conversations. As stated
general transportation projects. Potential by the FHWA and FTA, “Benefits and burdens
burdens of a project may not be fully understood should be locally determined in collaboration
until preliminary design alignments and with the low-income and minority population in
concepts are being examined. It is crucial to any given community. There is no one-size-fits-
consult affected communities as well as all solution.”7
environmental, health, and social service subject
Table 1: Example Benefits and Burdens
Decrease in travel time
Improved air quality
Benefits Expanded employment opportunities
Better access to transit options and alternative modes of transportation
(walking and bicycling)
Improved safety for users
Bodily impairment, infirmity, illness, or death
Air, noise, and water pollution, and soil contamination
Destruction or disruption of man-made or natural resources, aesthetic
Burdens values, or availability of public and private facilities and services
Adverse impacts on community cohesion or economic vitality
Noise and vibration
Increased traffic congestion, isolation, exclusion, or separation
To better understand project impacts, Table 2 strategies are explored more and supported by
outlines common benefits and burdens of local, state, and national examples in Appendix
various types of projects, as well as possible A.
improvements or mitigation strategies. Table 2
Although the potential benefits, burdens, and
may serve as a supplement to impacts identified
improvement or mitigation strategies in Table 2
through outreach and studies. The suggested
can be helpful, the list is not exhaustive, and
7
https://www.transit.dot.gov/regulations-and-
guidance/environmental-programs/environmental-
justice/environmental-justice-faqs#ref28
16 | Analysis of Benefits and Burdensnothing substitutes for meaningful engagement • What are some unintended
of affected communities early and often with any consequences that could come from
transportation project. Internally implementing your project? How can your project be
a project-level assessment framework that leads modified to enhance positive impacts
with equity and inclusion can be a good way for and reduce negative impacts?
agencies to proactively identify and address • Who will disproportionately benefit or be
project elements that may impact historically burdened by the outcomes and results of
under-represented and under-resourced this project? Why/how?
community members. For example, the City of • How can you adapt to enhance positive
Fort Collins has chosen to use the “Just-In-Time” impacts and decrease negative impacts,
(JIT) Equity Assessment. The following questions especially to communities of color? Will
from the JIT framework are worth considering these adaptations create other
when a project is in its earliest stages, allowing unintended impacts?
adequate time for the project team to address
them:
Table 2: Potential Project-Specific Benefits, Burdens, and Mitigation Strategies
Improvement or
Project Type Potential Benefits Potential Burdens
Mitigation Strategies
Roadway
• Property acquisition
• Creates barrier within
• More connectivity, • Complete streets, including
or between
accessibility, and sidewalks, bicycle lanes,
neighborhoods
mobility crosswalks, and bus stops
• Increased reliance on
• Economic • Street trees for shade, noise
New Road automobiles
development walls, etc.
• Limited benefits to
• Reduced neighborhood • Right-size the road to the
those without cars or
traffic neighborhood and design
cannot drive
• Reduced travel times vehicle
• Air quality concerns
• Traffic noise
• Reduced travel times
(at least in short term) • Higher Speeds
• Possible addition of • Removal of street trees • Limited construction hours
bicycle lanes or • Increased pedestrian (daytime)
transit/business access crossing distance • Increased outreach and
lanes • Property acquisition construction updates
Roadway Expansion • Potential increased • Noise pollution from • Protected/leading bike/ped
separation of users increased traffic crossing interval
• Potential safety • Temporary • Enhanced multimodal
improvements construction noise or facilities on nearby parallel
(separation of users, traffic detours routes
break-down lanes, turn • Air quality issues
lanes, etc.)
EJ Plan | 17Improvement or
Project Type Potential Benefits Potential Burdens
Mitigation Strategies
• Promotes system
preservation
• Detours and diverted
• Reduced wear-and-tear • Increased outreach and
traffic
on autos and trucks construction updates in
• Limited connectivity
• Opportunity to add or affected area
Roadway Resurface • Noise pollution
enhance bike • Temporary traffic calming for
• May not address
infrastructure traffic diverted onto lower
neglected pedestrian
• Opportunity for road volume/lower speed roads
infrastructure
diet or redistribution of
roadway space
Public Transit
• Improved
• Better stop amenities,
connectivity/job
including shelters and
access
• Noise pollution signage
• Reduced auto traffic
• Lack of frequency, • Ensure sidewalk
and associated
long headways, connections to local
pollution
Fixed-Route Bus inconsistent schedule neighborhoods and
• Increased frequency
Service of buses
• Type of service destinations
(express buses serve • Make bus stops level with
• Extended hours
suburbs, higher bus boarding to help riders
• Benefits residents or
earners) with disabilities
visitors without
• Invest in electric buses and
vehicles or ability to
other transit vehicles
drive
• Reduced local service
due to high capital
• Faster service to key cost and competitive • Provide low-income
destinations routes subsidized passes
New rail or bus
• Higher capacity to • Cost for low-income • Ensure
rapid transit (BRT)
move more people passengers neighborhood/community
service • Economic • Property acquisition involvement during
development • Could raise property planning process
value, exacerbate
affordability issues
• Eligibility and
approval process
• Person’s mobility
related to availability
• Service to individuals
of door-to-door or
with disabilities • Centralized eligibility and
Demand Response door-through-door
• Enhanced approval
or Paratransit policies
accessibility to EJ • Partnerships with door-to-
Service • Cost for low-income
populations door services
passengers
• Increased mobility
• Dependency on driver
• Potential issues
booking ride,
availability of ride
18 | Analysis of Benefits and BurdensImprovement or
Project Type Potential Benefits Potential Burdens
Mitigation Strategies
Bicycle and Pedestrian
• May not have logical
terminus or may not
address crossing • Ensure sidewalks/paths
• More connectivity, issues if dependent on meet minimum ADA
New/Repaired accessibility, and developer/landowner Accessibility Guidelines
mobility to build (gaps or dead- (ADAAG)
Sidewalk or
• Increased safety ends) • Ensure other streetscape
Separated Path • Compliance with ADA • May be met with elements are accounted for
specifications opposition if existing as needed (shade, lighting,
sidewalks /paths signage, benches)
nearby have
unresolved issues
• Depending on design
• Bike lane design (buffered,
and available space,
• More connectivity, barrier-separated, etc.)
may not address
accessibility, and must be appropriate for
driver behavior and
mobility traffic volume and speeds
common crashes such
• Reduces “barrier to • Design approaching major
New Bike Lane as right hook
entry” for bicycling by intersections should create
• Sudden bike
creating dedicated continuity
infrastructure
space • Public outreach to identify
improvements in EJ
• Traffic reduction needs of specific
areas may be viewed
community
as gentrification
• Helps familiarize and
identify best routes • Devices should follow
• If improperly placed,
• Reduces “barrier to MUTCD standards
signs may clutter the
entry” by confirming • Legibility, size, simplicity,
right-of-way in denser
Wayfinding time, distance, and and placement must allow
areas or cause
direction for quick comprehension
unpredictable
• Provides cue to and adequate time for
decision-making
motorists to expect response
bikes
Other
• Usually have a safety • Usually focused on
Intelligent component reducing delay and • Get community invested to
Transportation • Can enhance mobility may induce vehicular identify problem areas
System (ITS) and accessibility travel • Communicate the benefits
Improvements • Reduced or • Not usually of ITS
redistributed traffic community-focused
• Allows on-demand • Requires technology • Create voucher program to
trips and internet to use reduce costs
• Rides can be shared • Often less available in • Work with ridesharing
Ridesharing with other people to all areas, especially in companies to ensure
reduce costs communities of color availability and/or
• Allows more spur-of- or low-income supplement transit service
the-moment trips communities in gap areas
EJ Plan | 19Improvement or
Project Type Potential Benefits Potential Burdens
Mitigation Strategies
• Reduced or • May compete with • Identify potential vehicles
redistributed traffic transit service to create accessible fleet for
• Potentially less • Not required to be ridesharing
parking needed at ADA-accessible
destination • Rides can be denied
• Can be more
expensive during busy
periods
• Vehicle availability
cannot be guaranteed
• Often focuses solely
on commuting trips to
a central location or
needs of higher
income users
• Perceived as non-
• Can reduce air quality inclusive by many
emissions communities of
• Can reduce individual concern • Work with communities and
Transportation transportation costs • Participation employers to identify
Demand • Focused on reducing sometimes dependent specific and appropriate
Management (TDM) congestion on gas prices TDM strategies
Strategies • Decreases vehicle • Costs may impact low- • Robust education and
dependence income populations outreach campaigns
• Reduced traffic and with higher parking or
parking needs congestion costs
• Dependent on
availability of
resources, which may
be lower in minority or
lower income
neighborhoods
20 | Analysis of Benefits and BurdensSection III / Demographic Analysis
DEMOGRAPHIC PROFILES
Larimer and Weld Counties are becoming increasingly diverse, though are still less than Colorado and
the US as a whole. Table 3 shows demographic information for Larimer County, Weld County, and the
NFRMPO, including population, race, Hispanic or Latinx origin, gender, and age based on the American
Community Survey (ACS) 2014-2018 5-Year Estimates. Figure 2 shows the distribution of EJ
populations by Census Block Groups, specifically areas with low income and/or minority residents at
higher percentages than the regional average. The data used to create this map is explained
throughout this section.
Table 3: Population and Demographics, 2014-2018
Larimer County (full) Weld County (full) NFRMPO
Population Percent Population Percent Population Percent
Total
338,161 100.0% 295,123 100.0% 510,621 100.0%
Population
Population by Race
American
Indian and 2,322 0.7% 2,032 0.7% 3,681 0.7%
Alaska Native
Asian 7,505 2.2% 4,327 1.5% 10,099 2.0%
Black or
African 3,275 1.0% 3,499 1.2% 6,066 1.2%
American
Native
Hawaiian and
309 0.1% 280 0.1% 498 0.1%
Other Pacific
Islander
Some other
4,949 1.5% 9,158 3.1% 11,177 2.2%
race
Two or more
21,064 6.2% 16,762 5.7% 30,510 6.0%
races
White alone 309,269 91.5% 267,514 90.6% 463,845 90.8%
Population by Hispanic or Latinx Origin
Persons of
Hispanic or 38,323 11.3% 86,322 29.3% 98,998 19.4%
Latinx Origin
EJ Plan | 21Larimer County (full) Weld County (full) NFRMPO
Population Percent Population Percent Population Percent
Persons Not
of Hispanic or 299,838 88.7% 208,801 70.8% 411,623 80.6%
Latinx Origin
Population by Gender
Male 168,615 49.9% 148,113 50.4% 254,771 49.9%
Female 169,546 50.1% 145,852 49.6% 255,850 50.1%
Population by Age
Persons
67,230 20.1% 78,590 26.6% 115,231 22.6%
0 – 17
Persons
199,938 59.1% 165,603 56.1% 298,761 58.5%
18 – 59
Persons
20,824 6.2% 16,626 5.6% 29,198 5.7%
60 – 64
Persons
49,587 14.7% 34,304 11.6% 67,431 13.2%
65+
22 | Additional ResourcesFigure 2: NFRMPO EJ Areas, 2018
EJ Plan | 23DEMOGRAPHIC CHANGES
Overall, Colorado has seen significant growth over the last decade. In the North Front Range region,
more than 30,000 new residents arrived between 2013 and 2017 alone. Table 3-1 shows the growth in
the region, specifically by race, Hispanic origin, gender, and age. Non-white Hispanic populations have
grown faster than the White population, with the largest percentage growth in Native American, Black,
and multiracial populations. Also worthy of note is the significant growth in the population over the
age of 65, followed by the growth in the population aged 60 to 64.
Regional Transportation Plan (RTP) Comparisons
Socioeconomic data is the basis for each of the NFRMPO’s RTPs. Table 4 shows the comparison
between the previous 2040 RTP and the current 2045 RTP for race, and Hispanic or Latinx origin. Table
5 shows the populations by gender and age. On the right is the absolute and percent change between
the two sets of data.
Table 4: Comparison of 2040 and 2045 RTP Race and Ethnicity Data
2040 RTP 2045 RTP
Change
2009-2013 ACS 2013-2017 ACS
Population Percent Population Percent Amount Percent
Total
452,987 100% 486,812 100% 33,825 7.5%
Population
Population by Race
American
Indian and 1,793 0.4% 2,223 0.5% 430 24.0%
Alaska Native
Asian alone 7,324 1.6% 8,685 1.8% 1,361 18.6%
Black or
African 4,183 0.9% 5,208 1.1% 1,025 24.5%
American
Native
Hawaiian and
314 0.1% 354 0.1% 40 12.7%
Other Pacific
Islander
Some other
944 0.2% 522 0.1% -422 -44.7%
race
Two or more
16,054 3.5% 19,120 3.9% 3,066 19.1%
races
White alone 345,304 76.2% 365,840 75.2% 20,536 6.0%
24 | Additional ResourcesYou can also read