ENVIRONMENTAL MONITORING PLAN FOR THE - OAK RIDGE RESERVATION Calendar Year 2022 UNITED STATES DEPARTMENT OF ENERGY
←
→
Page content transcription
If your browser does not render page correctly, please read the page content below
DOE-SC-OSO/RM-2022-01

ENVIRONMENTAL MONITORING PLAN
 FOR THE
 OAK RIDGE RESERVATION
 Calendar Year 2022

UNITED STATES DEPARTMENT OF ENERGY

 Issue Date: December 2021
The controlled Environmental Monitoring Plan for the Oak Ridge Reservation CY 2022, United States
Department of Energy Oak Ridge, Tennessee. DOE-SC-OSO/RM-2022-01, is available at
https://doeic.science.energy.gov/ASER/.

If you have comments or questions regarding this plan, please contact Scott Gregory, Oak Ridge National
Laboratory, at (865) 241-3730, email: gregorysm@ornl.gov, or Katatra Vasquez, Office of Science
Consolidated Services Center, US Department of Energy, at (865) 576-0835, email:
Katatra.Vasquez@science.doe.gov.

 DISCLAIMER
 This report was prepared as an account of work sponsored by an agency of the United States
 Government. Neither the United States; UT-Battelle, LLC; UCOR; CNS LLC; nor any agency
 thereof, nor any of their employees, makes any warranty, express or implied, or assumes any legal
 liability or responsibility for the accuracy, completeness, or usefulness of any information,
 apparatus, product, or process disclosed, or represents that its use would not infringe privately
 owned rights. Reference herein to any specific commercial product, process, or service by trade
 name, trademark, manufacturer, or otherwise, does not necessarily constitute or imply its
 endorsement, recommendation, or favoring by the United States Government or any agency thereof.
 The views and opinions of authors expressed herein do not necessarily state or reflect those of the
 United States Government or any agency thereof. The sampling and monitoring programs described
 herein are not comprehensive of all sampling and monitoring performed on the Oak Ridge
 Reservation.
DOE-SC-OSO/RM-2022-01

Environmental Monitoring Plan for the
 Oak Ridge Reservation
 Calendar Year 2022

 United States Department of Energy

 Prepared by
 OAK RIDGE NATIONAL LABORATORY
 Oak Ridge, TN 37831-6283
 managed by
 UT-BATTELLE LLC
 for the
 US DEPARTMENT OF ENERGY
 under contract DE-AC05-00OR22725

CONTENTS

 Page

FIGURES .................................................................................................................................................. iii
TABLES .................................................................................................................................................... iii
ACRONYMS............................................................................................................................................. iv
UNITS OF MEASURE AND CONVERSION FACTORS ....................................................................... vi
1. INTRODUCTION ........................................................................................................................... 1-1
 1.1 PURPOSE AND SCOPE ....................................................................................................... 1-1
 1.2 ADMINISTRATION AND OVERSIGHT ............................................................................ 1-1
 1.3 OAK RIDGE RESERVATION BACKGROUND INFORMATION .................................... 1-2
2. SITE CHARACTERISTICS ............................................................................................................ 2-2
3. OAK RIDGE RESERVATION METEOROLOGICAL MONITORING ........................................ 3-1
 3.1 INTRODUCTION ................................................................................................................. 3-1
 3.2 METEROLOGICAL SYSTEM DESCRIPTION .................................................................. 3-1
 3.3 METEROLOGICAL DATA COLLECTION AND REPORTING ....................................... 3-2
 3.4 METEROLOGICAL MONITORING QUALITY ASSURANCE ........................................ 3-2
4. ENVIRONMENTAL PATHWAYS AND DOSE CALCULATIONS ............................................ 4-1
 4.1 INTRODUCTION ................................................................................................................. 4-1
 4.2 CONFORMANCE WITH STANDARDS FOR PUBLIC DOSE CALCULATIONS ........... 4-1
 4.3 ENVIRONMENTAL PATHWAY AND TRANSPORT MODELS...................................... 4-1
 Atmospheric Transport and Pathway Analysis.......................................................... 4-2
 Surface Water Transport and Pathway Analysis ....................................................... 4-4
 4.4 RADIONUCLIDES IN OBJECTS ........................................................................................ 4-5
 4.5 RADIATION DOSE TO NATIVE AQUATIC AND TERRESTRIAL ORGANISMS ........ 4-5
 4.6 DOSE ASSESSMENT QUALITY ASSURANCE................................................................ 4-6
5. OAK RIDGE RESERVATION ENVIRONMENTAL SURVEILLANCE...................................... 5-1
 5.1 AMBIENT AIR ..................................................................................................................... 5-1
 Purpose and Scope .................................................................................................... 5-1
 Sampling Locations .................................................................................................. 5-1
 Parameters and Methods ........................................................................................... 5-1
 5.2 EXTERNAL GAMMA RADIATION ................................................................................... 5-3
 Purpose and Scope .................................................................................................... 5-3
 Sampling Locations and Methodology...................................................................... 5-3
 5.3 SURFACE WATER .............................................................................................................. 5-3

 i
Purpose and Scope .................................................................................................... 5-3
 Sampling Locations .................................................................................................. 5-4
 Parameters and Methods ........................................................................................... 5-4
 5.4 VEGETATION AND MILK ................................................................................................. 5-5
 Vegetables................................................................................................................. 5-5
 Milk .......................................................................................................................... 5-6
 Hay ........................................................................................................................... 5-7
 5.5 WILDLIFE MONITORING .................................................................................................. 5-7
 Deer Hunts ................................................................................................................ 5-7
 Turkey Hunts ............................................................................................................ 5-8
 Goose Roundup......................................................................................................... 5-8
 Fish ........................................................................................................................... 5-8
 5.6 ADDITIONAL MONITORING .......................................................................................... 5-10
 Aquatic Biota Sampling Strategy ............................................................................ 5-10
 Terrestrial Biota ...................................................................................................... 5-11
 5.7 ENVIRONMENTAL SAMPLING AND DATA EVALUATION QUALITY
 ASSURANCE ..................................................................................................................... 5-12
 Introduction............................................................................................................. 5-12
 Work/Project Planning and Control ........................................................................ 5-12
 Personnel Training and Qualifications .................................................................... 5-12
 Equipment and Instrumentation .............................................................................. 5-13
 Visual Inspection, Housekeeping, and Grounds Maintenance................................. 5-13
 Assessment ............................................................................................................. 5-13
 Analytical Quality Assurance ................................................................................. 5-14
 Data Management and Reporting............................................................................ 5-14
 Records Management.............................................................................................. 5-15
6. REFERENCES ................................................................................................................................ 6-1

 ii
FIGURES

 Page

Fig. 2.1. Location of the Oak Ridge Reservation. .............................................................................................2-3
Fig. 2.2. Oak Ridge Reservation. .......................................................................................................................2-4
Fig. 3.1. Oak Ridge Reservation meteorological tower (MT) and sonic detection and ranging
 (SODAR) device locations. ..................................................................................................................3-1
Fig. 5.1. Oak Ridge Reservation perimeter ambient air monitoring stations. ..................................................5-2
Fig. 5.2. Oak Ridge Reservation external gamma radiation monitoring locations..........................................5-3
Fig. 5.3. Oak Ridge Reservation surface water surveillance sampling locations. ...........................................5-4
Fig. 5.4. Oak Ridge Reservation fish sampling locations. ................................................................................5-9

 TABLES

 Page

Table 4.1. Environmental Transport Mechanisms Applicable to Releases from the
 Oak Ridge Reservation .........................................................................................................................4-2
Table 5.1. Ambient Air Parameters Analytical Methods, and Requested Minimum Detectable
 Activies ..................................................................................................................................................5-2
Table 5.2 Surface Water Locations, Routine Parameters, Methods, and Requested Report
 Levels/Minimum Detectable Activities…………………………………………………………5-5

Table 5.3. Vegetable Parameters, Analytical Methods, and Requested Minimum Detectable
 Activities ................................................................................................................................................5-6
Table 5.4. Milk Parameters, Analytical Methods, and Requested Minimum Detectable Activities ..............5-7
Table 5.5. Hay Parameters, Analytical Methods, and Requested Minimum Detectable Activities ...............5-7
Table 5.6. Fish Routine Parameters for all Locations, Methods, and Requested Report
 Levels/Minimum Detectable Activities ............................................................................................ 5-10

 iii
ACRONYMS

ASER Annual Site Environmental Report

CAP-88 PC Clean Air Act Assessment Package – 1988 (software)
CERCLA Comprehensive Environmental Response, Compensation, and Liability Act
CES Computational Earth Sciences
CNS Consolidated Nuclear Security, LLC
CRK Clinch River kilometer

DOE US Department of Energy

ED effective dose
EMP environmental monitoring plan
EPA US Environmental Protection Agency
EPSD Environmental Protection Services Division
ESS Environmental Sampling System
ETTP East Tennessee Technology Park

F&O/I&C Facilities and Operations/Instrumentation and Controls group

ITSD Information Technology Services Division

MET meteorological

NRC US Nuclear Regulatory Commission

OREM Oak Ridge Office of Environmental Management (Department of Energy)
ORNL Oak Ridge National Laboratory
ORR Oak Ridge Reservation

PSS plant shift superintendent

QA quality assurance
QC quality control

 iv
ACRONYMS (continued)

Rad NESHAPs National Emission Standards for Hazardous Air Pollutants for Radionuclides

SBMS Standards-Based Management System
SOP standard operating procedure

Y-12 Y-12 National Security Complex

 v
UNITS OF MEASURE AND CONVERSION FACTORS

 Units of measure and their abbreviations
 curie Ci milligram mg
 gram g millirem mrem
 hectare ha millisievert mSv
 kilogram kg nanocurie nCi
 kilometer km picocurie pCi
 liter L rad rad
 microcurie µCi sievert Sv
 microgram µg

 Quantitative prefixes
 pico × 10–12 micro × 10–6
 nano × 10–9 milli × 10–3

 Unit conversions
 Unit Conversion Equivalent Unit Conversion Equivalent
 Length
mile × 1.61 km km × 0.621 mile
 Area
acre × 0.405 ha ha × 2.47 acre
 Volume
qt (US liquid) × 0.946 L L × 1.057 qt (US liquid)
gal (US liquid) × 3.785 L L × 0.264 gal (US liquid)
 Activity and Dose
Bq × 2.7 × 10 −11 Ci Ci × 3.7 × 10¹⁰ Bq
Bq × 27 pCi pCi × 0.037 Bq
mSv × 100 mrem mrem × 0.01 mSv
Sv × 100 rem rem × 0.01 Sv

 vi
1. INTRODUCTION
1.1 PURPOSE AND SCOPE

Oak Ridge Reservation (ORR) environmental surveillance is conducted to comply with Department of
Energy (DOE) requirements to protect the public and the environment against undue risks associated with
activities carried out by DOE. These requirements are established in DOE O 458.1 (DOE 2020),
Radiation Protection of the Public and the Environment, and related guidance is provided in DOE-
HDBK-1216-2015 (DOE 2015), Radiological Environmental Effluent Monitoring and Environmental
Surveillance. The objective of the ORR environmental surveillance program is to characterize
environmental conditions in areas both on and off the reservation, that could be impacted by DOE
operations and to estimate the resulting public doses. Data from the ORR environmental surveillance
program are also used to confirm public dose estimates based on effluent monitoring results, and, where
appropriate, provide supplemental data to support compliance monitoring required by environmental laws
and regulations. In accordance with DOE Order 231.1B (DOE 2012), Environment, Safety and Health
Reporting, results from the ORR environmental surveillance program are made available to the public via
the Oak Ridge Reservation Annual Site Environmental Report (DOE 2021).

This environmental monitoring plan (EMP) documents the rationale, frequency, parameters, and
analytical methods for the ORR environmental surveillance program and provides information on site
characteristics, meteorological monitoring, environmental pathways, dose assessment methods, and
quality management. ORR-wide monitoring activities cover a variety of media including air, surface
water, vegetation, biota, and wildlife. Site-specific effluent, groundwater, and best management
monitoring programs at the Oak Ridge National Laboratory (ORNL), Y-12 National Security Complex
(Y-12), and East Tennessee Technology Park (ETTP) along with monitoring conducted for the DOE Oak
Ridge Office of Environmental Management (OREM) are not within the scope of this EMP. In addition,
environmental monitoring and surveillance programs conducted in support of privately owned facilities
which were previously part of the ORR are also outside of the scope of this EMP. These privately held
properties include commercial businesses, City of Oak Ridge facilities and utilities, property that has been
turned over to the Community Reuse Organization of East Tennessee for future commercial development
at ETTP, and the Oak Ridge Science and Technology Park, a private business park at ORNL, managed by
the Community Reuse Organization of East Tennessee.

1.2 ADMINISTRATION AND OVERSIGHT

The ORR EMP is reviewed, and as needed, updated annually by a task team representing the DOE Office
of Science Consolidated Services Center; the ETTP, ORNL and Y-12 DOE Site Offices; and
management, operating, and support contractors from each of the three major ORR facilities.

UT-Battelle, LLC’s Environmental Protection Service’s Division (EPSD) is responsible for the
management and administration of the ORR environmental surveillance program. Program oversight,
sampling, data management, and reporting are carried out by EPSD’s Environmental Sampling and Data
Evaluation (ESDE) Team. Several other groups and organizations, discussed in applicable sections of this
plan, provide specific programmatic support for ORR environmental surveillance. In order to assure the
citizens of Tennessee that DOE’s activities on the ORR are performed in a manner that is protective of
their health, safety, and environment, the State of Tennessee and DOE have entered into the Oak Ridge
Environmental Surveillance Agreement. Through this voluntary agreement, the Tennessee Department of
Environment and Conservation conducts environmental surveillance oversight of activities related to the
ORR EMP including independent evaluation of results.

 1-1
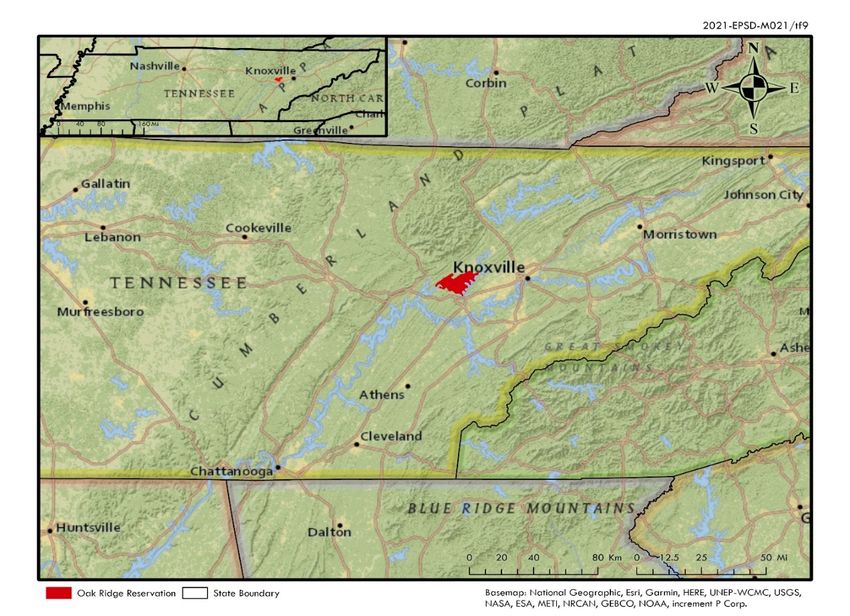
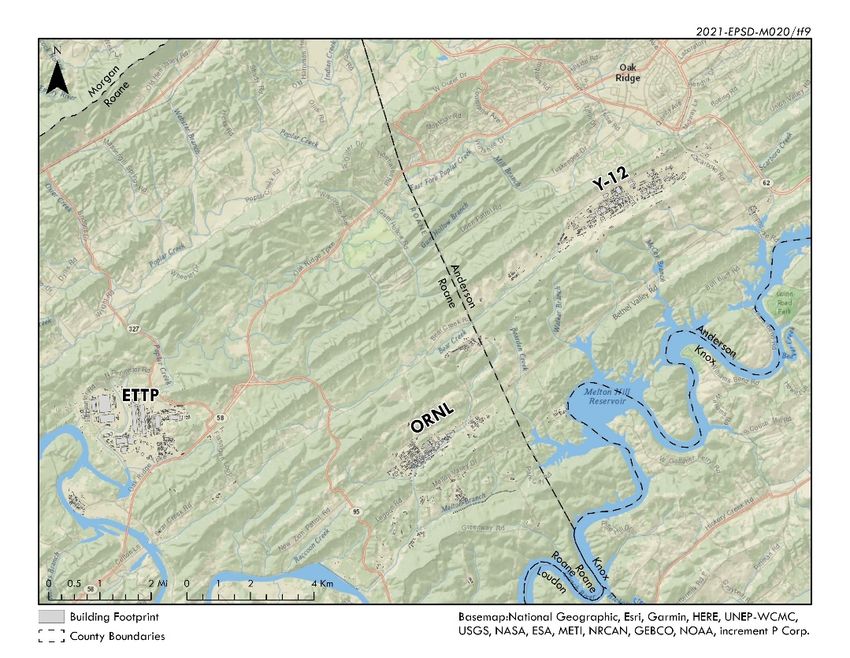
1.3 OAK RIDGE RESERVATION BACKGROUND INFORMATION

The ORR is managed by DOE and contains three major operating sites: ETTP, ORNL, and Y-12.
Facilities at these sites were constructed as part of the Manhattan Project. Their primary missions have
evolved over the years and continue to adapt to meet the changing research, defense, and environmental
restoration needs of the United States.

Consolidated Nuclear Security, LLC (CNS), is the DOE prime contractor responsible for operating Y-12,
a manufacturing facility that continues to play an integral role in the nation’s nuclear weapons complex.
The Y-12 site is undergoing significant modernization. Key considerations of the modernization strategy
include incorporating sustainable environmental stewardship in planning, design, and construction;
maintaining compliance with regulatory requirements; and coordinating modernization activities with
Comprehensive Environmental Response, Compensation, and Liability Act (CERCLA) remediation goals
and activities.

UT-Battelle, LLC, is the DOE prime contractor responsible for operations at ORNL, DOE’s largest
science and energy research laboratory. ORNL is an international leader in a range of scientific areas that
support the DOE mission. Major mission roles are neutron science, energy, high-performance computing,
systems biology, materials science, and national security.

UCOR is the DOE OREM prime contractor responsible for operations at ETTP. The mission at ETTP is
environmental cleanup and reindustrialization/reuse of the assets of the former gaseous diffusion plant. In
addition, UCOR is responsible for waste management activities at the Environmental Management Waste
Management Facility, Y-12 sanitary landfills, and ORNL with a work scope that includes liquid treatment
facilities and Resource Conservation and Recovery Act permitted units. UCOR also conducts CERCLA
facility surveillance and maintenance and CERCLA project actions at the ORNL and Y-12 sites.

DOE facilities on the ORR that are not contractual responsibilities of UT-Battelle, CNS, or UCOR
include:

 • Oak Ridge Institute for Science and Education
 • The National Nuclear Security Administration Office of Secure Transportation, Agent
 Operations Eastern Command: Secure Transportation Center and Training Facility
 • Transuranic Waste Processing Center
 • Building 2026 at ORNL
 • Building 3019 complex at ORNL

2. SITE CHARACTERISTICS
The ORR lies within the Great Valley of East Tennessee between the Cumberland and Great Smoky
Mountains and is bordered by the Clinch River (Fig. 2.1). The Cumberland Mountains are 16 km
(10 miles) to the northwest; the Great Smoky Mountains are 51 km (31.6 miles) to the southeast.

 2-2
Fig. 2.1. Location of the Oak Ridge Reservation.

The ORR encompasses approximately 13299 ha (32,863 acres) of mostly contiguous land owned by the
federal government and under the management of DOE in Anderson and Roane Counties (Fig. 2.2). The
population of the 10-county region surrounding the ORR (Anderson, Blount, Campbell, Cumberland,
Knox, Loudon, McMinn, Monroe, Morgan, and Roane) is approximately 1,010,000 (Census Bureau.
2019). Municipalities within 40 km (~25 miles) of the reservation include Oliver Springs, Clinton, Rocky
Top, Lenoir City, Farragut, Kingston, Knoxville, and Harriman.

Knoxville, the major metropolitan area nearest Oak Ridge, is located about 40 km (25 miles) to the east
and had a population of approximately 187,603 at the time of the 2019 census (Census Bureau. 2019).
Except for the city of Oak Ridge, the land within 8 km (5 miles) of the ORR is semirural and is used
primarily for residences and small farms (primarily cattle, hay, and pasture). Fishing, hunting, boating,
water skiing, and swimming are popular recreational activities in the area.

The topography, geology, hydrology, vegetation, and wildlife of the ORR provide a complex and intricate
array of resources. Detailed information regarding the natural resources and physical characteristics of the
ORR is available in ORR Physical Characteristics and Natural Resources (Parr and Hughes 2006).

 2-3
Fig. 2.2. Oak Ridge Reservation.

 2-4
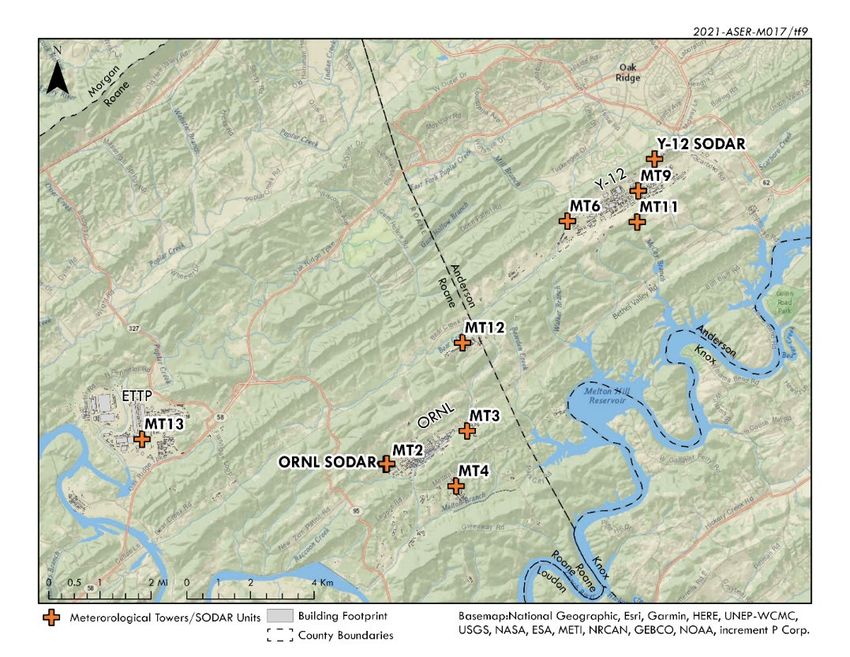
3. OAK RIDGE RESERVATION METEOROLOGICAL MONITORING
3.1 INTRODUCTION

Meteorological (MET) monitoring on the ORR is conducted by UT-Battelle’s Computational Earth
Sciences (CES) Group and supports the ORR environmental monitoring program as well as site specific
monitoring programs at ETTP, ORNL, and Y-12. Dispersion models developed by CES estimate and
predict downwind concentrations of air pollutants emitted from sources on the ORR and are used to
determine monitoring locations that are representative of areas where members of the public could be
exposed to worst case concentrations of these pollutants. ORR MET monitoring, which fulfills
Environmental Protection Agency (EPA) and DOE requirements, also provides (1) environmental data to
assist in emergency response and plume modeling, (2) real-time access to data, and (3) notification of
severe weather conditions.

3.2 METEROLOGICAL SYSTEM DESCRIPTION

MET monitoring on the ORR includes 8 towers across the reservation (Fig. 3.1). In this document, the
individual ORR managed towers are designated by “MT” followed by a numeral. MT2 (ORNL 1000
area), MT3 (ORNL 6500 area), MT4 (ORNL High Flux Isotope Reactor), and MT12 (Spallation Neutron
Source water tank), are operated by UT-Battelle. CNS operates Towers, MT6 (West), MT9 (Plant Shift
Superintendent Tower, MT11 (South Ridge) and MT13 (Y-12 Emergency Operations Center at ETTP).
Towers MT3, MT6, and MT9 have measuring capabilities at multiple vertical levels. Siting for most of
the towers was based on a screening analysis conducted in the 1980s in collaboration with EPA guidance
and/or DOE consultation.

 Fig. 3.1. Oak Ridge Reservation meteorological tower (MT) and sonic detection and
 ranging (SODAR) device locations.

 3-1
3.3 METEROLOGICAL DATA COLLECTION AND REPORTING

ORR MET data are collected continuously and 1-, 15-, and 60-minute data averages are calculated. MET
data include temperature, dew point, relative and absolute humidity, vapor pressure, mixing ratio,
precipitation, wind direction and speed, vertical wind speed, wind direction standard deviation, 1- and
10-second peak wind speed, air pressure, solar radiation, soil temperature, and stability.

Sonic detection and ranging SODAR devices at ORNL and Y-12 measure winds and turbulence at
altitudes less than the typical daytime maximum boundary layer height. A light detection and ranging
instrument co-located with Ambient Air Station 35 provides wind and turbulence data. A ceilometer is
located adjacent to MT2 to provide boundary layer height data during the daytime, and to measure mixing
height, cloud height, and other weather phenomena such as rain and fog. Additional data, which serves as
backup to SODAR and ceilometer data, are collected via a subscription service from the European Center
for Medium-Range Weather Forecasts and National Oceanic and Atmospheric Administration High-
Resolution Rapid Refresh weather models.

In accordance with EPA guidance, data are made available to the public at least daily at
http://metweb.ornl.gov//index.htm.

3.4 METEROLOGICAL MONITORING QUALITY ASSURANCE

CES integrates quality principles and methodologies into work planning and control processes in
accordance with the ORNL Quality Assurance Plan to ensure work is completed safely and data are of a
known and defensible quality. Detailed information on MET Quality Assurance (QA)/Quality Control
(QC) programs is available from CES. Elements of these programs that ensure representative MET data is
used in environmental calculations and dose modeling include:

 • routine quality checks on hourly data
 • data validation and periodic comparisons to background readings
 • quarterly or semiannual instrument calibrations traceable to National Institute of Standards
 and Technology standards
 • daily monitoring of towers and SODAR devices
 • biannual tower truing and tensioning at MT 3 and MT4 (MT 2, MT12, MT6 and MT9 are
 guy-less)
 • biannual inspection of tower anchor connections

 3-2
ENVIRONMENTAL MONITORING PLAN FOR THE OAK RIDGE RESERVATION

4. ENVIRONMENTAL PATHWAYS AND DOSE CALCULATIONS
4.1 INTRODUCTION

Operations at the three ORR facilities may result in emissions of airborne and waterborne radionuclides
and chemicals. Once released, these substances migrate through the environment by applicable transport
mechanisms, and some may reach and affect humans and biota. This section describes the methods used
by dose assessment staff in EPSD’s Air/RCRA and Transportation Group to characterize dispersion of
released radionuclides and to estimate human exposures to and intakes of the dispersed substances.
Human exposures to radionuclides are quantified in terms of effective dose 1 (ED) to maximally exposed
on-site and/or off-site members of the public and the entire population residing within 80 km (50 miles)
of the ORR. Impacts to terrestrial and aquatic biota are also evaluated. Regulatory standards and facility-
specific permits for chemical releases to the environment typically specify release concentration criteria
and limits and do not require dose or risk estimates. Therefore, only exposures from drinking water and
consuming fish, characterized by hazard quotients for noncarcinogenic chemicals and risk estimates for
carcinogenic chemicals, are evaluated.

4.2 CONFORMANCE WITH STANDARDS FOR PUBLIC DOSE CALCULATIONS

Dose calculations are performed to demonstrate compliance with EPA’s National Emission Standards for
Hazardous Air Pollutants: Standards for Radionuclides (Rad NESHAPs) (40 CFR 61, Subpart H) and
DOE O 458.1 (DOE 2020). A clean air assessment package model or other approved procedures are used
to calculate doses to members of the public. The EPA Rad NESHAPs standard limits the annual ED to a
member of the public from radionuclides released in the air from DOE facilities to 10 mrem (0.1 mSv).

DOE O 458.1 states that DOE radiological activities will not cause a total ED exceeding 100 mrem
(1 mSv) in a year, an equivalent dose to the lens of the eye exceeding 1,500 mrem (15 mSv) in a year, or
an equivalent dose to the skin or extremities exceeding 5,000 mrem (50 mSv) in a year from all sources of
ionizing radiation and exposure pathways that could contribute significantly to the total dose.

DOE O 458.1 also states that models for dose evaluation calculations must be appropriate for their
purpose, and dose evaluation models that are codified or approved for use by regulators of DOE or by
DOE must be used where applicable.

4.3 ENVIRONMENTAL PATHWAY AND TRANSPORT MODELS

Members of the public have the potential to receive doses from internal and external exposures to
radiological materials released to the atmosphere, ground and surface waters, soils and sediment, and
cleared property. In addition, some members of the public may receive external radiation doses through
direct external irradiation and radiation emanating from buildings and other objects (e.g., drum storage
and burial areas) located within facility and ORR boundaries.

 1
 Effective dose (ED), defined as = ∑ , is the sum of the equivalent dose received by specific organs
or tissues ( ) multiplied by the tissue weighting factor ( ) for the organ or tissue. The time integral of the
effective dose rate is known as the committed effective dose. Total ED includes the committed effective dose from
internal intakes as well as the effective dose from external exposures. In this document ‘dose’ is used synonymously
with ED. The unit of effective dose is rem or sievert (Sv).

 4-1
ENVIRONMENTAL MONITORING PLAN FOR THE OAK RIDGE RESERVATION

Table 4.1 lists environmental release and transport mechanisms that may apply to emissions from the
ORR. These are not all evaluated as some may have limited impact compared to more dominant transport
mechanisms. Models and computer codes for evaluating public exposures to released radionuclides will
be selected based on regulatory requirements, the applicability of the model to a specific situation, the
degree to which the model has been documented and verified, and the availability of the data needed to
implement the model. Unless otherwise required by regulatory or legal mandates, the simplest model
needed to characterize a situation will be used. Input data to the models will be either site-specific (e.g.,
collected via the environmental monitoring and surveillance activities described in this EMP), specific to
national or regional data [e.g., national food consumption survey (EPA 2011), regional recreational data
(UT 2017), etc.], or generic (default values). In the absence of nuclide-specific data, bounding dose
calculations will be made.

 Table 4.1. Environmental Transport Mechanisms Applicable
 to Releases from the Oak Ridge Reservation

 Releases to air Remain suspended in air
 Deposit on ground
 Deposit on vegetation
 Deposit on water surfaces
 Releases to surface water Remain dissolved or suspended in water
 Deposit in sediments
 Infiltrate to groundwater
 Releases to groundwater Remain dissolved or suspended in water
 Flow into surface water
 Radionuclides in objects Remain in fixed sources
 Releases to ground surfaces Remain on ground
 Dissolve or suspend in surface water
 Infiltrate to groundwater
 Become suspended in air

 Atmospheric Transport and Pathway Analysis

Contaminants released into the atmosphere may remain suspended in the air and may deposit on soil,
vegetation, and water surfaces (Table 4.1). Atmospheric transport models are used to calculate annual
average ground-level airborne concentrations of contaminants and associated rates of deposition on the
ground and vegetation.

To demonstrate compliance with Rad NESHAPs (40 CFR 61.93[a]) and DOE O 458.1 (DOE 2020), the
Clean Air Assessment Package (CAP-88 PC) computer software (EPA 2015) is used to calculate doses to
members of the public from ORR radionuclide airborne emissions. CAP-88 PC includes some limiting
criteria and assumptions (e.g., flat terrain is assumed and it is recommended for use when receptors are
greater than 100 m from the source).

CAP-88 PC calculates annual average ground-level air concentrations and deposition rates at selected
environmental locations to allow identification of the maximally exposed individual for each source, each
facility, and the entire ORR. Dose estimates for the population within 80 km (50 miles) of the ORR are
also calculated.

When possible, site-specific parameter values are used to quantify radionuclide releases (e.g., release
rates, particle size in terms of activity median aerodynamic diameter and chemical composition),

 4-2
ENVIRONMENTAL MONITORING PLAN FOR THE OAK RIDGE RESERVATION

meteorological variables (e.g., wind speed and direction, atmospheric stability class, air temperature,
rainfall rate, and mixing layer height), and source parameters (e.g., release height, stack diameter, exit gas
velocity and temperature, and location with respect to exposed persons). These parameters are obtained
from data collected for environmental monitoring and surveillance programs conducted on the ORR. An
activity median aerodynamic diameter of 1.0 μm will be used unless otherwise requested. If lung
absorption type data are not provided, the CAP-88 PC default lung absorption types are used. The dose
estimates are applicable only to low-level chronic exposures because the health effects, and dosimetric
data are based on low-level chronic intakes. If data on radionuclides identified through either sample
analysis or laboratory usage inventory are not available in CAP-88 PC, EPA Region 4 must approve the
use of surrogate radionuclides. The ED for business receptors, both on and off the site, is typically
calculated with the method used for the residential exposure scenario (i.e., assuming full occupancy
[8,760 hours/year] and the Rural Food Source Scenario in CAP-88 PC) and then dividing the resulting
dose in half. However, there may be cases where the method of evaluation for business receptors may be
revised to account for more site-specific parameters.

Doses calculated from data collected at ambient air monitoring stations on the ORR are compared to
doses calculated by CAP-88 PC to confirm that the atmospheric dispersion codes are not significantly
underestimating airborne concentrations of radionuclides around the ORR. There may be cases when
calculations using ambient air monitoring data result in higher doses because the CAP-88 PC model is
used primarily to estimate doses from point source emissions and may not include the impacts of fugitive
emissions from demolition or construction activities.

4.3.1.1 Inhalation and Immersion Pathway

CAP-88 PC (EPA 2015) is used to calculate EDs from inhalation of and immersion in air containing
radionuclides. The inhaled quantities and air concentrations are combined with inhalation and immersion
dose coefficients to calculate inhalation and immersion doses, respectively, to an individual at selected
locations. Inhalation dose coefficients are chosen based on particle size and lung absorption type. In the
absence of actual data, a 1.0 µm particle size and default lung absorption type for inhalation are assumed.
CAP-88 PC also calculates the collective ED from inhalation and immersion to the population residing
within 80 km (50 miles) of the ORR.

4.3.1.2 Ingestion Pathway—Vegetables, Meat, and Milk

Contaminants may reach vegetation (food and feed crops) by deposition of airborne materials, uptake
from soil, and deposition of materials contained in irrigation water. The significant potential direct
pathway for human exposure to contaminants in food crops is ingestion. Indirect pathways involve
ingestion of contaminated feed crops by terrestrial animals that are later ingested by humans.

CAP-88 PC (EPA 2015) uses the US Nuclear Regulatory Commission (NRC) Regulatory Guide 1.109
food chain accumulation model (NRC 1977) to estimate concentrations of radionuclides in beef,
vegetables, and milk due to consumption of feed contaminated with radionuclides released to the
atmosphere. National Council on Radiation Protection and Measurements transfer factors (NCRP 1996)
and EPA intake rates (EPA 2011) are used to estimate the human intake values of milk and beef and
associated radionuclides. The code assumes that radionuclide deposition has occurred for 100 years. The
radionuclide intakes are combined with dose coefficients for ingestion to calculate EDs to an individual
residing at each location and the population within 80 km (50 miles) of the ORR.

The ORR environmental surveillance program includes sampling of radionuclides in selected food crops
and in milk if dairies and gardens in potential impact areas are located. These sampling data and the
intake models described above will be used to provide additional estimates of doses from ingestion of

 4-3
ENVIRONMENTAL MONITORING PLAN FOR THE OAK RIDGE RESERVATION

locally grown foods. Effective doses from the ingestion of selected food crops and milk, if sampled, are
estimated using population-weighted ingestion rates and reference person dose coefficients from the DOE
Derived Concentration Technical Standard, DOE-STD-1196-2021 (DOE 2021). The population-weighted
ingestion rates are based on a nationwide food consumption survey of a hypothetical home gardener or
milk consumer and are age-weighted based on the populations of Anderson, Knox, Loudon, and Roane
Counties. Potential doses from ingesting deer, turkey, and waterfowl (e.g., geese) harvested from the
reservation are also calculated.

4.3.1.3 External Radiation Pathway—Ground Deposition

Contaminants may reach soil by deposition of airborne materials, deposition of materials contained
in irrigation water, and direct ground deposition. Potential direct pathways of human exposure to
contaminants in soil include inhalation of resuspended soil, ingestion of soil, and direct exposure to
(being near or in contact with) the soil. Indirect pathways involve uptake of contaminants from soil
by crops.

The resuspension of soil and soil ingestion pathways are not evaluated because their potential
consequences are considered less significant relative to those from inhalation of newly emitted
contaminants and ingestion of foodstuffs. CAP-88 PC (EPA 2015) is used to calculate EDs due to direct
irradiation by radionuclides on soil and assumes that deposition has occurred for 100 years and that a
person remained unprotected at a location for an entire year. Ground concentrations and exposure times
are combined with the dose coefficients for exposure to a contaminated ground surface to calculate EDs
to an individual at selected locations. CAP-88 PC is also used to calculate the collective ED to the
population residing within 80 km (50 miles) of the ORR from exposure to contaminated ground surfaces.
Effective doses are also calculated based on measured radiation exposure data collected at ORR ambient
air stations and at a reference location.

 Surface Water Transport and Pathway Analysis

Two techniques based on methodology and equations from LADTAP XL (Hamby 1991), with
modifications applicable to the ORR, are used to calculate individual and population doses for waterborne
exposure pathways. The first uses radionuclide concentrations determined by laboratory analyses of water
and fish samples. The second calculates possible radionuclide concentrations in water and fish from
measured radionuclide discharges and known or estimated water flows. Both methods are used to
estimate radionuclide concentrations in media and locations that are not sampled in conjunction with
ORR environmental monitoring programs (e.g., downstream). Doses from groundwater ingestion are not
estimated because groundwater from nearby off-site wells is not consumed. OREM conducts off-site
groundwater monitoring west of the Clinch River according to a groundwater sampling strategy
developed by OREM, EPA, and Tennessee Department of Environment and Conservation.

4.3.2.1 Ingestion, Immersion, and External Radiation Pathway

Potential pathways of direct human exposure to contaminants in surface waters include drinking water,
eating fish, immersion (swimming, wading, showering), boating, skiing, using the shoreline, and inhaling
water (breathing water vapor while showering). Indirect pathways involve deposition on soil and crops by
irrigation, deposition in sediments, and uptake by fish consumed by terrestrial animals.

The direct pathways for human exposure to contaminants from surface waters on or near the ORR that are
evaluated for dose estimates include drinking water, swimming, boating, and using the shoreline. Doses
associated with irrigation are also evaluated. NRC Regulatory Guide 1.109 (NRC 1977) equations are
used to estimate radiation doses due to immersion in and direct irradiation from surface water. Measured

 4-4
ENVIRONMENTAL MONITORING PLAN FOR THE OAK RIDGE RESERVATION

results from samples collected at discharge points and in surface water and calculated radionuclide
concentrations are used in equations from LADTAP XL (Hamby 1991) or an equivalent methodology to
estimate doses. The most recently published drinking water and creel survey data associated with the
Clinch–Tennessee River system are used to quantify drinking water populations and fish harvests. Data
on the population served from community water treatment systems located on the Clinch–Tennessee
River system near and downstream of the ORR are obtained annually from the
Tennessee Department of Environment and Conservation Division of Water Supply. Creel data are
obtained from Tennessee Statewide Creel Survey Results (TWRA 2020), and provide information used to
estimate the number of persons consuming fish from these water bodies.

EDs for radionuclides in drinking water are calculated using samples collected in the Clinch River close
to intakes at drinking water plants near ORR; water plant outputs are not sampled. EDs from the ingestion
of water and fish are estimated using population-weighted ingestion rates and Per Capita dose coefficients
from the latest approved version of the DOE Derived Concentration Technical Standard, DOE-STD-1196
-2021 (DOE 2021). Dose coefficients for water immersion and shoreline use are from EPA-402/R18/001,
Federal Guidance Report 15, External Exposure to Radionuclides in Air, Water, and Soil (EPA 2019).
Population dose estimates are made for the population within 80 km (50 miles) of the ORR.

There are no known farmers or gardeners using irrigation sources that could be impacted by ORR
activities. However, doses from irrigating food and feed crops are estimated at a location downstream
of ORNL using the methodology and equations from NRC Regulatory Guide 1.109 (NRC 1977).

4.3.2.2 Nonradiological Contaminants in Surface Water

Hazard quotients for noncarcinogenic chemicals and risk estimates for carcinogenic chemicals are
calculated for the drinking water and fish consumption pathways using measured concentrations in water
and fish tissue where available.

4.4 RADIONUCLIDES IN OBJECTS

Sources of potential exposure to the public from radiation emanating from radionuclides contained in
structures and other objects will be evaluated, as requested.

4.5 RADIATION DOSE TO NATIVE AQUATIC AND TERRESTRIAL ORGANISMS

DOE O 458.1 (DOE 2020) requires the establishment of procedures and practices that ensure biota are
protected and radiological activities are conducted in a manner that protects populations of aquatic
animals, terrestrial plants, and terrestrial animals in local ecosystems from adverse effects due to radiation
and radioactive material released from DOE operations. DOE-STD-1153-2019, A Graded Approach for
Evaluating Radiation Doses to Aquatic and Terrestrial Biota (DOE 2019a) establishes a dose rate
criterion of 0.1 rad/day for riparian and terrestrial animals and dose rate criterion of 1 rad/day for aquatic
organisms and terrestrial plants.

To demonstrate compliance with these limits, the method described in DOE-STD-1153-2019 is used to
estimate absorbed dose rates to aquatic organisms and terrestrial organisms. Absorbed doses are generally
calculated using the RESRAD-BIOTA computer code (DOE 2019b), but other methods may also be used.
The graded approach consists of a three-step evaluation that begins with a conservative general screening
and, if needed, ends with a rigorous analysis using site-specific information. The general screening
involves comparing maximum radionuclide concentrations from water, sediment, and/or soil to default
biota concentration guides. If the general screening indicates further evaluation is needed, a site-specific

 4-5
ENVIRONMENTAL MONITORING PLAN FOR THE OAK RIDGE RESERVATION

screening is performed. This typically includes comparing average radionuclide concentrations in water
and sediment (for aquatic biota) or soil (terrestrial) with default biota concentration guides. If these
comparisons indicate additional evaluations are needed, more rigorous site-specific analysis and
site-specific biota dose assessment may be required.

4.6 DOSE ASSESSMENT QUALITY ASSURANCE

EPSD uses UT-Battelle’s Standards Based Management System (SBMS) to provide a systematic
approach to integrating QA and environmental and safety considerations into all activities. SBMS is a
web-based system that provides a single point of access to all the requirements necessary for staff to
safely and effectively perform their work. SBMS translates laws, orders, directives, policies, and best
management practices into laboratory-wide subject areas and procedures.

In addition to applicable guidance and instructions in SBMS subject areas (e.g., Work/Project Planning
and Control, Personnel Training and Qualifications, Records Management, and Assessments), approved
procedures and technical directives for dose assessment are controlled and maintained through the ORNL
Integrated Document Management System along with descriptions of models used, implementing
computer codes, values and sources of input data, and underlying assumptions.

 4-6
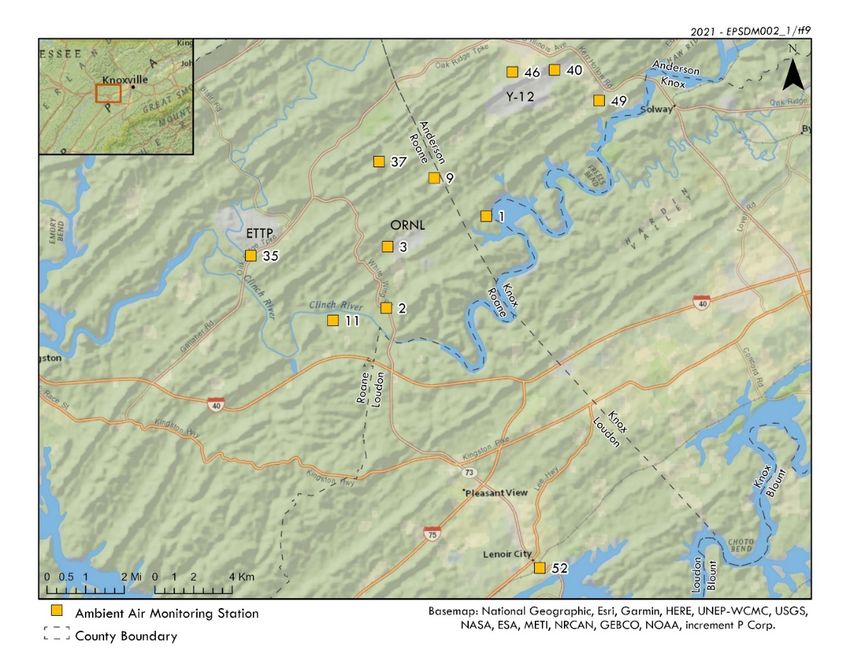
ENVIRONMENTAL MONITORING PLAN FOR THE OAK RIDGE RESERVATION

5. OAK RIDGE RESERVATION ENVIRONMENTAL SURVEILLANCE
In addition to environmental monitoring conducted at the three major DOE ORR installations,
reservation-wide surveillance monitoring is performed to directly measure radiological and
nonradiological parameters in environmental media adjacent to the facilities. Data from these
environmental monitoring and surveillance programs are analyzed to assess the environmental impact of
DOE operations on the entire reservation and the surrounding area.

5.1 AMBIENT AIR

 Purpose and Scope

Ambient air monitoring is performed to directly measure radiological parameters in the ambient air
adjacent to ORR facilities; this monitoring supplements data from exhaust stack monitoring conducted at
Y-12, ORNL, and ETTP. Ambient air monitoring also provides a means to verify that the impacts of
fugitive and diffuse sources are insignificant, serves as a check on dose modeling calculations, and allows
determination of contaminant levels at monitoring locations in the event of emergencies.

 Sampling Locations

The ORR ambient air monitoring network includes 10 stations on or near the reservation and a reference
station in an area not affected by DOE operations in the Oak Ridge area. Atmospheric dispersion
modeling, evaluations of land ownership, and accessibility of areas that once were not available to the
public were used to select appropriate sampling locations (Fig. 5.1).

 Parameters and Methods

Continuous ambient air sampling is performed with weekly to biweekly collection of sampling media.
Quarterly composites are submitted for laboratory analyses. Samples are analyzed for gross alpha, gross
beta, gamma-emitting radionuclides, tritium, technecium-99, and specific radionuclides that contribute
≥0.1 mrem to the ORR ED from airborne emissions. Per DOE-HDBK-1216-2015 (DOE 2015),
Radiological Environmental Effluent Monitoring and Environmental Surveillance, when identifying
radionuclides to be included in the analytical suite, the half-life of each will be taken into account to
determine if it is sufficiently long to allow for detection in samples. Tests for other isotopes that are
significant contributors to the ORR ED may also be performed periodically to confirm that dose models
are not underestimating dose to the public. The sampling system consists of two separate instruments, one
for particulates and one for tritiated water vapor. Particulates are captured on glass-fiber filters in a high-
volume air sampler. Tritiated water vapor is captured using a sampler comprised of a prefilter followed by
an adsorbent trap consisting of indicating silica gel. Parameters, analytical methods, and requested
minimum detectable activities are summarized in Table 5.1

 5-1
ENVIRONMENTAL MONITORING PLAN FOR THE OAK RIDGE RESERVATION

 Fig. 5.1. Oak Ridge Reservation perimeter ambient air monitoring stations.

 Table 5.1. Ambient Air Parameters Analytical Methods, and Requested Minimum
 Detectable Activity

Parameter Media Method Requested Minimum
 Detectable Activity
Gross alpha Glass-fiber filter EPA 900.0 4.7 pCi/sample
Gross beta Glass-fiber filter EPA 900.0 7.5 pCi/sample
Gamma scan a
 Glass-fiber filter EPA 901.1 7
 Be—90 pCi/sample
 40
 K—180 pCi/sample
234
 U Glass-fiber filter ASTM 3972 0.1 pCi/sample
235
 U Glass-fiber filter ASTM 3972 0.1 pCi/sample
238
 U Glass-fiber filter ASTM 3972 0.1 pCi/sample
99
 Tcb Glass-fiber filter DOE RP550 35 pCi/sample
Tritium Silica gel EPA 906.0 100 pCi/g
a Report 40K, 7Be, and all detectable manmade isotopes.
b Report 99Tc for stations 35 and 52 only.

 5-2
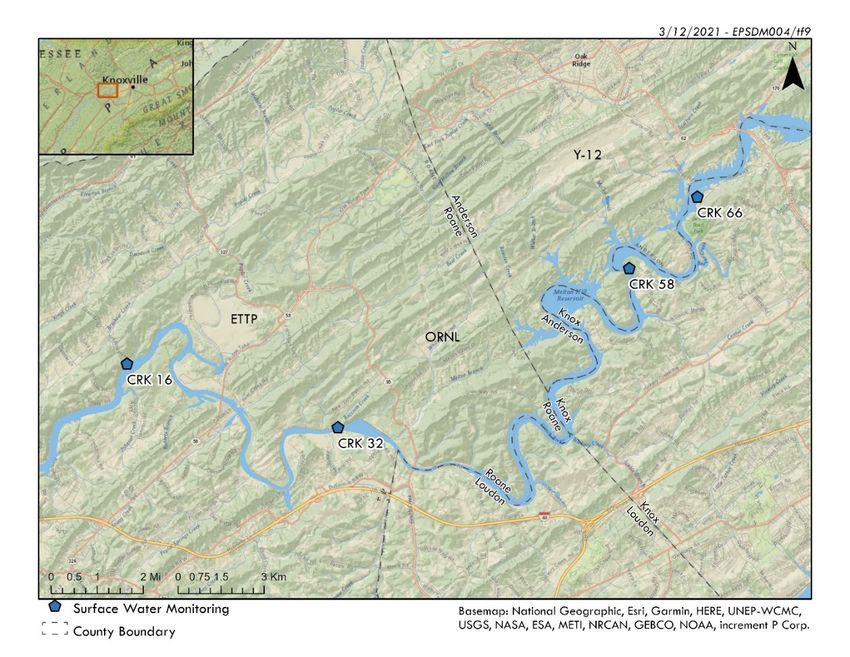
ENVIRONMENTAL MONITORING PLAN FOR THE OAK RIDGE RESERVATION

5.2 EXTERNAL GAMMA RADIATION

 Purpose and Scope

Members of the public could hypothetically be exposed directly to gamma radiation from radionuclides
released into the environment; previously released radionuclides deposited on soil and vegetation or in
sediments; radiation-generating facilities, especially high-energy accelerators; and the storage of
radioactive materials.

 Sampling Locations and Methodology

Direct radiation levels are monitored continuously with dual-range Geiger-Müller detectors co-located
with seven of the ORR ambient air stations (2, 3, 9, 11, 40, 46, and 49) and the Fort Loudoun reference
location, station 52 (Fig. 5.2).

 Fig. 5.2. Oak Ridge Reservation external gamma radiation monitoring locations.

5.3 SURFACE WATER

 Purpose and Scope

Members of the public could potentially be exposed to waterborne pollutants released from the ORR
through drinking water, irrigation, and recreational activities such as boating, fishing, or swimming. ORR
surface water monitoring is conducted at four locations on the Clinch River.

 5-3
ENVIRONMENTAL MONITORING PLAN FOR THE OAK RIDGE RESERVATION

 Sampling Locations

The four surface water sampling locations are as follows (Fig. 5.3):

 • Clinch River above DOE inputs at Oak Ridge water supply intake (Clinch River kilometer
 [CRK] 66)
 • Clinch River at Knox County water supply intake (CRK 58)
 • Clinch River downstream from ORNL at Jones Island (CRK 32)
 • Clinch River downstream of DOE inputs at Brashear Island (CRK 16)

 Fig. 5.3. Oak Ridge Reservation surface water surveillance sampling locations.

 Parameters and Methods

Grab samples are collected quarterly at each surface water sampling location. Table 5.2 shows locations,
routinely monitored parameters, required analytical methods, and requested analytical report
level/minimum detectable activities. Additional analyses for 241Am, 237Np, 238Pu, 239/240 Pu, 228Th, 230Th, and
232
 Th will be performed in 2022 to confirm that routinely monitored parameters are adequately
characterizing doses associated with offsite surface water. Extra radiological analyses are performed
periodically (on a rotational basis) for all media included in the ORR Environmental Monitoring Plan. If
dose modeling indicates any of the additional analytes are significant contributors to the ED, they may
added for routine monitoring in future years.

 5-4
ENVIRONMENTAL MONITORING PLAN FOR THE OAK RIDGE RESERVATION

 Table 5.2. Surface Water Locations, Routine Parameters, Methods, and Requested Report
 Level/Minimum Detectable Activity

 Requested Report
Location Parameter Analytical Method Level/Minimum
 Detectable Activity
CRKa 16, 32, 66 Mercury EPA 7470A or EPA 1631b EPA 7470A— 0.07 ug/L,
 EPA 1631—0.5 ng/L
All Gross alphac EPA 900.0 3 pCi/L
All Gross beta d
 EPA 900.0 3 pCi/L
 7
All Gamma scane EPA 901.1 Be—100 pCi/L
 40
 K—50 pCi/L
CRK 16, 32, 66 Total radioactive EPA 905.0
 2 pCi/L
 strontium
All Tritium EPA 906.0 270 pCi/L
All Field measurements f

a CRK = Clinch River kilometer.
bEPA 1631 will be used for mercury analyses if available
c Specific isotopic analyses are performed when gross alpha measurements exceed 15 pCi/L
d Specific isotopic analyses are performed when gross beta measurements exceed 50 pCi/L
and are not accounted for by other monitoring results (e.g., beta activity from total strontium,
40K, etc.).

eReport 40K, 7Be, and all detectable manmade isotopes.
f
 Temperature, dissolved oxygen, and pH.

5.4 VEGETATION AND MILK

 Vegetables

5.4.1.1 Purpose and Scope

As available, food crops are sampled annually from gardens in locations that have the potential to be
affected by airborne releases from ORR to evaluate possible radiation doses received from consuming
vegetables grown near ORR. Samples are also obtained from a reference location in an area not impacted
by ORR activities for comparison. Areas of interest will be identified by EPSD dose assessment staff and
surveys will be performed to locate gardens in these areas. If possible, crops that represent broad-leaf
systems (e.g., lettuce, turnip greens), root-plant-vegetable systems (e.g., tomatoes), and root-system
vegetables (e.g., turnips, potatoes) will be obtained from each area of interest.

5.4.1.2 General Locations

The following general locations will be surveyed for availability:

 • Reference location
 • Southeast of ETTP/Southwest of ORNL (Jones Island area)

 5-5
ENVIRONMENTAL MONITORING PLAN FOR THE OAK RIDGE RESERVATION

 • Southeast of ORNL (Gallaher Bend area)
 • North of Y-12 (Scarboro community)

5.4.1.3 Parameters, Analytical Methods, and Detection Levels

All samples are analyzed for gross alpha, gross beta, gamma-emitting radionuclides, and specific
radionuclides that contribute ≥0.1 mrem to the ORR ED from airborne emissions (Table 5.3). Per DOE-
HDBK-1216-2015 (DOE 2015), Radiological Environmental Effluent Monitoring and Environmental
Surveillance, when identifying radionuclides to be included in the analytical suite, the half-life of each
will be taken into account to determine if it is sufficiently long to allow for detection in samples.
Additional analyses for other isotopes may be performed periodically to confirm that routinely monitored
parameters are adequately characterizing doses from consuming food crops.

 Table 5.3. Vegetable Parameters, Analytical Methods,
 and Requested Minimum Detectable Activities

 Parameter Method Requested Minimum
 Detectable Activity
 Gross alpha EPA 900.0 0.0007 pCi/g
 Gross beta EPA 900.0 0.020 pCi/g
 a 7
 Gamma scan EPA 901.1 Be—2.11 pCi/g
 40
 K—2 pCi/g
 234
 U Lab specific 0.01 pCi/g
 235
 U Lab specific 0.01 pCi/g
 238
 U Lab specific 0.01 pCi/g
 a Report 40K, 7Be, and all detectable manmade isotopes.

 Milk

An availability assessment of dairy operations in areas surrounding the ORR will be performed annually.
If cooperating commercial or family dairy operations are identified in areas that could potentially be
impacted by ORR activities, samples will be collected bimonthly or at frequencies negotiated with
suppliers. The parameters, analytical methods, and requested minimum detection levels applicable to milk
samples, when available, are presented in Table 5.4. Additional analyses for other isotopes may be
performed periodically to confirm doses from consuming milk are adequately characterized.

 5-6
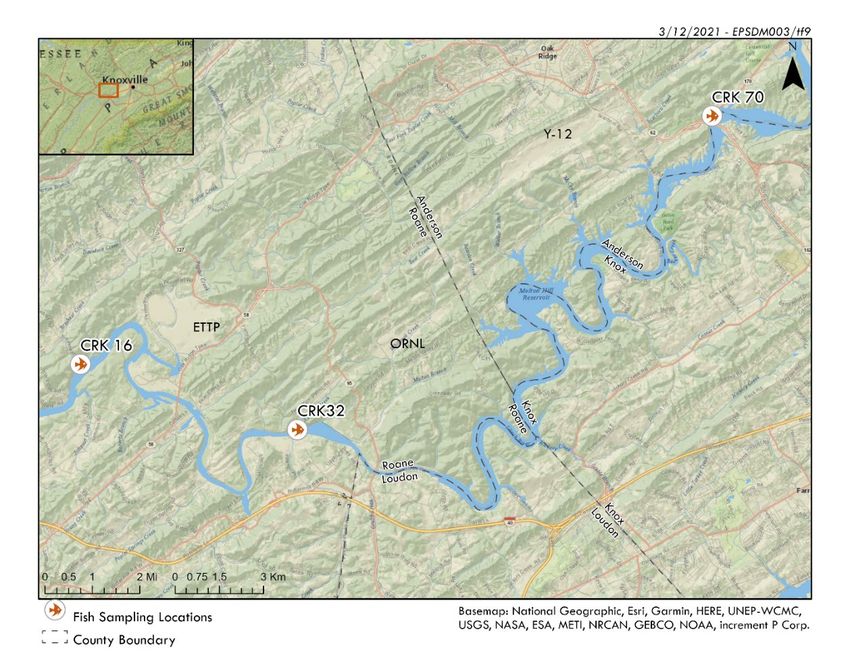
ENVIRONMENTAL MONITORING PLAN FOR THE OAK RIDGE RESERVATION

 Table 5.4. Milk Parameters, Analytical Methods, and
 Requested Minimum Detectable Activities

 Parameter Method Requested
 Minimum
 Detectable Activity
 Tritium EPA 906.0 710 pCi/L
 Total rad strontium EPA 905.0 21 pCi/L
 7
 Gamma scan a
 EPA 901.1 Be—75 pCi/L
 40
 K—100 pCi/L
 a Report 40K, 7Be, and all detectable manmade isotopes.

 Hay

Hay from the southeastern edge of the ORR is made available to an offsite farming operation and is
sampled annually, typically during or soon after the first cutting. Hay is analyzed for gross alpha, gross
beta, gamma-emitters, and specific radionuclides that contribute ≥0.1 mrem to the ORR ED from airborne
emissions. Parameters, analytical methods, and requested minimum detection levels applicable to hay are
listed in Table 5.5. Additional analyses for other isotopes may be performed periodically to confirm that
routinely monitored parameters are adequately characterizing doses traceable to hay grown on the ORR.

 Table 5.5. Hay Parameters, Analytical Methods, and
 Requested Minimum Detectable Activities

 Parameter Method Requested Minimum
 Detectable Activity
 Gross alpha EPA 900.0 0.7 pCi/g
 Gross beta EPA 900.0 15 pCi/g
 a 40
 Gamma scan EPA 901.1 K—20 pCi/g
 234
 U Lab specific 0.01 pCi/g
 235
 U Lab specific 0.01pCi/g
 238
 U Lab specific 0.01 pCi/g
 a Report 40K, 7Be, and all detectable manmade isotopes.

5.5 WILDLIFE MONITORING

The ORR Environmental Surveillance Program will continue to conduct annual radiological screenings of
Canada geese and, when deer and turkey hunts on the ORR are resumed, to analyze screening data
collected by UT-Battelle wildlife management staff during the hunts). ORR hunts were cancelled in 2020
and 2021 due to the coronavirus pandemic.)

 Deer Hunts

Deer hunts are typically held annually in November and December on the ORR. Deer are screened for
radioactivity before release to hunters. If ORR hunts are resumed in 2022, screening data and any data
available from laboratory analyses will be used to estimate doses to consumers of deer harvested on the

 5-7
You can also read