Environmental
Report
2018
←
→
Page content transcription
If your browser does not render page correctly, please read the page content below

Environmental Report 2018
Google Environmental Report 2018
                                   2    Environmental sustainability at Google
                                   3    About Google
                                   4    About this report

                                   Our approach
                                   6 		Mission and values
                                   13   Performance highlights and targets

                                   Designing efficient data centers
                                   18		Overview
                                      SPOTLIGHT: Positive energy: Belgian site becomes first Google
                                   22
                                      data center to add on-site solar

                                   Advancing renewable energy
                                   24		Overview
                                   29   Our carbon footprint
                                   32   SPOTLIGHT: Unlocking access to corporate renewable energy
                                        purchasing in Taiwan

                                   Creating sustainable workplaces
                                   34		Overview
                                   38   SPOTLIGHT: Ecologically focused landscapes are coming
                                        to life on Google campuses

                                   Empowering users with technology
                                   40		Overview
                                   45   SPOTLIGHT: Transparency unleashed: How Global Fishing Watch
                                        is transforming fishery management

                                   Appendix
                                   47		Environmental data
                                   50		Endnotes

Google Environmental Report 2018                                                                      1
Environmental sustainability
                                   at Google
                                   Since our early days, Google has focused on developing services that
                                   significantly improve the lives of billions of people while operating our
                                   business in an environmentally sustainable way.
                                     We’ve come a long way in 20 years: maintaining carbon neutrality since
                                   2007, matching 100% of the 2017 electricity consumption of our global
                                   operations with renewable energy purchases, leading the industry in data
                                   center energy efficiency, creating over 11 million square feet of LEED-certified
                                   office space, and diverting more than 75% of our waste from landfills.
                                     We’re encouraged by what we’ve accomplished and are energized by how
                                   much more there is to do. Creating a clean and healthy planet is a shared
                                   responsibility, and not something that can be solved in a day. That’s why we’re
                                   excited about the great work being done across Google, as well as through
                                   long-term, innovative partnerships.
                                     Matching 100% renewable energy is just the beginning. We’re enabling
                                   3 gigawatts of new renewable energy around the world and engaging
                                   policymakers to unlock opportunities for corporate renewable-energy
                                   procurement. We’ve also taken a science-based approach in designing our
                                   buildings to be as healthy as possible and to add value to the communities
                                   around them. Through collaborative partnerships, we’re leveraging our
                                   technology to provide insights that empower decision-makers to protect
                                   both people and the planet.
                                     Our commitment to a zero-carbon future drives us to build sustainability
                                   into everything we do, and we’ll continue using our technology for good
                                   in order to help people around the world make smarter use of the earth’s
                                   resources and drive positive environmental impact.

                                   Ruth Porat                                Urs Hölzle
                                   Senior Vice President and                 Senior Vice President of
                                   Chief Financial Officer                   Technical Infrastructure

                                   Alphabet and Google                       Google

Google Environmental Report 2018                                                                                      2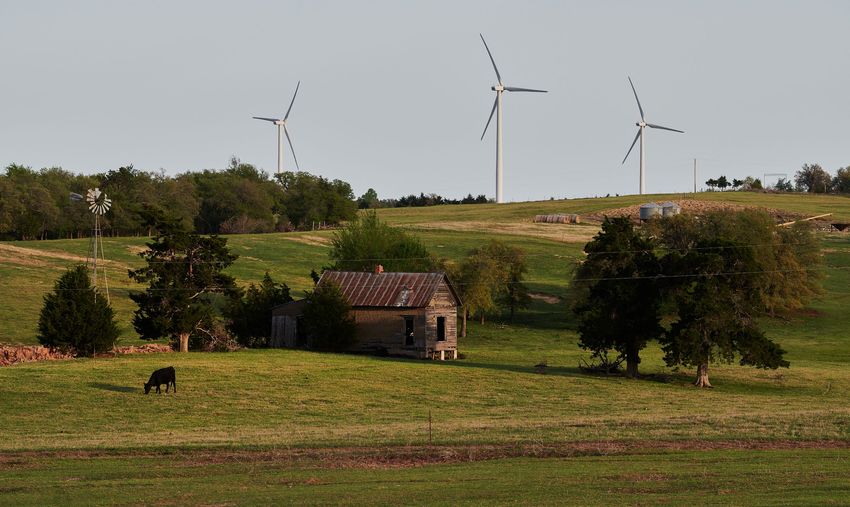
About Google
                                   As our founders explained in their first letter to shareholders, Google’s goal
                                   is to “develop services that significantly improve the lives of as many people
                                   as possible.”1 We believe in technology’s potential to have a positive impact
                                   on the world. We also believe we’re just scratching the surface. Our goal as
                                   a company is to remain a place of incredible creativity and innovation that
                                   uses our technical expertise to tackle big problems.
                                     We generate revenue primarily through online advertising. Google’s core
                                   products—Search, Android, Maps, Chrome, YouTube, Google Play, and
                                   Gmail—each have more than 1 billion monthly active users.
                                     We also offer a broad collection of cloud-based products and services,
                                   including G Suite business productivity apps like Docs, Drive, and Calendar
                                   and satellite mapping and analysis platforms like Google Earth and Google
                                   Earth Engine. In recent years we’ve expanded into consumer electronics
                                   with products including Google Pixel, Google Pixelbook, Google Home,
                                   and Chromecast.
                                     We’re a wholly owned subsidiary of Alphabet Inc., which also includes
                                   companies such as Access, Calico, CapitalG, GV, Verily, Waymo, and X.
                                   As of December 31, 2017, we had more than $110 billion in total revenues
                                   and 80,110 full-time employees.
                                     Google’s headquarters are located in California, in the San Francisco Bay
                                   Area, United States. In this report the term “Bay Area headquarters” refers to
                                   our operations in both Mountain View and Sunnyvale. We own and lease office
                                   and building space, research and development labs, and sales and support
                                   offices across more than 160 cities, primarily in North America, Europe,
                                   South America, and Asia, and we own and operate 14 data centers across
                                   four continents.

Google Environmental Report 2018                                                                                    3
About this report
                                   The annual data in this report covers our 2017 fiscal year (January 1 to
                                   December 31, 2017). The spotlights also include data and stories from prior
                                   years to provide context, as well as some of our progress in 2018. Unless
                                   otherwise specified, all environmental performance data included in this
                                   report applies to Google LLC. The primary exception is our greenhouse
                                   gas (GHG) emissions and energy use data, which covers the combined
                                   operations of Google and our parent company, Alphabet Inc., and has been
                                   third-party verified.
                                     For more information about our environmental sustainability initiatives,
                                   including case studies, white papers, and blogs, please see our Sustainability
                                   website and our 2017 Environmental Report. Additional information about
                                   Google’s commitment to corporate responsibility can be found in the
                                   resources listed below:
                                   Alphabet’s 2018 CDP Climate Change Report
                                   Responsible Supply Chain website
                                   Investor Relations website
                                   Google.org website
                                   Crisis Response website
                                   Diversity & Inclusion website
                                   Accessibility website
                                   Transparency Report
                                   Digital Wellbeing website
                                   Privacy & Security website

Google Environmental Report 2018                                                                                    4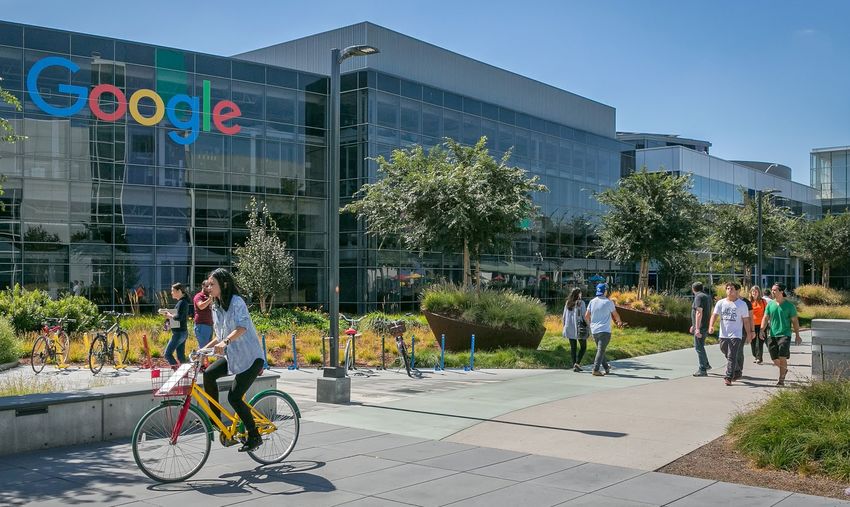
Our approach

          Google Earth image of New Caledonia, Australia
          ©CNES / Astrium, DigitalGlobe

Google Environmental Report 2018                           5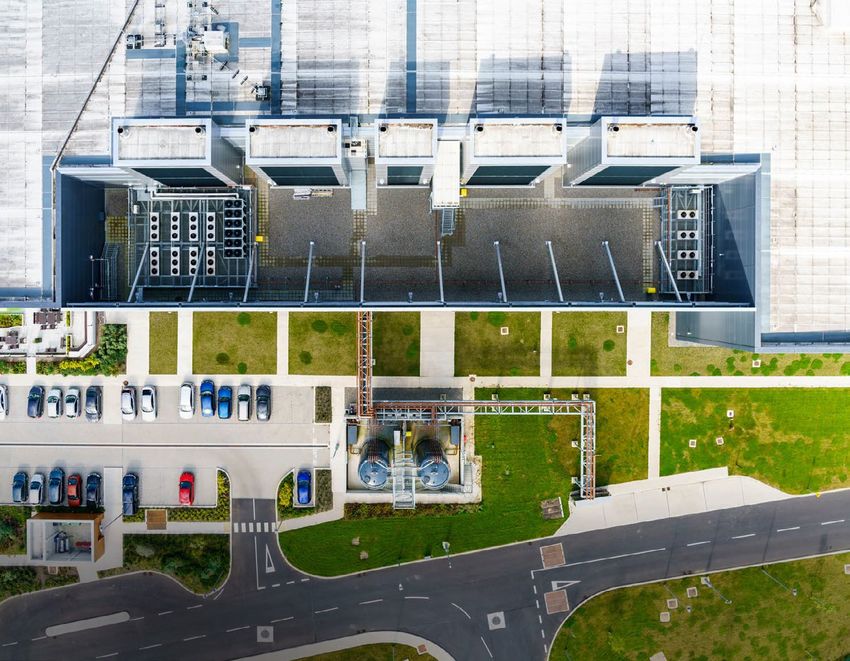
The Googleplex in Mountain View, California

                                   Mission and values
                                   Our mission is to organize the world’s information and make it universally
                                   accessible and useful. Fulfilling this mission and bringing the benefits of
                                   information not just to the more than 3 billion people who are already online
                                   but to the next 4 billion requires us to use resources ever more efficiently.2
                                     The path to a cleaner, healthier future begins with the small decisions
                                   we make each day. That’s why we’re committed to building sustainability into
                                   everything we do, making smart use of the earth’s resources, and creating
                                   products with the planet in mind. We constantly look for ways to have a
                                   positive environmental impact and be even more responsible in our use of
                                   energy, water, and other natural resources—and we want to empower others
                                   to do the same.
                                     Our operations are designed to get the most out of technology, while
                                   also being mindful of our use of resources. That’s why Google is the world’s
                                   largest corporate purchaser of renewable energy (see Figure 5 on page 25),
                                   and it’s what’s driven us to be carbon neutral since 2007. Our data centers
                                   also lead the industry in energy efficiency, using 50% less energy than the
                                   industry average. This same ethos carries over to our workplaces, with over
                                   1 million square meters (11 million square feet) of Leadership in Energy and
                                   Environmental Design (LEED) certified offices and the diversion of more than
                                   three-quarters of our waste from landfills.

Google Environmental Report 2018   Our approach                                                                                 6
Our tools are built to help us all reduce our environmental impact,
           Google Maps
                                         understand the planet, and take sustainable action. One hundred percent of

           1 billion
           provides more than            the electricity our operations use is matched with renewables, so whether
                                         someone is using Google at home or as part of an organization running
                                         Google Cloud or G Suite, the net carbon emissions directly associated with
                                         those workloads is zero. By mapping the world’s forests and fisheries, our
           kilometers’ worth of          technology also makes it easier for researchers and nonprofit groups to
           alternative transit results   monitor the pulse of the planet. For those looking to take sustainable action,
           per day.                      the 1 billion kilometers (621 million miles) of alternative transit options we share
                                         in Google Maps every day, the tens of millions of rooftops we’ve mapped
                                         for solar potential, and the over 17 billion kilowatt-hours (kWh) we’ve helped
                                         households save through Nest make it easier to do so. And as we continue to
                                         grow our Made by Google consumer hardware business, we’re on a journey
                                         to make consumer electronics that work for people and the planet.

                                         Addressing a global challenge
                                         Humanity is consuming natural resources at an astonishing rate. During
                                         the 20th century, global raw material use rose at about twice the rate of
                                         population growth.3 Every year humanity consumes far more than what
                                         the planet can naturally replenish. In 2017, global demand for resources
                                         was 1.7 times what the earth can support in one year.4
                                           These statistics highlight the need to rethink the “take-make-waste” economic
                                         model that human societies have followed since the Industrial Revolution, in
                                         which we take a natural resource, make a product from it or burn it for fuel, and
                                         eventually send what remains to the landfill as waste. A major consequence of
                                         this model is climate change, one of the most significant challenges of our time.
                                         We believe that Google’s scale, resources, and technological expertise can help
                                         the world meet its energy and resource needs in a way that drives innovation and
                                         growth while reducing GHG emissions and the use of virgin materials and water.

                                         Taking action
                                         Demand for computing power continues to skyrocket, with millions more
                                         people coming online every month, and data center capacity continues
                                         to expand to meet this need. But despite this growth, the total amount
                                         of electricity used by U.S. data centers has remained constant. Annual
                                         consumption increased by 90% from 2000 to 2005, but only by 4% from
                                         2010 to 2014, largely due to data centers’ ability to improve their efficiency
                                         as they scale.5 As the use of mobile devices increases and more IT users
                                         transition to public clouds, we believe our industry can and must do better
                                         than just holding the line on energy use. We can actually lower it, serving
                                         more users while using fewer resources.

Google Environmental Report 2018         Our approach                                                                           7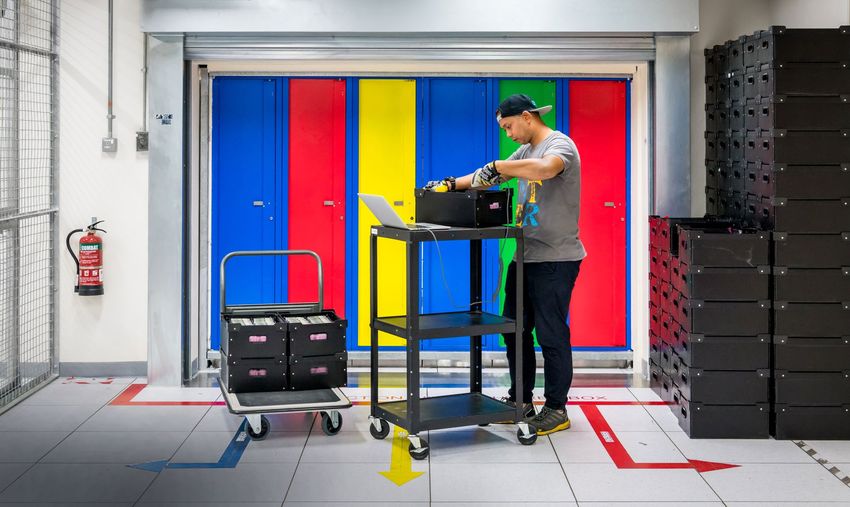
Google Earth image of Santa Cruz Province, Argentina
     © CNES / Astrium, DigitalGlobe

                                                              Google’s energy consumption drives our biggest impact on the environment,
                                                            and we’re focused on tackling it through a threefold strategy for carbon
                                                            neutrality. First, we pursue aggressive efficiency initiatives. Second, we
                                                            match 100% of the electricity consumption of our operations with purchases
                                                            of renewable energy. Third, we buy carbon offsets for any remaining
                                                            emissions we haven’t yet eliminated.
                                                              We’ve long been a vocal advocate for greening electrical grids worldwide.
                                                            We’ve supported strong clean-energy and climate-change policies
                                                            committed to adding clean power to the grid, and we’re partnering with
                                                            governments and nongovernmental organizations to use Google technology
                                                            and computing power to model the effects of climate change on both a
                                                            global and a local level. Today, we have contracts to purchase 3 gigawatts
                                                            (GW) of output from renewable energy projects, and these contracts have
                                                            led to over $3 billion in new capital investment in projects around the world.6
                                                              We’re also working to incorporate a climate-resilience strategy into our
                                                            operations that will enable our business and the communities we are part
                                                            of to thrive despite the effects of climate change. We’ve developed a set
                                                            of principles that serve as the foundation for our strategy, which focuses
                                                            on a people-centric framework that is robust, integrated, diverse, and
                                                            designed with unique locations, scalability, and longevity in mind.7 We used
                                                            this framework to conduct a climate exposure and vulnerability analysis
                                                            that enabled us to assess the future resilience of our current locations and
                                                            evaluate the climate resilience of new developments.

Google Environmental Report 2018                            Our approach                                                                      8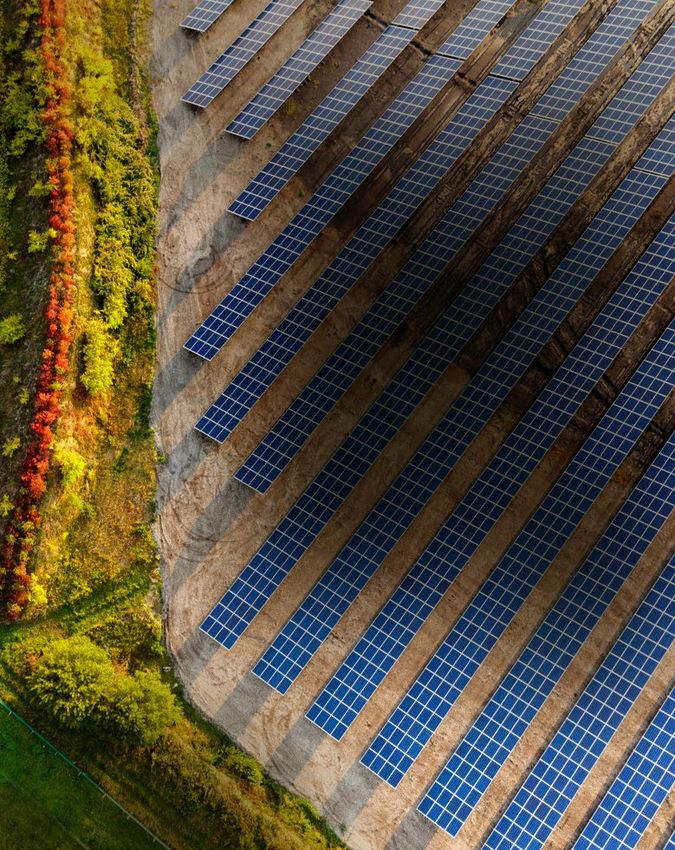
Water is another top priority. The United Nations predicts that by 2025,
           In 2017, we diverted          two-thirds of the world’s population could live in water-stressed conditions,

           91%
                                         and with the existing climate change scenario, almost half the world’s
                                         population will be living in areas of high water stress by 2030.8 As a global
                                         company headquartered in drought-prone California, we’re working to
                                         efficiently utilize water, particularly in our data centers, where we regularly
           of waste from our global      redesign and enhance our cooling technologies. We’re also using Google
           data center operations away   technology to help researchers study global water challenges and awarding
           from landfills.               millions of dollars in grants to promising water-conservation solutions.9
                                           Finally, we’re changing how we think about waste. In October 2016 we
                                         announced that we’re committed to achieving Zero Waste to Landfill for
                                         our global data center operations by reducing the amount of waste we
                                         generate and finding better disposal options. In 2017, we diverted 91% of
                                         waste from our global data center operations away from landfills, and we’re
                                         always looking for new ways to reduce waste in our journey to sustainably
                                         manage resources across Google. As a Global Partner of the Ellen MacArthur
                                         Foundation, we’re also working with other leading companies to help
                                         bring initiatives like these to scale, thereby accelerating the transition to
                                         a circular economy.
                                           We’re applying circular economy principles to design out waste, keep
                                         materials in use, and regenerate natural systems. We strive to embed these
                                         approaches into everything Google does, from how we manage servers in
                                         our data centers to the materials we select to build and furnish our offices.
                                         We have also been exploring the role of technology in advancing the circular
                                         economy, and we continue to look for opportunities to embed circular
                                         principles into the fabric of our infrastructure, operations, and culture.

                                             Assembling a unit using partly refurbished and salvaged parts

Google Environmental Report 2018         Our approach                                                                      9
Snapshot of Google Earth Engine timelapse
over Miami, Florida
Looking toward future opportunities
We believe global businesses like Google should lead the way in improving
people’s lives, while reducing or even eliminating our dependence on virgin
materials and fossil fuels. And we believe this can be done in a way that makes
business sense, providing economic returns alongside societal benefits and
positive environmental impacts.
Our end goal is to get to a point where renewables and other carbon-free
energy sources power our operations every hour of every day. This means
empowering all energy users with cheap, clean, zero-carbon energy sources like
wind and solar and developing new policies, technologies, and tools that help
users, businesses, and activists drive change.
Google tools are helping people measure the planet’s health. More and more,
machine learning and artificial intelligence applications are enabling scientists
and practitioners to create sustainable solutions and to turn the data we have
into the insights and knowledge needed to guide better decision-making. Today
anyone who is online can view Timelapse on Google Earth Engine and see the
world change over recent decades, watching as cities grow, forests disappear,
glaciers recede, and lakes dry up. We continue to work with research and
nonprofit organizations all over the world to monitor these changes. Our vision
is to leverage our mapping, cloud, and machine learning technologies to create a
living, breathing dashboard of our planet that can help inform everyday decisions
for individuals, organizations, and nations—today and for generations to come—
and we are committed to using these technologies in a responsible way.10
Google Environmental Report 2018 Our approach 10Figure 1
OUR PRIORITIES
Designing Providing Empowering Managing water Embedding Engaging our
energy-efficient sustainable users with stewardship and circular economy supply chain
data centers workplaces and technology increasing the principles into on human rights,
and advancing engaging our that helps climate resilience everything we do. safety, and the
renewable employees in address global of our operations. environment.
energy. our sustainability sustainability
programs. challenges.
Setting our priorities
This year we undertook an assessment to identify and prioritize content for
our environmental report. This assessment took into consideration Google’s
impact on sustainability, the importance of environmental sustainability issues
to Google’s business strategy, and the perspectives of a diverse range of
stakeholders outside of Google.
The issue areas that were found to be of greatest relevance include our
data centers, workplaces, users, water stewardship, circular economy
strategy, and supply chain (see Figure 1). Cutting across these priorities is
the importance of engaging on public policy—at local, state, federal, and
international levels—to support the success of sustainable business models.
Aerial view of Google’s data center in Dublin, Ireland
Google Environmental Report 2018 Our approach 11Figure 2
GOOGLE VALUE CHAIN
Energy Offices and Labs Consumer Electronics
Manufacturing,
Construction, and
Services
Natural Data Centers and Google Cloud Platform and
Resources Networking Infrastructure G Suite Products
Suppliers and Communities Employees and Communities Customers and Users
Ecosystems
Google uses energy, natural resources, and products and services
from our suppliers to build our workplaces, data centers, networking
infrastructure, and consumer electronics. The software products and
services that our customers and users rely on are powered by our data
centers and networking infrastructure (see Figure 2). We’re driving positive
environmental impact throughout our value chain in four key ways: by
designing efficient data centers, advancing renewable energy, creating
sustainable workplaces, and empowering users with technology.
Google Environmental Report 2018 Our approach 12A view from Google Earth
Performance highlights
and targets
The following three pages include highlights of the environmental initiatives
discussed in this report. They provide a snapshot of our performance
to date and our targets going forward. Together, they demonstrate how
we’re strengthening our business by reducing the environmental impact
of our operations and working to empower people everywhere to live
more sustainably.
For a more complete overview of our performance over time, see the
environmental data table on page 47.
Google Environmental Report 2018 Our approach 132017 performance highlights
Designing efficient data centers
Energy Certifications
50% 7x 1.11 ISO 50001
less energy computing power PUE certification
On average, a Google data center Compared with five years ago, we The average annual power usage We maintained ISO 50001
uses 50% less energy than a typical now deliver around seven times as effectiveness (PUE) for our (energy management)
data center. much computing power with the global fleet of data centers was certification for 12 of our 14
Page 18 same amount of electrical power. 1.11, compared with the industry Google-owned and -operated
Page 18 average of 1.58—meaning that data centers globally, which
Google data centers use about together represented more
five times less overhead energy. than 96% of our IT energy use.
Page 19 Page 20
Waste
18%
of servers 2.1 million 100% 91%
remanufactured components resold landfill diversion waste diverted
18% of the servers Google deployed Over 2.1 million components Six of our operating data We diverted 91% of waste from
were remanufactured machines. were wiped clean and resold into centers have achieved 100% our global data center operations
Page 20 secondary markets. landfill diversion.11 away from landfills.
Page 20 Page 20 Page 20
Advancing renewable energy
Energy GHG emissions
87%
3 GW 100% $2.5 billion decrease in carbon
of renewable energy renewable energy in equity commitments intensity
Google is the world’s largest We matched 100% of the Since 2010, we’ve committed Over the past six years, our
corporate purchaser of renewable electricity consumption of to invest nearly $2.5 billion in carbon intensity per unit of
energy. We’ve signed 26 agreements our operations with purchases renewable energy projects revenue decreased by 87%.
totaling nearly 3 GW of renewable of renewable energy. with a total combined capacity Page 29
energy—generating emissions Page 24 of 3.7 GW.
savings equivalent to taking more Page 27
than 1.3 million cars off the road
per year.
Page 24
GHG emissions (continued)
11 years 40
of carbon neutrality carbon offset projects
Google has been carbon neutral Since 2007, we’ve partnered with
since 2007. Because of our more than 40 carbon offset projects
renewable energy and carbon to offset more than 17 million metric
offset programs, our net operational tons of carbon dioxide equivalent
carbon emissions during this period (tCO2e).
were zero. Page 31
Pages 29 and 30
Google Environmental Report 2018 Our approach 142017 performance highlights
Creating sustainable workplaces
Certifications Water Waste
11.1 million square feet 28% 29million gallons 78%
LEED-certified LEED Platinum avoided landfill diversion
Over 1 million square meters 28% of our LEED-certified square We achieved a 15% reduction We reached a 78% landfill
(11.1 million square feet) of Google footage has achieved a Platinum in potable water intensity at our diversion rate for our offices
office facilities have achieved LEED rating and 56% a Gold rating. Bay Area headquarters, which globally.
certification. Page 34 is equivalent to avoiding the Page 35
Page 34 use of over 109 million liters
(29 million gallons) of potable water.
Page 35
Waste (continued) Transportation
2.3 million pounds 33,000 tCO e 2
of food waste avoided savings
Google avoided more than 1 million By using Google shuttles in the
kilograms (2.3 million pounds) Bay Area, we saved 33,000 tCO2e
of waste in our cafés globally by emissions—equivalent to taking
tracking pre-consumer food waste 6,500 cars off the road every day for
and using this data to inform future a year or avoiding 152 million vehicle
production levels. kilometers (95 million vehicle miles)
Page 36 per year.
Page 36
Empowering users with technology
Cloud-based products Enabling technologies
0 98% 17 billion kWh
net carbon emissions emissions reduction 1 month = 1 mile of energy savings
Organizations that move IT A business using Gmail can reduce Providing an active user one month Nest Thermostats have helped
infrastructure and collaboration the GHG emissions impact of of Google services creates about customers save more than
applications from a self-managed its email service by up to 98% the same amount of GHG emissions 17 billion kWh of energy
data center or colocation facility compared with running email on as driving a car 1 mile. combined, based on average
to Google Cloud reduce the net local servers. Page 40 savings studies—enough energy
carbon emissions of their Page 40 to power all of San Francisco’s
computing to zero. electricity consumption for
Page 40 three years.
Page 42
Enabling technologies (continued)
1 billion km 67 million 70,000 20 petabytes
of transit results mapped rooftops vessels monitored of geospatial data
Google Maps provides more than Since 2015, Project Sunroof has Global Fishing Watch, powered by Earth Engine has enabled over
1 billion kilometers’ (621 million miles’) mapped more than 67 million Google Cloud Platforms’ machine 80,000 scientists around the
worth of transit results per day, rooftops in the United States and learning algorithms, monitors the world to easily analyze 20
helping limit carbon emissions Germany. More than 2 million users planet’s fisheries and provides the petabytes of freely available
by giving people access to mass have accessed the tool to make first view over space and time, geospatial information, resulting
transit options, bike routes, informed decisions about solar covering more than 70,000 of the in a deeper understanding of
and traffic information. panel installation. largest commercial fishing vessels. the planet.
Page 43 Page 43 Page 43 Page 44
Google Environmental Report 2018 Our approach 15Progress against targets
Target Deadline 2017 progress Status
Designing efficient data centers
Energy
Maintain or improve quarterly PUE at each Google data Annual The average annual PUE for our global fleet of data centers was 1.11.
center, year over year. Our fleet-wide PUE has stayed at or below 1.12 since 2013.
Waste
Achieve Zero Waste to Landfill for our global data None We increased our global landfill diversion rate for data center
center operations. operations by 5%—from 86% in 2016 to 91% in 2017.
Certifications
Maintain ISO 50001 energy management system Annual We maintained ISO 50001 certification for 12 of our 14 operating
certification for all Google-owned data centers that data centers, which together represented more than 96% of our IT
meet certain operational milestones. energy use. In 2017, our two newest facilities in the Netherlands and
Chile successfully passed external audits to the ISO 50001 standard.
Advancing renewable energy
Energy
Match 100% of the electricity consumption of our 2017 Our wind and solar deals produced enough renewable energy to
operations with renewable energy purchases. match 100% of the electricity consumption of our data centers
and offices in 2017.
GHG emissions
Maintain carbon neutrality for our operations. Annual We purchased enough renewable energy and high-quality carbon
offsets to bring our net operational carbon emissions to zero. Google
has been carbon neutral since 2007.
Creating sustainable workplaces
Certifications
Pursue third-party green or healthy-building certifications for Annual Over 1 million square meters (11.1 million square feet) of Google office
office projects, such as LEED, WELL Building Standard, and facilities have achieved LEED certification, with 28% achieving a
Living Building Challenge. Platinum rating and 56% a Gold rating.
GHG emissions
Reduce single-occupancy vehicle commuting at our Bay Area None For our Bay Area headquarters, we’re on track to meeting this
headquarters to 45% of those commuting on any given day. commute goal.
Provide electric vehicle charging stations for 10% of parking None We have achieved a design standard of approximately 10% for new
spaces at our Bay Area headquarters. construction and tenant improvement projects in the Sunnyvale
portion of our Bay Area headquarters.
Waste
Reduce landfill waste per Googler at our Bay Area 2017 We achieved a 4% reduction in landfill waste per Googler at our Bay
headquarters by 10% in 2017, compared with a three-year Area headquarters.
average baseline (2014–2016).
Set regional waste-reduction targets for our offices in 2017. 2017 We revised our strategy to focus on the highest-impact waste
opportunities within our office portfolio. In 2017, we focused on
collecting representative and robust waste audit data from our
global offices. This effort is the foundation for understanding
waste-performance opportunities based on office purchases,
waste generation, and supportive local infrastructure.
Water
Reduce potable water intensity at our Bay Area headquarters 2017 We exceeded this target, achieving a 15% reduction in our Bay Area
by 10% by the end of 2017, against a three-year average potable water intensity. This equates to over 109 million liters
baseline (2014–2016).12 (29 million gallons) avoided.
Set regional water-reduction targets for our offices in 2017. 2017 We revised our strategy to focus on the most water-stressed regions
within our portfolio. In 2017, we collaborated with the World Resources
Institute (WRI) to understand our water risk profile using the WRI
Aqueduct tool. This effort is the foundation for understanding shared
risk and opportunity within and outside of our global operations.
Achieved On track Ongoing Missed
Google Environmental Report 2018 Our approach 16Designing
efficient
data centers
Google Environmental Report 2018 17Overview
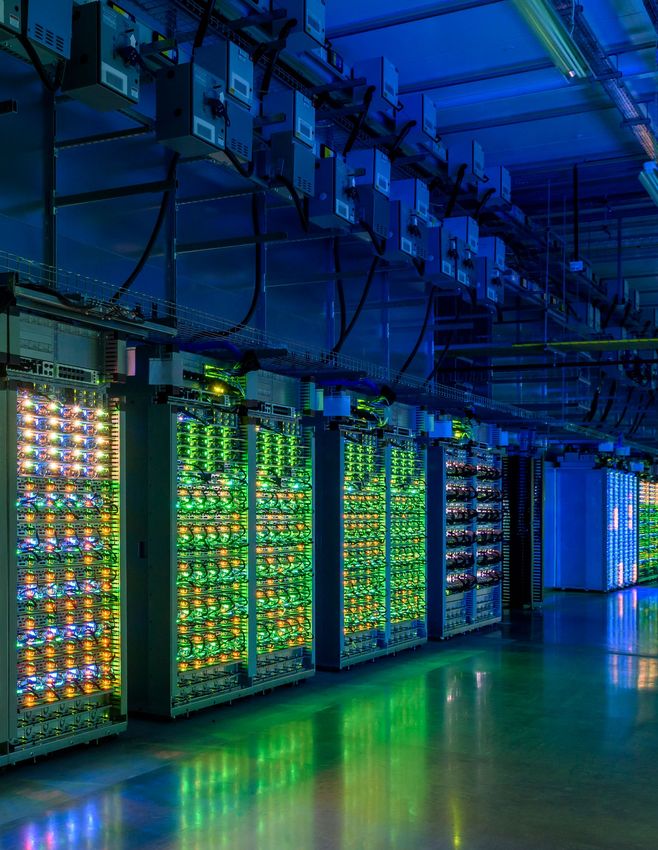
Google’s data centers are the heart of our company, powering products like
Search, Gmail, and YouTube for billions of people around the world, 24/7.
We own and operate 14 data centers on four continents and continue to add
new sites to better serve our customers. Each data center is a large campus
where the vast majority of our facilities, servers, networking equipment, and
cooling systems are designed from the ground up for maximum efficiency
and minimal environmental impact.
For more than a decade, we’ve worked to make Google data centers some
of the most efficient in the world, improving their environmental performance
even as demand for our products has dramatically risen. We’ve done this
by designing, building, and operating each one to maximize efficient use of
energy, water, and materials.
To reduce energy use, we strive to build the world’s most energy-efficient
computing network by squeezing more out of every watt of power we
consume. First, we outfit each data center with high-performance servers
that we’ve custom designed to use as little energy as possible. We improve
facility energy use by installing smart temperature and lighting controls and
redesigning how power is distributed to reduce energy loss. We employ
advanced cooling techniques, relying primarily on energy-efficient evaporative
cooling, and use nonpotable water at some sites. Finally, we're applying
machine learning to drive energy efficiency even further.
Our efforts have paid off: On average, Google data centers use 50% less
energy than typical data centers use.13 Compared with five years ago, we now
deliver around seven times as much computing power with the same amount
DATA CENTERS: BY THE NUMBERS
50%
less energy
1.11
PUE
ISO 50001 91%
certification waste diverted
On average, a Google data In 2017, the average annual We maintained ISO 50001 In 2017, we diverted 91% of
center uses 50% less energy PUE for our global fleet of data (energy management) waste from our global data
than a typical data center. centers was 1.11, compared certification for 12 of our center operations away
with the industry average 14 Google-owned and from landfills.
of 1.58—meaning that Google -operated data centers
data centers use about five globally, which together
times less overhead energy. represented more than 96%
of our IT energy use in 2017.
Google Environmental Report 2018 Designing efficient data centers 18of electrical power. Much of this improvement has come from new innovations
with accelerators, such as our Tensor Processing Units (TPUs)—highly efficient
computer chips we designed specifically for machine learning applications.
In 2017, the average annual PUE (power usage effectiveness)14 for our global
fleet of data centers was 1.11, compared with the industry average of 1.5815—
meaning that Google data centers use about five times less overhead energy
for every unit of IT equipment energy (see Figure 3). Our fleet-wide PUE has
stayed at or below 1.12 since 2013 (see Figure 4).
Generating electricity requires water, so the less energy we use to power
our data centers, the less water we use as well. The source of energy matters
too: Wind and solar energy require considerably less water to produce than
do coal and nuclear energy. In 2017, matching our data center electricity
consumption with renewable energy reduced our embedded water use by
86% on average compared with buying grid power.
Figure 3
OVERHEAD ENERGY USE IN GOOGLE DATA CENTERS
l Overhead energy
as % of IT energy
20 —
PERCENT
15 —
10 —
11%
2008 2009 2010 2011 2012 2013 2014 2015 2016 2017
Figure 4
AVERAGE PUE FOR ALL DATA CENTERS
Trailing 12-month (TTM) PUE
1.26 — Quarterly PUE
1.22 —
PUE
1.18 —
1.14 —
1.11
1.10 — 1.10
2008 2009 2010 2011 2012 2013 2014 2015 2016 2017 2018
Google Environmental Report 2018 Designing efficient data centers 19Google’s repairs process at our
data centers enables longer life
expectancy of servers.
In 2013, we became the first company in North America—and the only
major internet company—to achieve a multi-site energy management system
certification to ISO 50001, a voluntary third-party standard. Our energy
management system covers all of our owned data centers globally once
they meet certain operational milestones. In 2017, we maintained ISO 50001
certification for 12 of our 14 Google-owned and -operated data centers,
which together represented more than 96% of our IT energy use, and our two
newest facilities in the Netherlands and Chile successfully passed external
audits to the ISO 50001 standard.
We’re also working to design out waste, embedding circular economy
principles into our server management by reusing materials multiple times.
In 2017, 18% of Google’s newly deployed servers were remanufactured
machines, and 11% of components used for machine upgrades were
refurbished inventory. When we can’t find a new use for our equipment,
we completely erase any components that stored data and then resell them.
In 2017, we resold over 2.1 million units into the secondary market for reuse by
other organizations.
We’re committed to achieving Zero Waste to Landfill16 for our global data
center operations by reducing the amount of waste we generate and finding
better disposal options. Six of our operating data centers have achieved 100%
landfill diversion.17 In 2017, we diverted 91% of waste from our global data
center operations away from landfills.
Google Environmental Report 2018 Designing efficient data centers 20In addition to driving efficiency in our data center operations, we also
Google’s data center investments consider supply chain impacts. Through the efforts of our Responsible Supply
in Europe supported economic Chain program, we collaborate with stakeholders across our supply chain to
activity with uphold our high standards for protecting workers and the environment. Our
490
Supplier Code of Conduct builds upon Google’s core values and beliefs and
incorporates key elements from our internal employee Code of Conduct,
€ international human rights standards, health and safety standards, and
environmental standards.
million per year in GDP. Google has saved more than $1 billion through our energy-efficiency
initiatives and hundreds of millions more through resource efficiency.
By sharing our best practices and supporting research and collaboration,
we hope to help other companies realize their own savings and promote
ever-greater data center sustainability worldwide.
Google’s investment in digital infrastructure, such as data centers, also
supports sustainable growth and creates economic opportunity. In 2016,
Google’s U.S. data centers generated $1.3 billion in economic activity,
$750 million in labor income, and 11,000 jobs.18 From 2007 to 2017, Google’s
data center investments in Europe supported economic activity with
€490 million per year in gross domestic product (GDP) and 6,600 full-time
equivalent (FTE) jobs per year, on average.19
LEARN MORE
2016 case study: Circular Economy at Work in Google Data Centers
2016 spotlight: Machine Learning Finds New Ways for Our Data Centers to Save Energy
2018 spotlight: Once Is Never Enough
2018 spotlight: Putting Down Local Roots Where Google’s European Data
Centers Are Growing
2018 report: European Data Centers: Economic Impact and Community Benefit
2018 report: U.S. Data Centers: Economic Impact and Community Benefit
Google Data Centers website: Efficiency: How We Do It
Website: Responsible Supply Chain
Google Environmental Report 2018 Designing efficient data centers 21Spotlight
Positive energy: Belgian site
becomes first Google data
center to add on-site solar
What do you do when your data center is devoted to increasing energy
efficiency, but it’s already one of the most energy efficient in the world?
Start creating your own energy, of course.
This was the conclusion reached by Google data center engineers in
Saint-Ghislain, Belgium, who in 2016 proposed constructing an on-site solar
facility. While Google is already the world’s largest corporate purchaser of
renewable energy—in 2017, we matched 100% of electricity use from our
operations with renewable energy purchases—the Saint-Ghislain solar plant
is the first solar plant we’ve built on a data center site.
Launched in October 2017, the solar plant’s 10,665 photovoltaic panels
generate 2.9 gigawatt-hours (GWh) of clean, reliable, renewable energy
each year, reducing electricity demand from the Belgian electrical grid
and shrinking the site’s carbon footprint. Even though the plant meets
a relatively small percentage of the site’s total power needs, “anything
we can do to reduce our consumption of utility energy is significant,”
says Alain Deprez, facility manager for the Saint-Ghislain site.
In advocating for the solar project, the engineers promoted the role that
small-scale renewable projects can play in local communities. The best way
to move forward is to continually ask, What’s next?
Read about Saint-Ghislain’s on-site solar project
On-site solar facility at Google’s data center
in Saint-Ghislain, Belgium
Google Environmental Report 2018 Designing efficient data centers 22Advancing
renewable
energy
Google Environmental Report 2018 23Overview
Running our business requires us to use a lot of electricity to power our data
centers, offices, and other infrastructure. And combating climate change
requires the world to transition to a clean energy economy. So we’ve made
it a top priority to become more energy efficient and to match every unit
of energy we consume at our facilities around the world with an equivalent
unit of energy from renewable sources, such as wind and solar. Our support
for clean energy goes hand in hand with reducing our carbon footprint. By
improving the efficiency of our operations and buying both renewable power
and high-quality carbon offsets, we’ve been carbon neutral since 2007.
Google is the world’s largest corporate purchaser of renewable energy20
(see Figure 5). Since 2010, we’ve signed 26 agreements to purchase a total
of nearly 3 GW of renewable energy that is new to the grid (see Figure 6)—
generating emissions savings that are equivalent to taking more than 1.3
million cars off the road per year. And in 2012, we set a long-term goal to
purchase enough renewable energy to match all the electricity we consume
globally on an annual basis.
In 2017, we achieved it: Google’s total purchase of energy from sources like
wind and solar exceeded the amount of electricity used by our operations
around the world, including offices and data centers (see Figure 7). While
we’re still drawing power from the grid, some of which is from fossil fuel
resources, we’re purchasing enough wind and solar energy to match every
megawatt-hour (MWh) of electricity our data center and office operations
consume annually.
RENEWABLE ENERGY: BY THE NUMBERS
3 GW
of renewable energy
100%
renewable energy
$2.5 billion
in investment commitments
11 years
of carbon neutrality
Google is the world’s largest In 2017, we matched 100% of Since 2010, we’ve committed Google has been carbon
corporate purchaser of the electricity consumption of to invest nearly $2.5 billion in neutral since 2007. Because
renewable energy. We’ve our operations with purchases renewable energy projects of our renewable energy and
signed 26 agreements totaling of renewable energy. with a total combined capacity carbon offset programs, our net
nearly 3 GW of renewable of 3.7 GW. operational carbon emissions
energy—generating emissions during this period were zero.
savings equivalent to taking
more than 1.3 million cars off
the road per year.
Google Environmental Report 2018 Advancing renewable energy 24Minco II wind farm in Oklahoma (101 MW for Google)
Figure 5
CUMULATIVE CORPORATE RENEWABLE ENERGY PURCHASING*
Google LLC n Solar
Amazon n Wind
Microsoft Corp n Biomass
Apple Inc n Fuel cells
Norsk Hydro ASA n Small hydro
Facebook
ACT Government
U.S. Department
of Defense
Vivens
Walmart
Dow Chemical
Equinix
Ikea Group Corp
General Motors Co
Alcoa Corp
Kaiser Permanente
MW 0 500 1,000 1,500 2,000 2,500 3,000
*In Europe, the United States, and Mexico, as of December 31, 2017. Google total also includes one 80 MW project in Chile.
Source: Bloomberg New Energy Finance
Google Environmental Report 2018 Advancing renewable energy 25We achieved our 100% renewable energy target much faster and at much
greater scale than we thought possible when we set this goal six years ago.
We met it primarily by buying renewable electricity directly from new wind
and solar farms via long-term power purchase agreements (PPAs) on the
grids where we have operations, as well as by buying renewable power
through utilities via renewable energy purchasing models that we helped
create. In addition, a small portion of our utility energy purchases include
renewable sources as part of the utility’s grid mix.21 With our PPAs, we’re
purchasing physical renewable energy, which includes the electrons bundled
with renewable energy certificates (RECs).
By pioneering new energy purchasing models that others can follow,
we’ve helped drive wide-scale adoption of clean energy. For example, we
joined forces with three leading Dutch companies—AkzoNobel, DSM, and
Philips—to source power from two new wind projects in the Netherlands.
Our long-term collaboration offers a successful and replicable model
for how companies can save time and money and meet ever-growing
sustainability targets in a scalable way by jointly sourcing renewable
power. Our efforts earned Google two 2017 Green Power Leadership
Awards: one in Green Power Market Development from the Center for
Figure 6
RENEWABLE ENERGY FOR GOOGLE’S OPERATIONS
Since 2010, Google has signed
26 agreements to purchase a total
of nearly 3 GW of renewable energy
that is new to the grid.
Google Environmental Report 2018 Advancing renewable energy 26Resource Solutions and one in Excellence in Green Power Use from the
U.S. Environmental Protection Agency.
We’re also helping to green the power grid through our advocacy of
clean energy policies and our support for renewable energy procurement
programs. For example, we worked with business and government
stakeholders in Taiwan to share our experience with the benefits of corporate
renewable energy purchasing and to support the creation of new purchasing
channels for companies. We were pleased to see that Taiwan passed a law in
January 2017 to allow end-users to directly purchase renewable energy for
their operations.
Along with being the world’s largest corporate purchaser of renewable
energy, Google is also one of the world’s largest corporate investors in
renewable energy. Since 2010, we’ve committed to invest nearly $2.5 billion
in large-scale renewable energy projects and residential solar rooftop funds
with a combined capacity of 3.7 GW. These targeted investments go beyond
our own operational footprint, enabling renewable energy deployment at
a larger scale while generating attractive risk-adjusted returns.
Figure 7
RENEWABLE ENERGY PURCHASING COMPARED WITH TOTAL ELECTRICITY USE
8—
100%
7—
6—
ELECTRICITY CONSUMPTION (TWh)
5—
4—
61%
3—
48%
2—
37% n Total electricity
34% 35% consumption (TWh)
1— n Renewable energy %
2011 2012 2013 2014 2015 2016 2017
Google Environmental Report 2018 Advancing renewable energy 27Minco II wind farm in Oklahoma (101 MW for Google)
The cost of renewable power has dropped precipitously, while its scale
has grown dramatically. Over the past eight years, levelized costs for wind
and solar energy have decreased by 67% and 86%, respectively.22 In 2015,
wind and solar energy became the world’s largest source of newly installed
power capacity,23 and in 2017, 70% of net new power capacity globally came
from renewable energy.24 Renewables have become a mainstream source of
affordable electricity for millions of people.
Increasing the share of renewables on the grid will produce many positive
impacts. For example, doubling renewables by 2030 is expected to increase
global GDP by as much as 1.1%, improve global welfare by 3.7%, and employ
more than 24 million people in the renewable energy sector.25 In fact,
Google’s renewable energy purchasing contracts have led to over $3 billion
in new capital investment around the world.26 At Google, we’ll continue
doing our best to help accelerate the transition to clean energy and a more
prosperous future.
LEARN MORE
2016 white paper: Achieving Our 100% Renewable Energy Purchasing Goal and Going Beyond
2016 spotlight: Greening the Grid: How Google Buys Renewable Energy
2017 spotlight: Northern Exposure: How Our Nordic Renewable Deals Are Reaping Rewards
2018 blog post: Meeting Our Match: Buying 100 Percent Renewable Energy
Google Environmental Report 2018 Advancing renewable energy 28Our carbon footprint
We began calculating our annual carbon footprint in 2006. Every year since
2009, we’ve publicly reported the results to CDP, a global organization that
asks companies to disclose information on their GHG emissions performance
and management. Our report received an A score from CDP for the past four
years, and for the past three years, we earned a spot on CDP’s Climate A List,
which recognizes top reporting companies.
In 2017, our gross GHG emissions were 6.1 million tCO2e, but because
of our renewable energy purchases, our net GHG emissions were reduced
to 3.3 million tCO2e (see Figures 8 and 9). Our Scope 3 emissions doubled
in 2017 due to an increase in our capital expenditures and our hardware
business. After accounting for our carbon offset purchases, our net
operational carbon emissions were zero.
Because of our emissions-reduction efforts, our carbon intensity has
steadily decreased even as our company has grown and our energy use has
correspondingly increased. Over the past six years, our carbon intensity per unit
of revenue decreased by 87% (see Figure 10), our carbon intensity per full-time
Figure 8 Figure 9
GROSS GHG EMISSIONS NET GHG EMISSIONS
(WITHOUT RENEWABLE ENERGY PURCHASES) (WITH RENEWABLE ENERGY PURCHASES)
7—
6,086,962 tCO2e
6—
5—
MILLION tCO2e
4— n Scope 1
3,294,905 tCO2e
n Scope 2 (location)
3— n Scope 2 (market)27
n Scope 3
2— l Total location-based
GHG emissions
l Total market-based
1— GHG emissions
2011 2012 2013 2014 2015 2016 2017 2011 2012 2013 2014 2015 2016 2017
Google Environmental Report 2018 Advancing renewable energy 29equivalent employee decreased by 85% (see Figure 11), and our carbon
intensity for electricity used at our data centers dropped by 91%. This means
we’re delivering our products and services with decreased carbon impacts,
even before using carbon offsets to reach neutrality.
A decade of carbon neutrality
In 2007, Google committed to being carbon neutral, and we’ve met this goal
every year since then. We reach carbon neutrality via three steps. First, we
work to reduce our total energy consumption by pursuing aggressive energy-
efficiency initiatives. Second, we match 100% of the electricity consumption
of our operations with purchases of renewable energy. Third, we buy carbon
offsets for any remaining emissions we haven’t yet eliminated.28
Figure 10
CARBON INTENSITY PER UNIT OF REVENUE
$110.9
50 — billion — 120
40 —
BILLION US$
tCO2e/MILLION US$
— 83
30 —
20 —
— 47
l Carbon intensity
10 —
5.2 l Total revenue
2011 2012 2013 2014 2015 2016 2017
Figure 11
CARBON INTENSITY PER FTE EMPLOYEE
60 — 75,750 — 80
THOUSANDS
40 — — 60
tCO 2e/FTE
20 — — 40 l Carbon intensity
l Average FTE
7.6 employees
2011 2012 2013 2014 2015 2016 2017
Google Environmental Report 2018 Advancing renewable energy 30El Romero solar farm in Chile (80 MW for Google)
When we committed to carbon neutrality, we saw carbon offsets as an
interim solution. As we further improve our energy efficiency and procure
more renewable energy, our need for carbon offsets will continue to decrease.
When we do purchase carbon offsets, we follow stringent principles.
We invest in high-quality, third-party-verified offsets, including landfill gas
projects and animal waste management systems. All our offsets are additional,
meaning that the projects reduce GHG emissions that wouldn’t be reduced
through other incentives. We also ensure that the projects we invest in
are permanent sources of carbon reduction or sequestration, rather than
temporary solutions. Finally, whenever possible, we invest for the long term,
which offers owners and developers the financial stability they need to
continue operating.
Google has been carbon neutral for more than a decade, and in that time,
we’ve partnered with more than 40 carbon offset projects to offset more
than 17 million tCO2e.29 We look forward to continuing to work toward net
zero carbon in the decade to come.
LEARN MORE
2011 white paper: Google’s Carbon Offsets: Collaboration and Due Diligence
2017 white paper: 10 Years of Carbon Neutrality
2017 spotlight: Capturing Value from Waste in Upstate New York
Google Environmental Report 2018 Advancing renewable energy 31Spotlight
Unlocking access to corporate
renewable energy purchasing
in Taiwan
In many markets around the world, electricity providers don’t offer
renewable energy options to their customers. You’re stuck with whatever
kind of electricity they provide.
In 2015, Google began asking for something dramatically different for
our data center in Taiwan—the opportunity to buy renewable energy
directly from a specific generating facility. We did this both to mitigate
our carbon footprint and because renewable energy makes good business
sense. By purchasing electricity from renewable sources like wind and
solar, which have no fuel inputs, we can set a long-term fixed price
for power and gain access to an increasingly cost-competitive source
of electricity.
In January 2017, after two years of careful consideration, the Taiwanese
government amended its Electricity Act to allow direct renewable energy
purchasing for customers. The first of its kind in Asia, the legislation
represents a potentially seismic shift in Taiwan’s approach to energy—
and opens the door for companies looking to expand infrastructure while
advancing a clean energy future.
It’s also a prime example of how we champion clean energy policies and
market solutions around the world.
Read how we’re laying the groundwork for a clean energy future
Google’s data center in Singapore,
one of our two sites in Asia
Flares destroy methane gas at Oneida-Herkimer Regional Landfill in New
York.
Google Environmental Report 2018 Advancing renewable energy 32Creating
sustainable
workplaces
Central staircase in Google’s Fulton Market
office in Chicago, Illinois
Google Environmental Report 2018 33Overview
Americans spend roughly 90% of their time indoors, and much of that time
is spent at work.30 At Google, just as we focus on users when it comes to
designing our products, we also focus on users when creating healthy and
sustainable workplaces—from our Bay Area headquarters to our offices in
more than 160 cities spanning nearly 60 countries around the world. To do
so, we look for innovative ideas that deliver measurable results and can be
implemented at scale.
We start by applying industry-leading green building standards wherever
possible. By the end of 2017, over 1 million square meters (11.1 million square
feet) of Google office facilities had achieved LEED certification, with 28%
of our LEED-certified square footage achieving a Platinum rating and 56%
a Gold rating (see Figure 12).
We also have a strong focus on the material selections for our spaces
and work to ensure that they are safe for humans and the environment
throughout their life cycle. We believe an industry-wide transition to healthier
materials is on the horizon. Making safer materials the new norm will require
collective action across sectors, increased access to high-quality data that
assesses chemical hazards, a demand signal (from buyers like Google)
to material and product manufacturers, and advancements in recycling
technology and infrastructure.
We take a science- and community-driven approach to managing our
campuses, with the aim of restoring the local ecology while improving access
to the outdoors for Google employees and the surrounding community.
By the end of 2017, we had implemented our science-based Habitat Design
Guidelines on 84 acres across our Bay Area headquarters.
SUSTAINABLE WORKPLACES: BY THE NUMBERS
11.1 million
square feet LEED-certified
29 million
gallons avoided
78%
landfill diversion
33,000
tCO2e savings
By the end of 2017, over In 2017, we achieved a 15% In 2017, we reached a 78% By using Google shuttles in
1 million square meters reduction in potable water landfill diversion rate for our the Bay Area in 2017, we saved
(11.1 million square feet) of intensity at our Bay Area offices globally. 33,000 tCO2e emissions—
Google office facilities had headquarters, which is equivalent equivalent to taking 6,500 cars
achieved LEED certification. to avoiding the use of over off the road every day for a year
109 million liters (29 million or avoiding 152 million vehicle
gallons) of potable water. kilometers (95 million vehicle
miles) per year.
Google Environmental Report 2018 Creating sustainable workplaces 34Figure 12
CUMULATIVE LEED-CERTIFIED OFFICE SPACE
1.2 —
1,034,876 m2
1 —
28%
MILLION SQUARE METERS (m2)
0.8 —
0.6 —
56%
0.4 —
n Platinum
0.2 —
n Gold
16% n Certified and Silver
2012 2013 2014 2015 2016 2017
We reduce our water footprint by installing water-saving technologies
and using reclaimed water wherever possible. In 2017, we achieved a 15%
reduction in potable water intensity at our Bay Area headquarters, which is
equivalent to avoiding the use of over 109 million liters (29 million gallons) of
potable water. We also collaborated with WRI to analyze our water risk profile
using the WRI Aqueduct tool. Over the past year, we’ve evolved our approach
to global goal setting to focus on the highest-impact opportunities. We’re
now targeting our work at Google offices in highly water-stressed locations
and in offices that are supported by recycling and composting infrastructure.
We implement strategies to minimize contamination in our office waste
streams and identify diversion pathways that keep the waste we do generate
out of landfills. In 2017, we reached 78% landfill diversion for our offices
globally and reduced landfill waste per Googler by 4% at our Bay Area
headquarters. We tracked waste generation for global offices that represent
42% of Google’s total headcount.
Google Environmental Report 2018 Creating sustainable workplaces 35Our cafés and Food Spots offer nutritious, responsibly sourced meals,
In 2017, we avoided snacks, and beverages.31 We make thoughtful choices in the products we
more than
1 million
buy and the suppliers we buy them from. Our sustainability priorities include
food waste prevention, sustainable hydration initiatives to encourage the
use of reusable vessels for drinking water, and promoting balanced, plant-
forward offerings—all of which help reduce our environmental impact and
support the well-being of our users. We compost and donate leftover food
kilograms of food waste
wherever we’re legally able to do so, but we’ve learned that the best way to
in our cafés around
reduce food waste is to prevent it in the first place by tracking data and using
the world. it to make adjustments. In 2017, this sort of data-driven optimization helped
Google avoid more than 1 million kilograms (2.3 million pounds) of food waste
in our cafés around the world.
Our Transportation team works to make commuting and campus mobility
a stress-free part of every employee’s day. We set ambitious goals for
helping Googlers transition to shuttles, carpooling, public transit, biking, and
walking. In 2017, our Bay Area headquarters remained on track to meet our
long-term goal to reduce single-occupancy vehicle commuting to 45%. We
also achieved a design standard of providing approximately 10% of parking
with electric vehicle charging stations for new construction and tenant
improvement projects in the Sunnyvale portion of our Bay Area headquarters.
Our Google shuttle buses in the Bay Area produced savings of more than
33,000 tCO2e emissions—the equivalent of taking 6,500 cars off the road
every day for a year or avoiding 152 million vehicle kilometers (95 million
vehicle miles) per year.
Google has installed more than 2,000 electric vehicle
charging ports at our offices in the United States.
Google Environmental Report 2018 Creating sustainable workplaces 36You can also read