Epidemiology of Tick-Borne Encephalitis (TBE) in Germany, 2001-2018 - MDPI
←
→
Page content transcription
If your browser does not render page correctly, please read the page content below
pathogens
Article
Epidemiology of Tick-Borne Encephalitis (TBE) in
Germany, 2001–2018
Wiebke Hellenbrand 1 , Teresa Kreusch 1, *, Merle M. Böhmer 2 , Christiane Wagner-Wiening 3 ,
Gerhard Dobler 4 , Ole Wichmann 1 and Doris Altmann 5
 1   Immunization Unit, Robert Koch Institute, Seestraße 10, 13353 Berlin, Germany;
     HellenbrandW@rki.de (W.H.); WichmannO@rki.de (O.W.)
 2   Department for Infectious Disease Epidemiology, Bavarian Health and Food Safety Authority,
     Veterinaerstr. 2, 85764 Oberschleissheim, Germany; Merle.Boehmer@lgl.bayern.de
 3   State Health Office Baden-Wuerttemberg, Nordbahnhofstr. 135, 70191 Stuttgart, Germany;
     Christiane.Wagner-Wiening@rps.bwl.de
 4   Bundeswehr Institute of Microbiology, Neuherbergstrasse 11, 80937 Munich, Germany;
     gerharddobler@bundeswehr.org
 5   Infectious Disease Data Science Unit, Robert Koch Institute, Seestraße 10, 13353 Berlin, Germany;
     AltmannD@rki.de
 *   Correspondence: KreuschT@rki.de; Tel.: +49 (0)-30-18754-3577

 Received: 28 February 2019; Accepted: 22 March 2019; Published: 29 March 2019

 Abstract: We reviewed tick-borne encephalitis (TBE) surveillance and epidemiology in Germany,
 as these underlie public health recommendations, foremost vaccination. We performed descriptive
 analyses of notification data (2001–2018, n = 6063) according to region, demographics and clinical
 manifestations and calculated incidence trends using negative binomial regression. Risk areas were
 defined based on incidence in administrative districts. Most cases (89%) occurred in the federal states
 of Baden-Wurttemberg and Bavaria, where annual TBE incidence fluctuated markedly between 0.7–2.0
 cases/100,000 inhabitants. A slight but significantly increasing temporal trend was observed from
 2001–2018 (age-adjusted incidence rate ratio (IRR) 1.02 (95% confidence interval (CI): 1.01–1.04)),
 primarily driven by high case numbers in 2017–2018. Mean incidence was highest in 40–69-year-olds
 and in males. More males (23.7%) than females (18.0%, p = 0.02) had severe disease (encephalitis or
 myelitis), which increased with age, as did case-fatality (0.4% overall; 2.1% among ≥70-year-olds). Risk
 areas increased from 129 districts in 2007 to 161 in 2019. Expansion occurred mainly within existent
 southern endemic areas, with slower contiguous north-eastern and patchy north-western spread.
 Median vaccination coverage at school entry in risk areas in 2016–2017 ranged from 20%–41% in 4
 states. Increasing TBE vaccine uptake is an urgent priority, particularly in high-incidence risk areas.

 Keywords: Tick-borne encephalitis (TBE); epidemiology; incidence; risk areas; clinical manifestations;
 temporospatial distribution; vaccination; Germany

1. Introduction
      In Germany, infection with tick-borne encephalitis (TBE) virus (TBEV) is transmitted mainly by the
tick Ixodes ricinus. TBEV infection is asymptomatic or presents with non-specific symptoms, including
fever and malaise, in 70%–95% of cases [1,2]. The remainder develops neurological manifestations
ranging from uncomplicated meningitis to severe meningoencephalitis and/or myelitis [1–4]. TBE is
vaccine-preventable, with two highly effective vaccines based on the European TBEV subtype available
in Europe [5,6].
      Serological evidence for TBE in humans and mice in Germany was first reported by Sinneker in
various regions of Eastern Germany in 1959 [7], followed by serologic diagnosis of symptomatic TBE

Pathogens 2019, 8, 42; doi:10.3390/pathogens8020042                            www.mdpi.com/journal/pathogens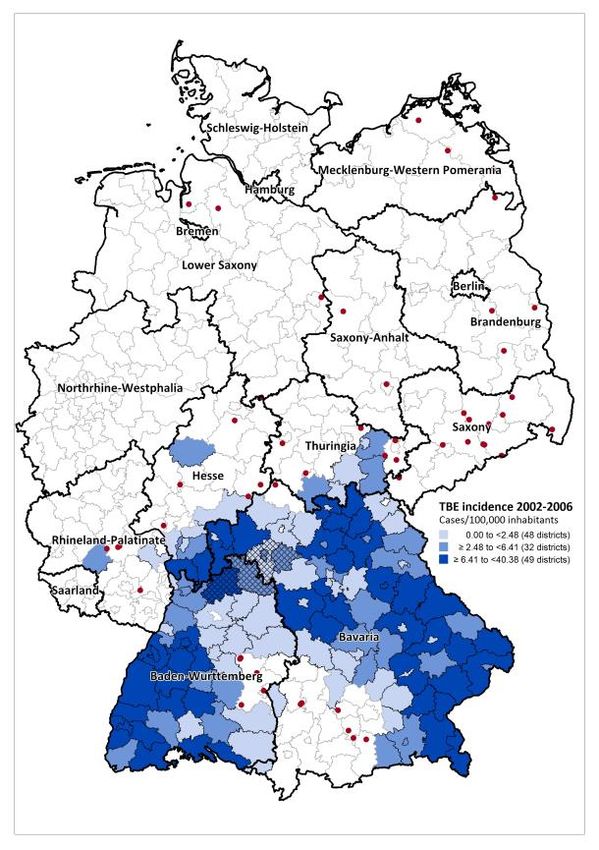
Pathogens 2019, 8, 42                                                                                 2 of 16

in humans 1960–1961 in Saxony [8,9]. Süss et al. [10,11] later reviewed TBE cases in Eastern Germany,
reporting 1200 cases ascertained from 1960 to 1970, many occurring during outbreaks related to the
consumption of raw milk. From 1960 to 1970, TBE incidence in Eastern Germany decreased from 0.7 to
0.02 cases/100,000 TBE cases/100,000 inhabitants, and only isolated TBE cases were ascertained in the
1970s and 1980s. However, after the reunification of Germany in 1990, isolated TBE cases were again
diagnosed in Eastern federal states, namely in Thuringia and Saxony [10]. TBE cases in Thuringia
occurred mainly in regions adjacent to existing Bavarian TBE risk areas and in Saxony adjacent to
known risk areas in the Czech Republic [12].
     In the Federal Republic of Germany, the first TBE case was described near Passau in Bavaria
in 1964 [13], with further case descriptions from Baden-Wurttemberg (BW) and Bavaria (BY) in the
1960s and 1970s [13–17]. Ackermann described 149 and 51 TBE cases ascertained in southern Germany
from 1964 to 1977 [18] and 1978–1980 [19], respectively. Testing of 8526 residual laboratory sera
collected from 1980–1985 revealed neutralising TBE antibodies in 2% of sera from Bavaria and 1.1%
from Baden-Wurttemberg [19]. In the 1990s an increasing number of cases were reported from the
Odenwald region in northern Baden-Württemberg/southern Hesse, and sporadic cases from more
western regions in the Saarland and Rhineland-Palatinate [10,20–23].
     In the mid-1990s meetings with public health authorities were held in Germany leading to the
definition of administrative districts as TBE-risk areas based on numbers of TBE cases ascertained in
surveys [3,24]. In 1997 the National Immunization Technical Advisory Group (STIKO) recommended
vaccination for persons with tick-exposure in these risk areas [25]. A risk area was defined as a district
with at least 5 TBE cases in any 5-year period or with at least 2 cases in any one calendar year [24,26–28].
In 2001 TBE was made a statutorily notifiable disease according to the German Protection Against
Infection Act (IfSG). From 2001 to 2005, the data base was restricted to the respective preceding 20-year
period, with data for the years 1982–2001 originating from surveys and for 2002–2005 from statutory
surveillance [29–33]. The number of districts classified as risk areas increased from 55 in 1997 to 96 in
2006. This development occurred almost exclusively within a largely contiguous area spanning the
states of Bavaria, Baden-Wurttemberg, southern Hesse and southern Thuringia, with a further isolated
district each in mid-northern Hesse and Rhineland-Palatinate. As of 2007, risk areas were defined
using notification data only using an incidence-based approach [34].
     Surveillance provides the basis for public health recommendations–foremost vaccination–for TBE
prevention. Thus, we aim to review TBE surveillance and epidemiology in Germany from 2001 to 2018,
including the definition of TBE risk areas and their distribution over time as of 2007.

2. Results

2.1. Tick-Borne Encephalitis (TBE) Incidence, Seasonality, Demographics and Trends
     The majority of the 6,063 notified TBE cases from 2001–2018 originated in Baden-Wurttemberg
(BW) and Bavaria (BY) (89.0% of cases with a reported place of infection (PoI) in Germany), followed
by Hesse, Saxony, Thuringia, and Rhineland-Palatinate (Figure 1). All current risk areas but two (in
Saarland and Lower Saxony) are located in these states (see below). The annual number of reported
cases ranged from 195 to 583, the incidence in the two most affected states of BW and BY ranging from
0.7 to 2.0 cases/100,000 inhabitants (mean 1.2), with peaks in 2005–2006, 2011, 2013 and 2017–2018
(Figures 1 and 2). Increases in incidence did not follow a uniform pattern. For instance, the increase in
2005 was more marked in BY, while the further increase in 2006 occurred almost entirely in BW and
Hesse (Figure 1) with case numbers in BY decreasing slightly, although remaining markedly above
average. The peaks in 2011, 2013 and 2017 were due to increases in both BW and BY, while the peak in
2018 again occurred due to a further increase in BW, despite a slight decrease in case numbers in BY, as
in 2006. Of the 222 cases reported with the PoI exclusively outside of Germany, 177 (79.7%) were from 6
countries (Austria (94), Czech Republic (20), Poland (17), Switzerland (16), Sweden (16) and Italy (14)).
Pathogens
Pathogens 2019, 8, 42 2018, 7, x FOR PEER REVIEW 3 of 16 3 of 17
Pathogens 2018, 7, x FOR PEER REVIEW 3 of 17
.
.
Figure 1.tick-borne
Figure 1. Notified Notified tick-borne encephalitis
encephalitis (TBE)
(TBE) cases (N =cases
6,063)(Naccording
= 6,063) according
to state of to state of(left
infection infection (left
Figureand
Y-axis) 1. Y-axis)
Notified tick-borne
and
incidence encephalitis
incidence
in (TBE)
and cases
in Baden-Wurttemberg
Baden-Wurttemberg (N
Bavaria, =Germany,
and 6,063) according
Bavaria, Germany,
2001–2018to (right
state of
2001–2018 infection (left
(right Y-axis).
Y-axis).
Y-axis) and incidence in Baden-Wurttemberg and Bavaria, Germany, 2001–2018 (right Y-axis).
Notified2. TBE
Figure 2. Figure casesTBE
Notified (N =cases
6,063)
(Naccording to month to
= 6,063) according and year and
month of disease
year ofonset, Germany,
disease onset, Germany,
2001–2018. Seasons
Figure 2. 2001–2018. with
Notified TBE lowest and
cases with
Seasons highest
(N =lowest case
6,063) and numbers
according
highesttocaseare
month highlighted
and year
numbers (2012: 195 cases;
of disease onset,
are highlighted 2018: 583 2018: 583
(2012: Germany,
195 cases;
cases). Q1–Q3 =
2001–2018.cases). quartile
Seasons 1–3, Min–Max
with=lowest
Q1–Q3 and
quartile = minimum–maximum.
highest
1–3, case =numbers
Min–Max are highlighted (2012: 195 cases; 2018: 583
minimum–maximum.
cases). Q1–Q3 = quartile 1–3, Min–Max = minimum–maximum.
Of all cases, 91.1%
Of all occurred
cases, from Mayfrom
91.1% occurred to October,
May to with 49.4%
October, occurring
with in June and
49.4% occurring July alone
in June and July alone
(Figure
Of2).
allPeak years were characterized by higher case numbers especially in these
(Figure 2). Peak years were characterized by higher case numbers especially in thesealone
cases, 91.1% occurred from May to October, with 49.4% occurring in Junetwo
andmonths,
July but months,
two
often additionally
(Figure 2).
butPeak by
oftenyearsextension of disease
were characterized
additionally by extension activity
byof into
higher late
case
disease summer
numbers
activity and early
intoespecially
late summer fall (2005,
in these 2006, 2013,
two months,
and early fall (2005, 2006,
and
but 2017). In 2018
often2013, andand
additionally to
byaInextension
2017). lesser extent
2018 and of in 2011, activity
to disease
a lesser cases occurred
extent ininto earlier
late
2011, thanand
summer
cases occurredaverage.
early fall
earlier than(2005, 2006,
average.
2013, and 2017).
TBEInincidence
2018 and was
to a lesser
higherextent in 2011,
in males (63.5% cases occurred
of all earlier
cases) than than average.
in females in all age groups (Figure
TBE3).
incidence
Incidencewas higher
was in males
highest (63.5%
in adults agedof40
alltocases) thanpeaking
69 years, in females
at ainyounger
all age groups (Figure (median
age in women
3). Incidence was highest in adults aged 40 to 69 years, peaking at a younger age in women (median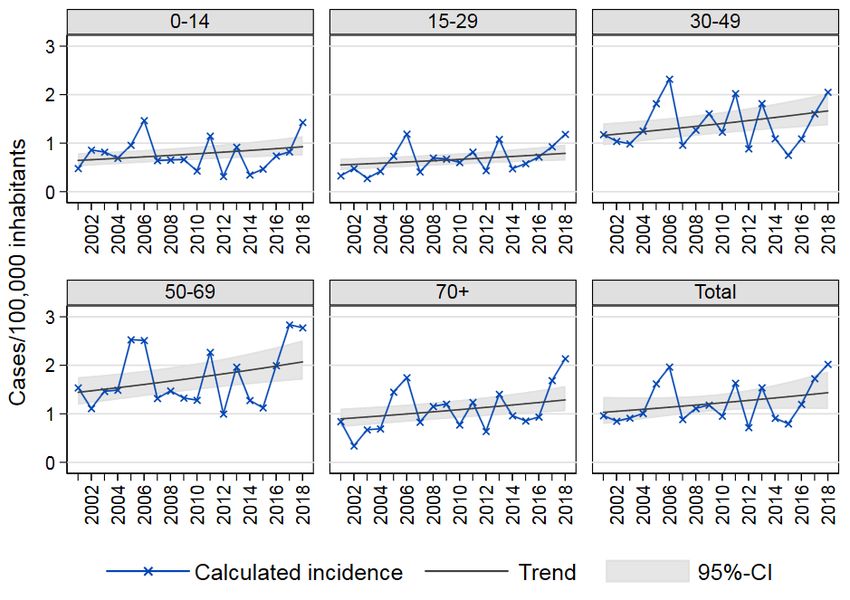
Pathogens 2019, 8, 42 4 of 16
TBE incidence was higher in males (63.5% of all cases) than in females in all age groups (Figure 3).
Pathogens 2018, 7, x FOR PEER REVIEW 4 of 17
Incidence was highest in adults aged 40 to 69 years, peaking at a younger age in women (median age:
47 years (interquartile range (IQR): 34–58) than in men (median age 49 years (IQR: 36–62, p = 0.0001
age: 47 years (interquartile range (IQR): 34–58) than in men (median age 49 years (IQR: 36–62, p =
(Kruskal–Wallis test), Figure 3).
0.0001 (Kruskal–Wallis test), Figure 3).
2.5
Notified TBE cases/100,000 inhabitants
2.0
1.5
2.22
1.0 2.01
1.77 1.74
1.48
1.20 1.17 1.15
1.09 1.04
0.5 1.03
0.78 0.83 0.81
0.69 0.75 0.75
0.55 0.48 0.48 0.51
0.43 0.44
0.31
0.0
female
female
female
female
female
female
female
female
female
female
female
female
male
male
male
male
male
male
male
male
male
male
male
male
0-4 5-9 10-14 15-19 20-24 25-29 30-39 40-49 50-59 60-69 70+ Total
Age (years) .
Figure 3. Mean annual incidence of notified TBE cases per 100,000 inhabitants according to sex (blue:
Figure
dark 3. Mean
male; light annual incidence
blue: female), of notified TBE cases
Baden-Wurttemberg andper 100,000
Bavaria, inhabitants
Germany, according
2001–2018 (n =to4977).
sex (blue:
dark male; light blue: female), Baden-Wurttemberg and Bavaria, Germany, 2001–2018 (n = 4977)
Analysis of age-specific and total TBE incidence over time in the two most affected states BY and
Analysis
BW showed of age-specific
marked and total with
annual fluctuation TBE aincidence over timetemporal
slightly increasing in the two most
trend fromaffected
2001 to states
2018BY of
and BW showed marked annual fluctuation with a slightly increasing temporal
2% (95% confidence interval (CI) 0.8%–3.6%) annually (Figure 4). We examined possible differences trend from 2001 to
2018 ofage-specific
among 2% (95% confidence interval (CI)
trends by including 0.8%–3.6%)
interaction termsannually (Figurebinomial
in our negative 4). We examined
regressionpossible
model,
differences among age-specific trends by including interaction terms in our
but found no significant improvement using the likelihood ratio test. Thus, the final model assumes negative binomial
aregression model,
uniform trend forbut found
all age no significant
groups. The seasons improvement
2017 and 2018 using
hadthe likelihood
unusually ratio
high test.
case Thus, the
numbers; in
final model assumes a uniform trend for all age groups. The seasons 2017
particular, TBE incidence was higher than in previous peak years among 50- to 69-year-olds and inand 2018 had unusually
highamong
2018 case numbers;
those 70 in particular,
years and older TBE incidence
(Figure was higher
4). Therefore, than in previous
we repeated these trendpeak years using
analyses amongonly 50-
to 69-year-olds
data and in
from 2001–2016 and2018 among
found those 70 years
no significant trendand older (Figure
(incidence 4). (IRR):
rate ratio Therefore, we repeated
1.00, 95% these
CI: 0.97–1.03).
trend analyses using only data from 2001–2016 and found no significant trend
Thus, a decrease in case numbers in the near future, as would be in keeping with the fluctuations (incidence rate ratio
of
previous years, might lead to loss of the significantly increasing trend observed from 2001 to 2018. in
(IRR): 1.00, 95% CI: 0.97–1.03). Thus, a decrease in case numbers in the near future, as would be
keeping with the fluctuations of previous years, might lead to loss of the significantly increasing
trend observed from 2001 to 2018.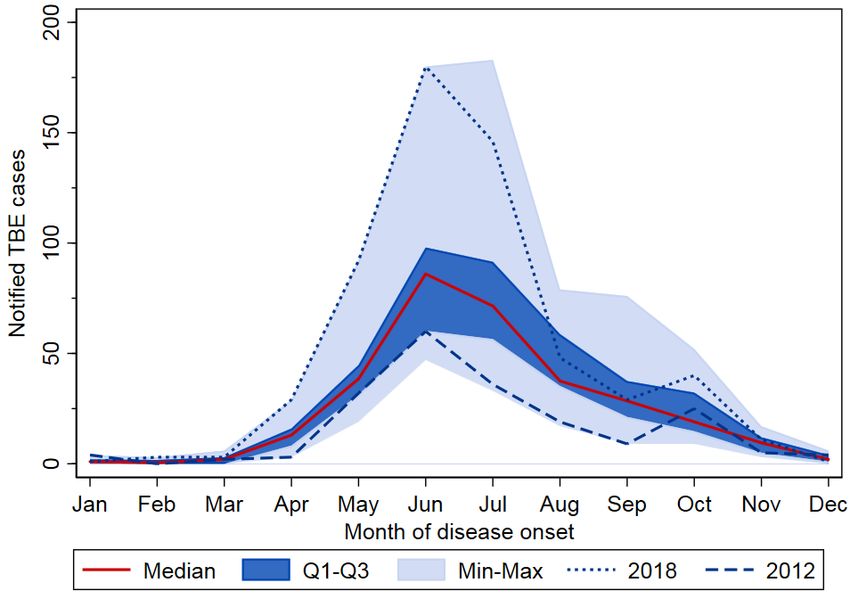
Pathogens 2019, 8, 42 5 of 16
Pathogens 2018, 7, x FOR PEER REVIEW 5 of 17
Figure 4. Age-specific TBE incidence Baden-Wurttemberg and Bavaria, Germany, 2001–2018, and
Figure
trends 4. Age-specific
as estimated TBE incidence
in an age-adjusted Baden-Wurttemberg
negative and model:
binomial regression Bavaria,Total
Germany, 2001–2018,
incidence rate ratioand
trends
(IRR): 1.02,as estimated
95% in aninterval
confidence age-adjusted negative binomial regression model: Total incidence rate ratio
(CI): 1.01–1.04.
(IRR): 1.02, 95% confidence interval (CI): 1.01–1.04.
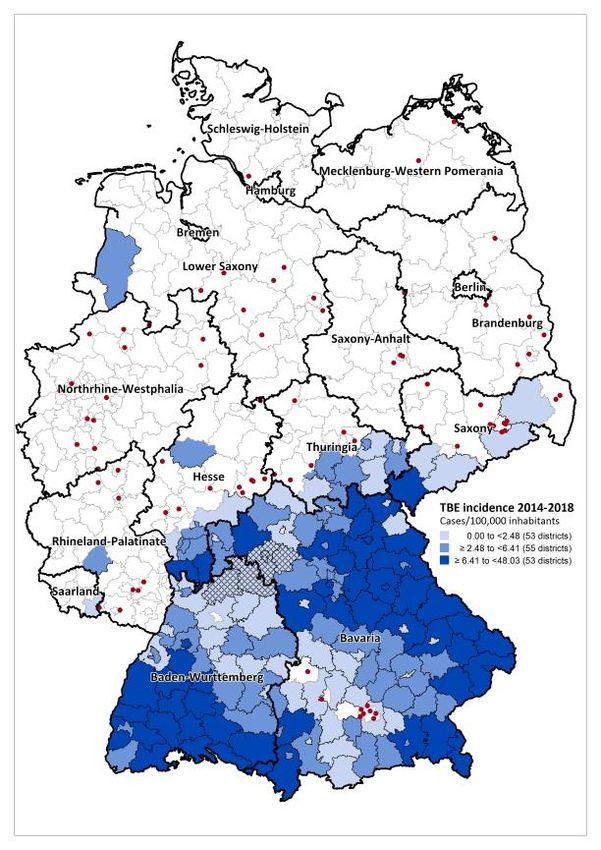
2.2. TBE Risk Areas
2.2.
In TBE
2007,Risk
129Areas
districts were classified as risk areas based on TBE cases notified from 2002–2006
(Figure 5a). By 2019,
In 2007, this hadwere
129 districts increased to 161
classified asdistricts
risk areasbased
basedon on
dataTBEfrom 2002
cases to 2018from
notified (Figure 5b).
2002–2006
Most additional risk areas border on previously existent ones in BW, BY, Hesse
(Figure 5a). By 2019, this had increased to 161 districts based on data from 2002 to 2018 (Figure 5b). and Thuringia. In recent
years marked
Most northeastward
additional risk areasexpansion
border onoccurred previouslyinto existent
Saxony, where
ones in4 BW,
districts
BY, have
Hesse been
andclassified
Thuringia.as In
riskrecent
areas since 2016. In addition, one district each in Saarland and in Lower
years marked northeastward expansion occurred into Saxony, where 4 districts have been Saxony were classified as
riskclassified
areas in 2010 andareas
as risk 2019, since
respectively
2016. In (Figure 2B). one
addition, TBE district
cases continued to be notified
each in Saarland and from almost
in Lower all
Saxony
districts
were ever classified
classified as TBE
as risk areas riskin areas
2010 at andleast
2019,sporadically,
respectivelywith the exception
(Figure 2B). TBE of cases
a marked decrease
continued to be
in incidence in 5 contiguous districts in northeastern BW/northwestern BY
notified from almost all districts ever classified as TBE risk areas at least sporadically, with the in recent years (Figure 5).
In these districts,
exception of five-year
a marked incidences
decrease ranged in from 2.0–8.0 in
incidence TBE5cases/100,000
contiguous inhabitants
districts in in 2002–2006,
northeastern
butBW/northwestern
decreased to 0 fromBY 2014–2018 in all but one district, where a single case with
in recent years (Figure 5). In these districts, five-year incidences rangedan additional possiblefrom
PoI2.0–8.0
was reported.
TBE cases/100,000 inhabitants in 2002–2006, but decreased to 0 from 2014–2018 in all but one
The median
district, whereincidence
a single casein thewithmost anrecent 5-yearpossible
additional interval PoI
2014–2018 in districts defined as risk areas
was reported.
was 3.7 cases/100,000 inhabitants, ranging from a minimum
The median incidence in the most recent 5-year interval 2014–2018 of 0 to a maximum of 48.0. defined
in districts Of the 1597
as risk
TBEareas
caseswas
reported
3.7 cases/100,000 inhabitants, ranging from a minimum of 0 to a maximum ofrisk
with a PoI in a risk area in this time period, 1132, or 70.9%, occurred the areas
48.0. Of the
with a TBE
1597 TBE incidence in the top
cases reported withtertile
a PoI(>=6.4
in a riskcases/100,000
area in thisinhabitants).
time period, Sporadic TBE cases
1132, or 70.9%, have been
occurred the risk
notified
areas in all federal
with states except
a TBE incidence thetop
in the citytertile
states (>=6.4
of Hamburg and Bremen.
cases/100,000 The dots
inhabitants). in Figure
Sporadic TBE5a,b
cases
portray sporadic cases with reported exposure in districts not classified as
have been notified in all federal states except the city states of Hamburg and Bremen. The dots inTBE risk areas in 2002–2006
(n =Figure
83) and 5a2014–2018 (n = 52),
and 5b portray respectively.
sporadic cases withOverreported
half of sporadic
exposure cases were notified
in districts from states
not classified withrisk
as TBE
riskareas
areasin (53.8%
2002–2006 (n = 83) and 2014–2018 (n = 52) , respectively. Over half of sporadic cases of
in 2002–2006 and 56.6% in 2014–2018, Figure 5a,b)). In 2002–2006, the distribution were
sporadic cases
notified fromheralded futurerisk
states with riskareas
areas(53.8%
in BY, BW and Saxony
in 2002–2006 and(Figure
56.6%5a). By 2014–2018,
in 2014–2018, an increasing
Figure 5a and 5b)).
number of sporadic
In 2002–2006, thecases occurred
distribution of in Lower Saxony
sporadic and Northrhine-Westphalia.
cases heralded future risk areas in BY, In both
BW and periods,
Saxony
isolated sporadic cases occurred in three eastern federal states Brandenburg,
(Figure 5a). By 2014–2018, an increasing number of sporadic cases occurred in Lower Saxony and Mecklenburg-Western
Pomerania and Saxony-Anhalt,
Northrhine-Westphalia. where
In both TBE had
periods, been endemic
isolated sporadicincases
the 1960s and 1970s
occurred (seeeastern
in three above).federal
states Brandenburg, Mecklenburg-Western Pomerania and Saxony-Anhalt, where TBE had been
endemic in the 1960s and 1970s (see above).Pathogens 2019, 8, 42 6 of 16
Pathogens 2018, 7, x FOR PEER REVIEW 6 of 17
(a) (b)
Figure 5. Districts defined as risk areas, Germany: (a) 2007 (n = 129, based on 1430 cases notified in
Figure 5. Districts
2002–2006); (b)defined
2019 (nas=risk
161,areas,
basedGermany:
on 5,090 (a) 2007
cases (n = 129,
notified inbased on 1430In
2002–2018). cases
2007,notified in 2002–
80 districts were
2006); (b) 2019 (n = 161, based on 5,090 cases notified in 2002–2018). In 2007, 80 districts were
defined as risk areas based on an elevated incidence in the district itself, 47 based on an elevated defined as
riskincidence
areas based on ‘district
in the an elevated incidence
region’ in the
only and district
2 based on itself, 47 based on
past definition (foran elevated
details, seeincidence
methods).inInthe
2019,
‘district region’ only and 2 based on past definition (for details, see methods). In 2019, 161 districts were
161 districts were defined as risk areas, 130 based on an elevated incidence in the district itself and 34
defined as risk areas, 130 based on an elevated incidence in the district itself and 34 based on an elevated
based on an elevated incidence in the ‘district region’ only and 2 based on past definition (see methods).
incidence in the ‘district region’ only and 2 based on past definition (see methods). Five districts in
Five districts in Rhineland-Palatinate were not classified as risk areas despite an elevated incidence
Rhineland-Palatinate were not classified as risk areas despite an elevated incidence in the associated
in the associated district region (see methods), since no case was ever reported there and they were
district region (see methods), since no case was ever reported there and they were separated from
separated from bordering TBE-endemic districts by the Rhine River, considered a plausible natural
bordering TBE-endemic districts by the Rhine River, considered a plausible natural boundary. Shading
boundary. Shading depicts districts classified as risk areas categorized according to TBE incidence
depicts districts classified as risk areas categorized according to TBE incidence 2002–2006 (a) and 2014–
2002–2006 (a) and 2014–2018 (b). Dots depict sporadic cases in non-risk areas in the same respective
2018 (b). Dots depict sporadic cases in non-risk areas in the same respective periods ((a): n = 51, (b): n = 83
periods ((a): n = 51, (b): n = 83 cases reported with a single known place of infection (PoI)). With
cases reported with a single known place of infection (PoI)). With the exception of one possible case (see
the no
text), exception
cases of one possible
were reported case
in (see
the text), no cases
5 hatched were reported
districts in the 5 hatched districts
(LK Neckar-Odenwald-Kreis, LK(LK
Neckar-Odenwald-Kreis, LK Main-Tauber-Kreis, SK Würzburg/LK
Main-Tauber-Kreis, SK Würzburg/LK Würzburg, and LK Kitzingen) from 2014–2018. Würzburg, and LK Kitzingen)
from 2014–2018.
2.3. Vaccination Coverage
2.3. Vaccination Coverage
Vaccination coverage in children at school entry in 2016/2017 in risk areas varied widely (Figure
Vaccination coverage in children at school entry in 2016/2017 in risk areas varied widely (Figure 6).
6). Median coverage was highest in Bavaria and Hesse and lowest in Baden-Wurttemberg. Although
Median
mediancoverage
coveragewas
was highest in Bavaria
significantly higher and Hesse
in risk areasand
withlowest
a TBE in Baden-Wurttemberg.
incidence Although
in the highest tertile in
median coverage was significantly higher in risk areas with a TBE incidence in the highest
the 5 year period 2012–2016 (39.4%) than in risk areas with lower TBE incidences (28.1%, Figure tertile
6), in
the 5 year
there wasperiod 2012–2016
substantial (39.4%) than in risk areas with lower TBE incidences (28.1%, Figure 6),
overlap.
there was substantial overlap.Pathogens 2019, 8, 42 7 of 16
Pathogens 2018, 7, x FOR PEER REVIEW 7 of 17
Figure 6. TBE vaccination coverage (VC, ≥3 doses) by federal state (Baden-Wurttemberg (BW),
Figure 6. TBE vaccination coverage (VC, ≥3 doses) by federal state (Baden-Wurttemberg (BW),
Bavaria (BY), Hesse (HE) and Thuringia (TH)) and TBE incidence category (high incidence: >6.4 TBE
Bavaria (BY), Hesse (HE) and Thuringia (TH)) and TBE incidence category (high incidence: >6.4 TBE
cases/100,000 inhabitants). VC in BY and HE ascertained in 2016, in BW & TH in 2017. Numbers
cases/100,000 inhabitants). VC in BY and HE ascertained in 2016, in BW & TH in 2017. Numbers in
in boxes = median VC. ** p < 0.007 and *** p = 0.0001, Kruskal–Wallis test. ‡ In BW, BY, HE and TH.
boxes = median VC. **p < 0.007 and ***p = 0.0001, Kruskal–Wallis test. ‡In BW, BY, HE and TH.
Fractions in brackets under x-axis: number of risk area districts/total number of districts in each state
Fractions
in 2017. in brackets under x-axis: number of risk area districts/total number of districts in each state
in 2017.
In the aforementioned 5 districts in northern BW and BY with a marked decrease in TBE incidence
In the aforementioned LK
(LK Neckar-Odenwald-Kreis, 5 districts in northernSK
Main-Tauber-Kreis, BW and BY withWürzburg,
Würzburg/LK a markedand decrease in TBE
LK Kitzingen),
incidence (LK Neckar-Odenwald-Kreis, LK Main-Tauber-Kreis, SK Würzburg/LK
vaccination coverage at school entry ranged from 31.5% to 48.6% and was thus no higher than in many Würzburg, and
LK Kitzingen),
other regions withvaccination
persistentcoverage
occurrence at school
of cases.entry ranged from 31.5% to 48.6% and was thus no
higher than in many other regions with persistent occurrence of cases.
2.4. Clinical Aspects
2.4. Clinical Aspects
Of the 1636 TBE cases reported from 2015 to 2018, 770 (47.1%) were reported with non-specific
Of theonly
symptoms 1636andTBE866cases reported
(52.9%) withfrom 2015 to 2018,
manifestations of770
the(47.1%)
central were
nervalreported
system with
(CNS) non-specific
(Figure 7).
symptoms
CNS only and were
manifestations 866 (52.9%) with manifestations
less frequently of the central
reported in female (50.7%)nerval
than insystem (CNS) (Figure
male (54.4%) 7).
cases, but
CNSwas
this manifestations were
not statistically less frequently
significant reported
(age-adjusted in female
odds (50.7%)
ratio (OR): 0.87,than
95%in CI:male (54.4%)Meningitis
0.71–1.06). cases, but
this reported
was was notinstatistically
31.5% of casessignificant
(females:(age-adjusted
30.8%; males:odds32.7%) ratio
and (OR): 0.87, 95%
encephalitis CI: 0.71–1.06).
or myelitis (with or
Meningitis
without was reported
meningitis) in 31.5%
in 21.5% of cases
(females: 18.0%;(females: 30.8%; pmales:
males: 23.6%, 32.7%)
= 0.024). and encephalitis
Myelitis or myelitis
was rare, reported only
(with
in or without
61 patients meningitis)
(3.7%), more often inin21.5%
males(females: 18.0%;
(4.5%) than males:
females 23.6%,
(2.6%, p = 0.024).
p = 0.05). Myelitis
The more severewas rare,
clinical
reported only encephalitis
manifestations in 61 patients (3.7%), more
or myelitis oftenmarkedly
increased in malesamong
(4.5%)cases
than aged
females (2.6%,
60 years p =older,
and 0.05).while
The
more
the severe clinical
proportion manifestations
with isolated meningitisencephalitis
decreased orinmyelitis increased
the older markedly
age groups (Figureamong cases< aged
7, p trend 60
0.0001).
yearsHospitalization
and older, while the proportion with isolated meningitis decreased in the older
was reported in 87.4% of cases notified from 2015 to 2018 (1,389/1,588 cases with age groups
(Figure 7, p trend
information < 0.0001).
available), lowest in children under 5 years of age (60.0%) and highest in patients 70
years and older (93.8%, p trend = 0.07). Persons reported with CNS symptoms were more likely to
be hospitalized (meningitis only: 93.2%; encephalitis or myelitis: 96.0%) than those without (79.5%,
p chi2 < 0.0001). Duration of hospitalization was available for 509 of these hospitalized cases (32.0%)
and was longer in patients with encephalitis or myelitis compared to patients with meningitis only
(median of 11 vs. 8 days, with 24.4% vs. 9.4% hospitalized >2 weeks (p < 0.0001)). Among cases with
non-specific symptoms the median duration of hospitalization was also 8 days with 14.7% requiring
hospitalization >2weeks.
Among the 6,035 cases notified from 2001 to 2018 with reported outcome, there were 25 deaths
(case-fatality: 0.4%). Case fatality was non-significantly higher in males (0.5%) than females (0.3%,
p = 0.38). Deaths occurred in patients aged 28 to 94 years, but 23 were in patients aged 54 years andPathogens 2019, 8, 42 8 of 16
older. Case-fatality increased with age, to 2.1% in persons 70 years and older (p trend < 0.0001). CNS
Pathogens 2018, 7, x FOR PEER REVIEW 8 of 17
manifestations were reported for all deaths except one case with missing information.
Figure 7. Notified TBE cases according to clinical manifestations, Germany, 2015–2018 (n = 1636).
Figure 7. Notified TBE cases according to clinical manifestations, Germany, 2015–2018 (n = 1636).
Complete information on vaccination status was available for 5678 (93.7%) of all cases. Of these,
Hospitalization was reported in 87.4% of cases notified from 2015 to 2018 (1,389/1,588 cases
75 (1.3%) were adequately vaccinated. A further 314 (5.5%) were inadequately vaccinated, of whom
with information available), lowest in children under 5 years of age (60.0%) and highest in patients
122 had received only one TBE vaccine dose, and the remainder two or more, but either too recently
70 years and older (93.8%, p trend = 0.07). Persons reported with CNS symptoms were more likely to
( 1/> 3/> 5 years, depending on dose number and age) to
be hospitalized (meningitis only: 93.2%; encephalitis or myelitis: 96.0%) than those without (79.5%, p
provide protection (for details, see methods). The proportion of cases with adequate vaccination status
chi2 < 0.0001). Duration of hospitalization was available for 509 of these hospitalized cases (32.0%)
was slightly higher among patients under the age of 15 (2.0%) and those 70 years or older (1.8%).
and was longer in patients with encephalitis or myelitis compared to patients with meningitis only
(median
3. of 11 vs. 8 days, with 24.4% vs. 9.4% hospitalized >2 weeks (p < 0.0001)). Among cases with
Discussion
non-specific symptoms the median duration of hospitalization was also 8 days with 14.7%
Our overview shows that TBE has become endemic in the majority of southern German districts,
requiring hospitalization >2weeks.
with slower contiguous north-eastern and more patchy north-western spread. The observed seasonal
Among the 6,035 cases notified from 2001 to 2018 with reported outcome, there were 25 deaths
variation and marked variability in regional and annual TBE incidence in Germany is characteristic of
(case-fatality: 0.4%). Case fatality was non-significantly higher in males (0.5%) than females (0.3%, p
this disease, as evidenced by similar patterns reported from other European and European Free Trade
= 0.38). Deaths occurred in patients aged 28 to 94 years, but 23 were in patients aged 54 years and
Association (EFTA) countries [35,36]. Comparison of absolute TBE incidence in Germany with that
older. Case-fatality increased with age, to 2.1% in persons 70 years and older (p trend < 0.0001). CNS
in other countries is difficult due to differences in surveillance systems, case definitions, vaccination
manifestations were reported for all deaths except one case with missing information.
coverage as well as marked regional differences in TBE incidence within countries [35,37–39]. For
Complete information on vaccination status was available for 5678 (93.7%) of all cases. Of these,
instance, in 2012, 9 of 20 countries included only cases with neurological manifestations in their TBE
75 (1.3%) were adequately vaccinated. A further 314 (5.5%) were inadequately vaccinated, of whom
case definition, while others, like Germany, include cases with non-specific symptoms as well [35].
122 had received only one TBE vaccine dose, and the remainder two or more, but either too recently
Nonetheless, as summarized in a recent European Centre for Disease Prevention and Control (ECDC)
( 1/> 3/> 5 years, depending on dose number and age) to
publication, annual TBE incidences reported from 2012 to 2016 were markedly higher in the Baltic
provide protection (for details, see methods). The proportion of cases with adequate vaccination
States (9.5–15.6 cases/100,000 inhabitants), Slovenia (7.0) and the Czech Republic (4.8), followed by
status was slightly higher among patients under the age of 15 (2.0%) and those 70 years or older
Sweden and Slovakia (both 2.4), with other countries reporting TBE incidences under 1 case/100,000
(1.8%).
inhabitants, i.e. comparable to or lower than those in southern Germany [39].
Reasons for the observed annual variations in incidence, including the marked increase in the
3. Discussion
most recent seasons 2017 and 2018, are likely multifactorial and interdependent, related to climatic
Our overview
conditions, variationsshows that
in both tickTBE hasasbecome
as well endemic inTBEV
host populations, the prevalence
majority ofinsouthern
ticks andGerman
human
districts, with slower contiguous north-eastern and more patchy north-western spread.
behavior. Within endemic areas, however, social and behavioural factors that increase human exposure The
observed seasonal variation and marked variability in regional and annual TBE incidence
to ticks appear to be the most important determinants of TBE incidence [40–42]. For instance, Randolph in
Germany
et is characteristic
al. [43] showed of abundance
similar tick this disease, as evidenced
in regions by similar
with very high TBEpatterns reported
incidence in 2006,from other
but much
European and European Free Trade Association (EFTA) countries [35,36]. Comparison of
lower incidence in 2007, despite differing weather conditions in the two years. Thus the most likely absolute
TBE incidence in Germany with that in other countries is difficult due to differences in surveillance
systems, case definitions, vaccination coverage as well as marked regional differences in TBE
incidence within countries [35,37–39]. For instance, in 2012, 9 of 20 countries included only cases
with neurological manifestations in their TBE case definition, while others, like Germany, includePathogens 2019, 8, 42 9 of 16
explanation put forward for the incidence spike in 2006 was weather-related human activity, such as
mushroom foraging as described in the Czech Republic in 2006 [44].
The demographic distribution of notified TBE cases in Germany is similar to other reports of
higher TBE risk in older adults and in males of all age groups [1,45]. The prevalence of antibodies
against Borrelia burgdorferi, the cause of Lyme Disease—likewise transmitted mainly by I. ricinus in
Germany—was also higher in males (5.5%) than females (4.1%) in Germany from 2003–2006 [46]. This
suggests more frequent tick exposure on the part of boys and men, perhaps related to specific outdoor
activities or occupations. On the other hand, in a seroprevalence study performed from 1980–1985
using a TBE-specific neutralization test on residual sera from clinical laboratories obtained from 8526
patients in TBE endemic regions [19], seropositivity increased with age, but there was no difference
between men and women. This would suggest that TBE infection in males is more likely to lead to
symptomatic, and thus ascertainable disease. In fact, we did observe a more severe disease course in
male vs. female cases in our data. Sex-specific seroprevalence was unfortunately not reported in a
number of similar more representative, albeit smaller, recent studies performed in Germany [47] or
Scandinavia [48,49]. Thus further seroprevalence studies with test systems differentiating between
infection-induced versus vaccine-induced antibodies would be useful.
From 2001 to 2018, we found a slight—2% annually—but significantly increasing trend in TBE
incidence. This was primarily due to the high case numbers in 2017 and 2018, as evidenced by the
absence of an increasing trend from 2001–2016. Due to the fluctuating nature of TBE incidence, only
future seasons will show whether this may be the beginning of a sustained upward trend.
From 2007 to 2018, the number of districts classified as TBE risk areas increased from 129 to 161.
Most newer risk areas bordered on existent ones in BW, BY, Hesse and Thuringia. The most notable
recent developments were first-time risk areas in Saarland (2010), Saxony (2016) and Lower Saxony
(2019). Mean annual incidences from 2014 to 2018 varied widely among risk areas, ranging from 0 to
9.6 cases/100,000 inhabitants. A sustained decrease in TBE incidence in recent years was observed
in a region consisting of 5 districts in norther BW and BY, despite only low to moderate vaccination
coverage. We recommend further investigation of local climatological or ecological changes to identify
factors advantageous or disadvantageous to circulation of TBEV in new endemic areas or areas with
sustained elimination, respectively.
Over half the sporadic autochthonous cases reported from non-risk areas in the past five
years clustered around extant risk areas in Bavaria, and Hesse, Thuringia and Rhineland-Palatinate.
However, the remainder occurred in Lower Saxony, where one district was classified as a risk area
for the first time in 2019, in Northrhine-Westfalia and in the Eastern federal states of Brandenburg,
Mecklenburg-Western Pomerania and Saxony-Anhalt (Figure 5b). In the latter, TBE was endemic
in the 1960s [10,11]. In Lower Saxony, TBEV was detected in ticks in areas reported as the PoI [50]
in several cases. In addition, serological TBE-antibody monitoring of forestry workers revealed
asymptomatic seroconversions in 9 unvaccinated workers from 2006–2014 (total blood samples tested:
4609), although no clinical cases were detected [51]. TBE emergence with 2 TBE cases detected in
2016 was also recently described in the adjacent Netherlands, which borders on Lower Saxony and
Northrhine-Westphalia [52–54].
Nonetheless, the majority of all cases occurred in southern Germany, even though the main TBEV
vector I. ricinus is endemic throughout Germany. Reasons for this remain poorly understood. TBEV
prevalence in I. ricinus in southern Germany is low, most oftenPathogens 2019, 8, 42 10 of 16
where climatic conditions favour the simultaneous feeding of these two immature tick stages [61].
Although this may help explain the TBE distribution in Germany, no data on tick synchrony or analyses
of climate differences between endemic and non-endemic regions are thus far available to provide
definitive evidence.
The primary goal of defining TBE risk areas in Germany was to provide an overview of districts
in which preventive measures, primarily vaccination, should be implemented and to visualize TBE
spread over time (Figure 5a,b). The advantages of our incidence-based approach to defining risk areas
based on surveillance data since 2002 and taking into account TBE incidence in neighbouring districts
include a relative stability of risk estimates in the face of small case numbers and possible uncertainty
regarding the exact PoI across district borders. Nonetheless, our approach has some limitations. Most
importantly, the use of administrative districts as the underlying geographic unit does not permit risk
assessment at the level of smaller geographic units, which might better reflect the patchy nature of
TBE foci. In addition, administrative reforms have led to amalgamation of smaller districts into larger
ones in recent years. Furthermore, TBE incidence in bordering areas of neighbouring countries is not
taken into account, in particular the relatively high incidence reported from Czech districts bordering
on Saxony [12]. Finally, if vaccination coverage should increase further, human cases would become
a poor correlate of infection risk. To some extent, these limitations are compensated for by the use
of notification data dating back until 2002 as well as by the low incidence threshold used to classify
districts as risk areas.
In the long term, however, complementary TBE risk indicators would be valuable. Monitoring
TBEV in ticks has occasionally been useful to confirm TBEV transmission in areas of low human
incidence, for instance in Mecklenburg-Western Pomerania [62] and Lower Saxony [50,63]. However,
as prevalence in ticks is usuallyPathogens 2019, 8, 42 11 of 16
be incomplete. We are investigating this further in an on-going case-control study with detailed
ascertainment of acute and long-term TBE manifestations in Germany within the TBENAGER
framework [65] (see above). In addition, we are planning a detailed analysis of clinical manifestations
in relation to vaccination status.
4. Materials and Methods
4.1. TBE Surveillance in Germany
TBE became statutorily notifiable in Germany in 2001, requiring transmission of case-based data
from local health authorities to the state and national levels according to a standardized case definition.
Fulfilment of the TBE case definition requires (either non-specific symptoms (at least 2 of the following:
chills, severe malaise, headache and muscle, limb or back pain) or signs of central nervous system
(CNS) infection (meningitis, encephalitis or myelitis separately or in combination)) and [laboratory
confirmation by means of either simultaneously elevated IgM and IgG TBE-specific antibodies in serum
or cerebrospinal fluid (CSF) or an increase in TBE-specific IgG antibodies in serum or the detection of
intrathecal antibody synthesis] [69]. However, until 2004, elevated IgM TBE-specific antibodies were
sufficient for laboratory confirmation [70].
Diagnosis is generally performed in peripheral laboratories. Commercially available enzyme-
linked immunosorbent assay (ELISA) test kits usually have a high validity in unvaccinated cases, but
can be false positive test among cases with prior vaccination [71]. From 2016 to 2018, we matched
statutory TBE surveillance data to results from confirmatory testing using immunofluorescence
testing for antibodies to TBE and other flaviviruses that was performed for a small proportion of
cases at the national TBE consultant laboratory. Of all notified cases, 5.3% (76/1417) were thus
additionally confirmed.
From 2001 to 2013 the following variables were reported regarding disease severity: presence or
absence of non-specific symptoms, meningitis/encephalitis or myelitis; hospitalization and outcome
(survived/died). From 2013 onwards meningitis and encephalitis were reported separately, although
stable nationwide implementation was not achieved until 2015. Therefore, clinical manifestations
were analyzed in detail for cases notified from 2015 to 2018 only. Information on vaccination status
included the total number of doses received and the date of last vaccination. Vaccine doses were
counted only if received at least 3 weeks prior to disease onset. Vaccination status was categorized as
adequate if patients had received either 2 or 3 doses with the second or third dose less than 1 year or
3 years, respectively, prior to disease onset. When 4 or more doses were reported, vaccination was
considered adequate if the last dose was receivedPathogens 2019, 8, 42 12 of 16
Station, TX, USA). We used an age-adjusted negative binomial regression model to estimate the
temporal TBE incidence trend from 2001 to 2018, calculating incidence rate ratios (IRR) and 95%
confidence intervals (CI). We compared proportions using the chi-squared test. P-values < 0.05 were
considered statistically significant.
4.2. Definition of Risk Areas
An incidence-based definition for TBE risk areas based on statutory surveillance data was
developed at RKI in 2006 in a consensus process involving TBE experts including microbiologists,
clinicians and epidemiologists for implementation in 2007 [34]. Administrative districts were retained
as the underlying geographic unit for risk area definition due to lack of more detailed geographic data
regarding PoI. In addition, TBE cases occurring in the area surrounding each district were incorporated
into the new definition to account for mobility of exposed persons as well as to achieve smoothing
between neighbouring districts. To accomplish this, TBE incidence was calculated in a second
geographic unit, the ‘district region’, consisting of the respective district plus all adjoining districts.
Differences in the variance of TBE incidence resulting from differences in underlying population size
in the respective districts/district regions were accounted for by applying a probabilistic approach [72].
Thus, a district was defined as a risk area if the incidence in the district or respective district region
was significantly above the chosen incidence threshold of 1 TBE case/100,000 inhabitants in any 5-year
period since 2002, meaning that the number of observed cases was significantly greater (p < 0.05
according to the Poisson distribution) than the number of cases required to reach the threshold
incidence given the population size (expected number). When 2 or 3 possible PoI were reported, 0.5 or
0.33 cases were assigned to the reported districts, respectively. If more than 3 PoI were reported, the
PoI was considered unknown.
In choosing an incidence cut-off, there was consensus that the majority of risk areas defined
prior to 2007 should be captured by the new approach. As it would be difficult to communicate
the disappearance of a perceived public health risk based solely on a change in definition, it was
decided to retain the risk status for any districts that might not be defined as risk areas with the new
approach. Furthermore, although incidence was considered a better measure of risk than absolute
case numbers, it was recognized that the population denominator would not accurately reflect the
number of persons at risk because some persons lack a risk for exposure and some are vaccinated.
Thus, calculated incidence would underestimate true risk as vaccination coverage increased, justifying
a lower rather than higher incidence cut-off. Taking these issues into account, an incidence cut-off of 1
TBE case/100,000 population/5 years was chosen, close to the nation-wide five-year incidence of 1.3 in
2002–2006. In a further expert consultation in 2011, it was decided that districts classified as TBE risk
areas would remain so for a period of at least 20 years.
4.3. Vaccination Coverage
TBE vaccination status (total doses received) is ascertained at school entry in 4 to 7-year-old
children by the district health department, which reports aggregate data to RKI via the state health
department according to the IfSG. Approximate vaccination coverage in risk areas was calculated as
the percentage of children who had received ≥3 doses of a TBE vaccine based on data received 2017
from the four states with the majority of TBE risk areas (BW, BY, Hesse and Thuringia, n = 251,825
children with vaccination records; 92.5% of all children examined).
5. Conclusions
TBE is endemic primarily in southern Germany, with a more recent contiguous north-eastward
spread into Saxony and more patchy spread to north-western regions. Within endemic regions, there is
marked temporal and geographical variation of TBE incidence. Despite some limitations, the definition
of risk areas has been helpful for formulating vaccination recommendations and monitoring the spreadPathogens 2019, 8, 42 13 of 16
of TBE in Germany. Increasing vaccination coverage especially in high incidence areas would markedly
decrease the number of infections.
Author Contributions: All authors contributed substantially to this paper as follows: conceptualization: W.H.,
D.A., T.K, O.W., and G.D.; methodology: W.H., D.A., T.K.; validation: T.K., D.A.; formal analysis: W.H., T.K., D.A;
investigation, all authors; data curation: all authors; writing—original draft preparation, W.H.; writing—review
and editing, all other authors; supervision: W.H., D.A., O.W.; project administration: W.H., D.A., T.K.
Acknowledgments: We thank the district and state-level health authorities for ensuring quality and transmission
of surveillance data to RKI. We thank the following colleagues for feedback and advice regarding TBE surveillance
and definition of TBE risk areas during expert consultations: Johannes Dreesmann and Masyar Monazahian,
Lower Saxony State Health Authority, Hannover; Ulrich Falk, Odenwaldkreis Health Authority, Erbach; Anja
Hauri and Helmut Uphoff, Hesse State Health Authority (Hessisches Landesprüfungs- und Untersuchungsamt
im Gesundheitswesen), Dillenburg; Stefan Hell, Department of Health at the Saarland Ministry of Health,
Social Affairs, Women and the Family, Saarbrücken; Sabine Schröder, Thuringian Food Safety and Consumer
Protection Authority (TLLV), Bad Langensalza; Rainer Oehme, Baden-Wurttemberg State Health Office (LGA),
Stuttgart; Martin Pfeffer, University of Leipzig; Emil Reisinger, Department of Tropical Medicine and Infectious
Diseases University of Rostock; Jochen Süss, Brehm-Gedenkstätte, Renthendorf, Reinhard Kaiser, Helios Klinikum
Pforzheim, Frank von Sonnenburg, Department of Infectious Diseases and Tropical Medicine, University of
Munich, Monika Rieger, Institute of Occupational Medicine, Social Medicine and Health Services Research,
University of Tubingen; Matthias Niedrig, Robert Koch Institute, Berlin. We also thank Matthias an der Heiden
(Robert Koch Institute, Berlin) for statistical support for the calculation of incidence trends.
Conflicts of Interest: The authors declare no conflict of interest.
References
1. Lindquist, L.; Vapalahti, O. Tick-borne encephalitis. Lancet 2008, 371, 1861–1871. [CrossRef]
2. Růžek, D.; Dobler, G.; Mantke, O.D. Tick-borne encephalitis: Pathogenesis and clinical implications.
Travel Med. Infect. Dis. 2010, 8, 223–232. [CrossRef] [PubMed]
3. Kaiser, R. Tick-borne encephalitis (TBE) in Germany and clinical course of the disease. Int. J. Med. Microbiol.
2002, 291, 58–61. [CrossRef]
4. Taba, P.; Schmutzhard, E.; Forsberg, P.; Lutsar, I.; Ljøstad, U.; Mygland, Å.; Levchenko, I.; Strle, F.; Steiner, I.
EAN consensus review on prevention, diagnosis and management of tick-borne encephalitis. Eur. J. Neurol.
2017, 24. [CrossRef] [PubMed]
5. Šmit, R.; Postma, M.J. Review of tick-borne encephalitis and vaccines: Clinical and economical aspects.
Exp. Rev. Vaccines 2015, 14, 737–747. [CrossRef] [PubMed]
6. WHO. Vaccines against tick-borne encephalitis: WHO position paper. WER 2011, 86, 241–256. Available
online: http://www.who.int/wer/2011/wer8624.pdf (accessed on 18 March 2019).
7. Sinnecker, H. Zeckenencephalitis in Deutschland. Zbl. Bact. Orig. 1960, 180, 12–18.
8. Queisser, H. Beobachtungen über einige Fälle von Zeckenencephalitis in Deutschland. Münch. Med. Wschr.
1962, 47, 2288–2293.
9. Helpert, A.; Sinnecker, H. Ausgewählte Erhebungen zur Zeckenenzephalitis-Epidemie im Kreis Niesky,
Bezirk Dresden, 1961. Gesundheitswesen 1966, 21, 1277–1279.
10. Süss, J.; Schrader, C.; Falk, U.; Wohanka, N. Tick-borne encephalitis (TBE) in Germany—Epidemiological
data, development of risk areas and virus prevalence in field-collected ticks and in ticks removed from
humans. Int. J. Med. Microbiol. Suppl. 2004, 293, 69–79. Available online: http://www.sciencedirect.com/
science/article/B7W65-4GWT3V0-C/2/5b96a4106550bcd93e6cd0656a979907 (accessed on 18 March 2019).
[CrossRef]
11. Süss, J.; Sinnecker, H.; Sinnecker, R.; Berndt, D.; Zilske, E.; Dedek, G.; Apitzsch, L. Epidemiology and ecology
of tick-borne encephalitis in the eastern part of Germany between 1960 and 1990 and studies on the dynamics
of a natural focus of tick-borne encephalitis. Zent. Bakteriol. 1992, 277, 224–235. [CrossRef]
12. Kriz, B.; Maly, M.; Benes, C.; Daniel, M. Epidemiology of tick-borne encephalitis in the czech republic
1970–2008. Vector-Borne Zoonotic Dis. 2012, 12, 994–999. [CrossRef] [PubMed]
13. Stille, W.; Bauke, J. Zeckenenzephalitis in Westdeutschland [Tick-borne encephalitis in West Germany].
Münch. Med. Wschr. 1965, 107, 370–374. [PubMed]Pathogens 2019, 8, 42 14 of 16
14. Ackermann, R.; Rehse-Küpper, B.; Löser, R.; Scheid, W. Neutralisierende Serumantikörper gegen das Virus
der Zentraleuropäischen Enzephalitis bei der ländlichen Bevölkerung der Bundesrepublik Deutschland.
DMW-Dtsch. Med. Wochenschr. 1968, 93, 1747–1754. [CrossRef] [PubMed]
15. Ackermann, R.; Scheid, W.; Küpper, B. Infektion mit dem Virus der Zentraleuopäischen Enzephalitis.
DMW-Dtsch. Med. Wochenschr. 1966, 91, 1141–1143. [CrossRef]
16. Holzer, E. Zum Vordringen der Zentraleuropäischen Enzephalitis in Südbayern. Münch. Med. Wschr. 1976,
118, 1613–1614.
17. Rehse-Küpper, B.; Danielova, V.; Klenk, W.; Abar, B.; Ackermann, R. Epidemiologie der zentraleuropäischen
Enzephalitis in der Bundesrepublik Deutschland. Münch. Med. Wschr. 1976, 118, 1615–1616.
18. Ackermann, R.; Rehse-Küpper, B. Die Zentraleuropäische Encephalitis in der Bundesrepublik Deutschland.
Neurol. Psychiatry 1979, 47, 103–122.
19. Ackermann, R.; Krüger, K.; Roggendorf, M.; Rehse-Küpper, B.; Mörtter, M.; Schneider, M.; Vukadinović, I.
Die Verbreitung der Frühsommer-Meningoenzephalitis in der Bundesrepublik Deutschland. DMW-Dtsch.
Med. Wochenschr. 1986, 111, 927–933. [CrossRef]
20. Süss, J.; Falk, U. Der Odenwald—Ein FSME-Risikogebiet. Hess. Ärzteblatt 2000, 4, 128–131.
21. Kaiser, R. Epidemiologie und Verlauf der Frühsommer-Meningoenzephalitis in Baden-Württemberg
zwischen 1994 und 1999. DMW-Dtsch. Med. Wochenschr. 2000, 125, 1147–1153. [CrossRef]
22. Treib, J. First case of tick-borne encephalitis (TBE) in the Saarland. Infection 1994, 22, 368–369. [CrossRef]
23. Treib, J.; Haass, A.; Mueller-Lantzsch, N.; Ehrfeld, H.; Mueller-Rheiland, D.; Woessner, R.; Holzer, G.;
Schimrigk, K. Tick-borne encephalitis in the Saarland and the Rhineland-Palatinate. Infection 1996, 24,
242–244. [CrossRef]
24. Robert Koch-Institut. Aktuelle FSME-Risikogebiete in Deutschland. Epidemiol. Bull. 1997, 42, 294.
25. STIKO. Impfempfehlungen der Ständigen Impfkommission (STIKO) Stand: März 1997. Epidemiol. Bull. 1997,
15, 97–108.
26. Robert Koch-Institut. Verbreitung der Frühsommer-Meningoenzephalitis (FSME) in Deutschland und
Schlussfolgerungen für die Prävention. Epidemiol. Bull. 1998, 27, 193–195.
27. Robert Koch-Institut. Rioskogebiete der Frühsommer-Meningoenzephalitis (FSME) in Deutschland.
Epidemiol. Bull. 1999, 16, 115.
28. Robert Koch-Institut. Risikogebiete der Frühsommer-Meningoenzephalitis. Epidemiol. Bull. 2001, 16,
105–109.
29. Robert Koch-Institut. Risikogebiete der Frühsommer-Meningoenzephalitis (FSME) in Deutschland. Epidemiol.
Bull. 2002, 26, 212–215.
30. Robert Koch-Institut. Risikogebiete der Frühsommer-Meningoenzephalitis (FSME) in Deutschland: Aktualisierte
Darstellung auf der Basis der Daten für das Jahr 2002 (Stand 31.05.03). Epidemiol. Bull. 2003, 20, 155–159.
31. Robert Koch-Institut. Risikogebiete der Frühsommer-Meningoenzephalitis (FSME) in Deutschland. Epidemiol.
Bull. 2004, 21, 169–173.
32. Robert Koch-Institut. FSME: Risikogebiete in Deutschland. Epidemiol. Bull. 2005, 16, 137–143.
33. Robert Koch-Institut. Risikogebiete der Frühsommer-Meningoenzephalitis (FSME) in Deutschland [Tick-borne
encephalitis: Risk areas in Germany. Assessment of the regional disease risk]. Epidemiol. Bull. 2006, 17, 129–133.
34. Robert Koch-Institut. Risikogebiete der Frühsommer-Meningoenzephalitis (FSME) in Deutschland. Epidemiol.
Bull. 2007, 15, 119–135.
35. European Centre for Disease Prevention and Control. Epidemiological Situation of Tick-Borne Encephalitis in
the European Union and European Free Trade Association Countries; ECDC: Stockholm, Sweden, 2012; Available
online: http://ecdc.europa.eu/en/publications/publications/tbe-in-eu-efta.pdf (accessed on 18 March 2019).
36. Beauté, J.; Spiteri, G.; Warns-Petit, E.; Zeller, H. Tick-borne encephalitis in Europe, 2012 to 2016. Eurosurveillance
2018, 23. [CrossRef]
37. Donoso Mantke, O.; Escadafal, C.; Niedrig, M.; Pfeffer, M.; Working Group for Tick-Borne Encephalitis
Virus. Tick-borne encephalitis in Europe, 2007 to 2009. Eurosurveillance 2012, 16, 19976. Available online:
http://www.eurosurveillance.org/ViewArticle.aspx?ArticleId=19976 (accessed on 18 March 2019).
38. Stefanoff, P.; Polkowska, A.; Giambi, C.; Lévy-Bruhl, D.; O’Flanagan, D.; Dematte, L.; Lopalco, P.L.;
Mereckiene, J.; Johansen, K.; D’Ancona, F. Reliable surveillance of tick-borne encephalitis in European countries
is necessary to improve the quality of vaccine recommendations. Vaccine 2011, 29, 1283–1288. [CrossRef]You can also read