Equality in Employment - An equality analysis of the workforce and councillors of Herefordshire Council
←
→
Page content transcription
If your browser does not render page correctly, please read the page content below
Equality in Employment
An equality analysis of the workforce and
councillors of Herefordshire Council
January-December 2020
Introduction
Herefordshire Council is committed to employing a diverse workforce to help the
organisation understand and relate to the community we serve. It is a requirement of the
Equality Act 2010 that all public organisations with more than 150 employees publish the
diversity data of their workforce, and this is the tenth year that we have produced such an
analysis.
What is in this document?
Diversity profile of the Herefordshire Council workforce as at 31 December 2020
Diversity profile of our elected councillors
Gender pay gap report as at 31 March 2020
Ethnicity pay gap report as at 31 March 2020
How many people (non-school based) are employed by the council?
December 2020: 1,337
December 2019: 1,274
December 2018: 1,262
December 2017: 1,190
December 2016: 1,221
What’s going to happen to this report?
Externally: This report will be published on the council’s website, in order to comply with
the Public Sector Equality Duty.
Internally: This report will be available to all employees and used to raise awareness of the
need to record their information. It also provides baseline data to develop our workforce
plans.
If you would like help to understand this document, or would like it in
another format or language, please call the Information Compliance &
Equality team on 01432 260216 or e-mail diversity@herefordshire.gov.uk.
Page 1Diversity Profile of Herefordshire Council Workforce
The following statistics relate to Herefordshire Council employees, and were correct as at 31 December 2020.
The Census columns relates to the 2011 Census for Herefordshire. Some figures in these columns have been
rounded, and so may not sum. Some figures in these columns have been amalgamated for ease of use, and
should be used only as an indicative comparison.
Ethnicity
Number % Census % The approximate
Any other ethnic group 3 0.2 0.2 percentage of BAME
(Black, Asian & Other
Asian/Asian British - Any other 6 0.4 0.3
Minority Ethnic) people in
Asian/Asian British - Indian 7 0.5 0.3 Herefordshire’s working
Black/Black British - African 5 0.4 0.1 age population is 4.9%
Black/Black British - Caribbean 5 0.4 0.1 (source: 2011 Census).
Chinese 2 0.1 0.2 This compares to 6.7% of
the Council’s overall
Mixed - Any other 2 0.1 0.5
workforce.
Mixed - White & Asian 7 0.5 0.2
Of the 225 new starters
White - Any other 49 3.7 4.3
in 2020, 18 (8.0%)
White - Irish Traveller/Romany Gypsy 4 0.3 0.2 identified with an
Total BAME employees 90 6.7% 6.3% ethnicity other than
“White British”.
White - British 799 59.8 93.7
Prefer not to say 120 9.0 -
Information not obtained 328 24.5 -
Throughout this document,
the top 5% of earners is
2016 2017 2018 2019 2020 calculated by multiplying the
No. of BAME employees total workforce by 5%
5 4 3 7 9 (however the number is
in top 5% earners
rounded to include all
% BAME employees in
7.1% 6.5% 5.4% 10.9% 11.0% employees on the lowest
top 5% earners
grade in this group).
Nationality
Number % This table shows how the workforce identifies with a
Any other nationality 3 0.2 particular nationality. We have deliberately chosen to
British 269 20.1 amalgamate small groups so as not to identify any
individuals.
English 91 6.8
Irish 4 0.3
Other - Europe 8 0.6
Other - South East Asia 2 0.1
Other - Africa 2 0.1
Romanian 3 0.2
Scottish 4 0.3
Welsh 15 1.1
Prefer not to say 809 60.5
Information not obtained 127 9.5
Page 2Diversity Profile of Herefordshire Council Workforce
Religion and Belief
Number % Census % Our workforce’s identification with a
Agnostic 68 5.1 - particular religion or belief has stayed fairly
9.0 - static over several years.
Atheist 120
Buddhist 4 0.3 0.3 According to the 2011 Census, Christianity
remains the largest religion in Herefordshire
Christian 456 34.1 67.8 at 67.8%. It is also the largest religion in
Humanist 3 0.2 - England and Wales (59.3%).
Jewish 2 0.1 0.1 In 2011, 6.7% of the population of the West
Muslim 2 0.1 0.2 Midlands identified as Muslim – the second
No religion or belief 98 7.3 22.8 largest belief group. However in
Herefordshire, Buddhists remained the
Other 12 0.9 0.6
second largest group at 0.3%, which is
Sikh 3 0.2 0.0 reflected in our workforce.
Prefer not to say 452 33.8 -
Information not obtained 117 8.8 -
Marital Status
Number % Census % Statistics for same-sex marriage are not
Civil partnership 8 0.6 0.2 available, as they will be amalgamated with
heterosexual (opposite sex) marriage.
Divorced 27 2.0 9.6
Married 215 16.1 51.8 The “separated” category in the Census
2011 included people still legally married or
Separated 11 0.8 2.2
still legally in a same-sex civil partnership.
Single 106 7.9 28.3
The “divorced” category in the Census 2011
Widowed 2 0.1 7.9 included people who were formerly in a civil
Prefer not to say 834 62.4 - partnership which has since been dissolved.
Information not obtained 134 10.0 -
Sexual Orientation
Number % 2.0% of employees have identified as
Bisexual 5 0.4 lesbian, gay or bisexual (LGB), the same
figure as last year.
Gay 9 0.7
The proportion of the UK population
Heterosexual 788 58.9
identifying as lesbian, gay or bisexual (LGB)
Lesbian 13 1.0 was 2.2% in 2018 (source: ONS).
Prefer not to say 411 30.7
Information not obtained 111 8.3
Page 3Diversity Profile of Herefordshire Council Workforce
Disability
Number % Of the 82 top 5% of earners, 2 people (2.4%)
No 773 57.8 identified as disabled. In 2019 there were also 2
Yes 41 3.1 people, but the size of this cohort has increased,
therefore the percentage has reduced.
Prefer not to say 15 1.1
Information not obtained 508 38.0
2015 2016 2017 2018 2019 2020
No. disabled people as
4.4% 4.0% 3.4% 3.0% 3.2% 3.1%
% of workforce
No. disabled people as
4.4% 5.7% 4.8% 3.6% 3.1% 2.4%
% of top 5% earners
Roughly the same percentage of disabled employees work part-time, as non-disabled (29.3% and 30.5%
respectively).
The impairments noted by disabled employees cover a wide range of conditions, including sensory
impairment, mental ill health, mobility difficulties, progressive illness, and learning disability.
According to the 2011 Census, the working age population of Herefordshire with a “limiting long-term
illness” (often used as a proxy for disability), is 7.8% (8.4% in the West Midlands region).
Age
Number % Census % The largest age category of new starters in
Age 16-24 52 3.9 9.7 2020 was the 45-59 age group (35.1% of
5.3 all starters). 1.3% of new starters were
Age 25 to 29 100 7.5
aged 65 or over.
Age 30 to 44 413 30.9 17.9
The largest age category of leavers in 2020
Age 45 to 59 605 45.3 21.2 was also the 45-59 age group (37.0% of all
Age 60 to 64 125 9.3 7.4 leavers). 3.4% of leavers were aged 16-24.
Age 65 to 74 38 2.8 11.2 Herefordshire has an older age structure
Age over 74 4 0.3 7.2 than nationally, with people aged 65 and
over constituting 24.6% of the county’s
population, in comparison with 18.6%
across England and Wales (2019 mid year
The top 5% of earners can be categorised as below:
estimates).
Number
Age 30-44 21
Age 45-59 54
Age 60-64 7
Page 4Diversity Profile of Herefordshire Council Workforce
Sex
75.2% of the Council’s workforce is female. This is a
Number % Census % sharp contrast to the national workforce profile, where
Female 1,006 75.2 51 only 47% of all people in employment are female, however
it correlates with the national profile for public sector
Male 331 24.8 49
workers - two thirds (67.9%) of the total workforce in
public roles is female (source ONS, 2015).
As at 31 December 2020, the organisation had 418 part-
time employees. Of these, 90.0% were women.
2015 2016 2017 2018 2019 2020 Of the 82 top 5% earners,
47 (57.3%) are women.
No. women in The chart opposite shows
26 30 31 31 34 47
top 5% earners that the number of women
% women in top in this category has
38.2% 42.9% 50.0% 55.4% 53.1% 57.3%
5% earners continued to increase.
Grievances Disciplinary Proceedings
A grievance is a concern, problem or complaint that Disciplinary proceedings occur when an employee’s
has an effect on an individual’s work performance. performance, conduct or behaviour falls below
It is instigated by the individual employee expected standards, and it has not been possible to
concerned. resolve this by informal means.
In 2020 there were 6 grievances (there were 11 in In 2020 there were 11 disciplinaries (there were 16
2019) which can be analysed as follows: in 2019) which can be analysed as follows:
Sex Sex
Female 4 Female 9
Male 2 Male 2
Disability Disability
Information not obtained 6 No 4
Race Not stated 6
White British 1 Prefer not to say 1
Prefer not to say 1 Race
Information not obtained 4 White British 4
Age Prefer not to say 2
Aged 30-44 1 Information not obtained 5
Aged 45-59 4 Age
Aged 65 and over 1 Aged 16-24 1
Aged 30-44 3
There are no areas of concern highlighted in this Aged 45-59 5
data. Aged 60-64 1
Aged 65 and over 1
There are no areas of concern highlighted in this
data.
Page 5Summary and Analysis of Workforce Statistics
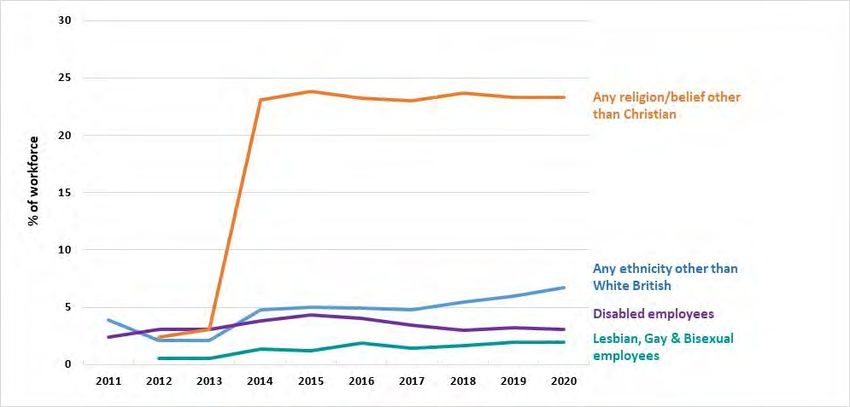
This is the tenth analysis of the diversity of our workforce, and the chart below details comparisons
in certain “protected characteristics” across those years. For each category, it indicates the
number of employees as a percentage of the total workforce. Unlike age and gender, which are
known characteristics for each of our employees, this is information which individuals are asked to
volunteer.
Notes:
1. The figure for religion/belief includes "no religion or belief".
2. In all categories, “preferred not to say” or “information not obtained” are disregarded.
3. Information on religion/belief and sexual orientation were not captured in 2011.
4. The ethnicity figure is calculated by subtracting the number of “White British” employees from the total workforce.
The figure therefore includes “White Other”.
5. The large increase in the religion/belief category from 2013-2014 is as a result of data cleansing, and not
indicative of a sudden change in employees.
The most notable issue in the analysis of our workforce is the relatively low number of disabled
employees. With only 3.1% of our workforce identifying as disabled (versus approximately 7.8% of
the county’s working age population), we do appear to have an under-representation of disabled
people, although some of this discrepancy could be as a result of under-reporting or people
choosing the option of “prefer not to say”.
Information on the top 5% of earners is collected only for age, sex, disability and ethnicity. Diverse
representation is good in each of these characteristics except for disability, which has fallen
consistently each year.
Representation of Black, Asian and Other Minority Ethnic employees (6.7%) in the council would
appear to be high in relation to Herefordshire’s working age population (4.9%). However the figure
of 4.9% is based on the 2011 Census, and it may look different when the 2021 Census data
becomes available.
Page 6Diversity Profile of Herefordshire Councillors
In May 2019 a new cohort of 53 councillors took office. Each was asked to identify their protected
characteristics, and 70% responded with this information. The following charts compare the diversity profile of
the 2019 cohort of councillors with those from 2015.
Sex Religion & Belief
2015 2019 2015 2019
Female 15 21 Agnostic/Atheist 5 0
Male 38 32 Christian 31 28
No religion or belief 5 14
Ethnicity Other 3 3
Prefer not to say 3 3
2015 2019 Information not obtained 6 5
White British 44 45
Any other background 0 1
Prefer not to say 1 0 Age
Information not obtained 8 5
2015 2019
Disability Age 25 to 44 8 3
Age 45 to 64 23 24
2015 2019
Age 65 to 74 18 15
No 40 40
Age 75+ 3 4
Yes 6 7
Prefer not to say 1 0
Prefer not to say 2 3
Information not obtained 0 7
Information not obtained 5 3
Marital Status Summary/Analysis
2015 2019 The percentage of female Councillors has increased
Divorced or separated 5 6 from 28.3% in 2015 to 39.6%.
Married 28 30 There is a slightly more diverse range of ethnicities
Single 6 5 and sexual orientation.
Other 3 4
Our Councillors are generally within older age groups
Prefer not to say 1 3 than our workforce.
Information not obtained 10 5
7 of the 2019 Councillors have identified as disabled.
At 13.2%, this is a significantly higher proportion than
National Identity across the workforce.
2015 2019 Diversity data was requested from every nominated
British and English 46 47 ward councillor (those who stood for election). 70% of
Welsh and Irish 2 2 nominees provided their data (98 in total). A
comparison of the data between nominees and
Other 2 0 elected councillors is shown below. It shows, for
Prefer not to say 0 1 example, that while only 30.6% of nominees were
Information not obtained 3 3 female, nearly 40% of the final elected councillors are
female. Conversely, while 13.3% of nominees were
aged 44 or younger, only 5.7% of the final elected
Sexual Orientation cohort are in this age group.
2015 2019 Female Disabled Age 16-44 BAME
Heterosexual 45 42
Nominees 30.6% 7.1% 13.3% 2.0%
Gay/Lesbian/Bisexual/Other 0 4
Prefer not to say 3 2 Elected 39.6% 13.2% 5.7% 1.9%
Information not obtained 5 5
Page 7Gender Pay Gap Report
Background
Since 2018, all public sector employers (with 250 or more employees) are required to annually publish
information about the difference between pay for male and female employees. This is called the gender
pay gap. The information provided on these pages is based on a snapshot of the data on 31 March 2020,
and complies fully with our statutory requirements. Gender pay calculations can be complicated, and we
have closely followed government recommendations.
Definition
The gender pay gap is different to equal pay. Equal pay relates to men and women receiving equal pay for
carrying out the same jobs, similar jobs or work of equal value. Not meeting this requirement is unlawful.
The gender pay gap is a measure of the difference in pay between the average earnings of males and
females. In line with government guidance, it is expressed as a percentage of men’s earnings.
Workforce profile
There were 1,379 relevant employees working for Herefordshire Council on the snapshot date of 31
March 2020, of whom 27.1% were male and 72.9% were female. The gender pay gap analysis is based
on head count, irrespective of the number of hours an employee works.
Results for Herefordshire Council
1. Overall mean and median gender pay gap
Mean hourly pay Median hourly pay
Female £14.68 £12.85
Male £15.70 £13.98
Pay gap (ie. women’s hourly pay is:) 6.5% lower 8.2% lower
2. The proportion of males and females receiving a bonus payment
7 employees received a payment relevant to this category during
the period under consideration (April 2019-March 2020). Whilst
the council does not pay employees a bonus as such, the
definition of a bonus for the purposes of this report includes
welcome payments, retention bonus for hard-to-fill posts, and
one-off honoraria awarded for a specific contribution. 0.60% 0.27%
(6 women) (1 man)
3. Mean and median bonus gender pay gap
Mean bonus pay gap Median bonus pay gap
Women’s bonus pay is: 29.4% lower 33.3% lower
Page 8Gender Pay Gap Report
4. Proportion of male and female rate of pay in quartiles
13.5% median pay gap 1.1% median pay gap 0.5% median pay gap -20.8% median pay gap
The graphs above illustrate the spread of male and female earners across the organisation. They show the
gender distribution across four equally sized quartiles, each containing around 345 employees. The
quartiles are determined by ranking the hourly rate of pay for each eligible male and female employee,
then dividing into 4 sections comprising an equal number of employees.
Comparison figures
In England and Wales, there is an overall median gender pay gap of 15.5% (source: Annual Survey of
Hours and Earnings, Office for National Statistics, 2020 provisional). This figure is across all industry
sectors and includes full and part-time workers. This shows that a woman, on average, earns around 85p
for every £1 earned by a man. The following ONS comparisons help to put Herefordshire Council’s data
further into context:
Type of Median pay gap (ie.
comparison women’s hourly pay is:
Herefordshire, all sectors 2020 (provisional) Geographic 6.1% lower
Herefordshire Council 2020 - 8.2% lower
UK public sector 2020 (provisional) Sector 15.8% lower
West Midlands, all sectors 2020 (provisional) Geographic 16.1% lower
Age group 40-49, UK, all sectors 2020 (provisional) Age 21.2% lower
Shropshire Council 2019 Sector 24.8% lower
Wye Valley Trust 2018 Geographic 25.0% lower
Summary
Herefordshire Council’s female employees are generally earning 8.2% less than male employees. This
means that a female employee, on average, earns around 92p for every £1 earned by a male employee.
Whilst this is a significant disparity, it is an improvement on the 2019 figure of 9.8% and the 2018 figure
of 12.8%.
In the lowest-paid quartile, women are paid 20.8% more than men, but in the highest-paid quartile, women
are paid 13.5% less than men. There is a large change to the lowest quartile from 2019, when women
were paid 30.6% more than men.
Bonus statistics for 2020 differ from the previous two years, in that women’s bonuses were lower than
men’s. It is important to note that the bonus figures are based on a very small number of people, and so
are easily distorted.
Page 9Ethnicity Pay Gap Report
Background
The ethnicity pay gap is a longstanding phenomenon. Previous research has shown that people from
ethnic minorities tend to earn less, overall, than White people. This is often associated with social
disadvantage and is arguably also caused by discrimination. New arrivals to the country may have a poor
command of English, possess qualifications which are not generally recognised by employers and be
unfamiliar with the UK's culture; these factors affect pay. Immigrants to Britain often work in low-paid
occupations and are overqualified for the job they do (Research by Equality & Human Rights Commission
2017).
Ethnicity pay gap reporting is not a statutory requirement, but some organisations are choosing to report it
voluntarily.
Definition
The ethnicity pay gap is defined as the difference between the average hourly pay of ethnic minorities and
White British people. It is usually expressed as a percentage difference, with White British people’s
earnings representing 100%.
Challenges
Analysis of pay by ethnicity is far more complex than the gender pay gap. There is firstly the difficulty that
can be associated with people identifying with a particular ethnicity. But further, initial research by the
EHRC has shown huge differences between different ethnicities, men and women of different ethnicities,
differences between those born in the UK and those born abroad, age groups, and employment types.
This initial, simplistic, benchmarking exercise for the workforce of Herefordshire Council will therefore be
of limited value, giving us a basic overview of the pay of different groups. A further difficulty for our
analysis is missing information. The table below shows the percentage of our workforce who have
identified with a particular ethnicity. Unlike the gender pay reporting, where the sex (gender) of each
employee is automatically captured on personnel records, ethnicity information is provided voluntarily by
individuals. 8.8% of people have deliberately indicated that they “prefer not to say”, which is a legitimate
choice. However 31.3% of people have not supplied information. There are many reasons why this might
be the case, and some work has gone on in 2020 to try to encourage people to provide the information.
Due to staff turnover, this is an on-going challenge.
% A further challenge of this exercise
Any Other Ethnic Group 0.2 within a workforce of 1,379 people is
Asian or Asian British 0.8 group sizes. Where there are
particularly small groups (eg. Chinese or
Black or Black British - African 0.2 Bangladeshi), data is more easily
Black or Black British - Caribbean 0.2 skewed and less statistically viable.
Despite the fact that this is likely to
Any mixed background 0.6 affect the value of the results, we have
White - Any other White background 3.4 chosen to amalgamate any groups
fewer than 3 people, so as not to
White – British 54.2 identify any individuals.
White - Gypsy, Romany, Irish Traveller 0.3
Prefer not to say 8.8
Information not obtained 31.3
Data correct as at 31 March 2020—these figures may differ from those
on page 2, which were correct as at 31 December 2020.
Page 10Ethnicity Pay Gap Report
Results
Median Pay gap (ie. this
hourly pay £ ethnicity’s hourly pay is:
Asian or Asian British 15.80 15.7% higher
White - Any other White background 15.35 12.4% higher
Black or Black British - Caribbean 14.91 9.2% higher
White - Gypsy, Romany, Irish Traveller 14.57 6.7% higher
Any mixed background 13.88 1.6% higher
White - British 13.66 -
Any Other Ethnic Group 12.85 6.0% lower
Black or Black British - African 12.85 6.0% lower
Prefer not to say 11.87 13.1% lower
Information not obtained 11.18 18.1% lower
Distribution of ethnicities across quartiles
The following table shows the distribution of ethnicities across four equally sized quartiles. The quartiles
are determined by ranking the hourly rate of pay for each eligible employee, then dividing into 4 sections,
each containing around 345 employees.
White All other Info Not
British ethnicities Obtained
Highest quartile (highest rate of pay) 55.1% 14.8% 30.1%
Upper middle quartile 60.6% 14.5% 24.9%
Lower middle quartile 60.9% 14.2% 24.9%
Lowest quartile (lowest rate of pay) 40.4% 14.5% 45.1%
Analysis
1. The most prominent result is the distribution of “all other ethnicities” across the four evenly sized
quartiles, which is a remarkably similar figure in each quartile.
2. Only two ethnicity categories are paid less than their White British counterparts; these are “Black or
Black British – African” and “any other ethnic group”.
3. Most minority ethnic groups earn less on average than White British people across English and Wales
(source: ONS 2019), though some groups earn more than their White British counterparts.
4. One group (Caribbean) is paid 9.2% more than their White British counterparts within the council.
However nationally they are calculated to earn 4% less than White British employees.
5. Other groups which are disadvantaged nationally include people of Pakistani and Bangladeshi origin.
Unfortunately, because of the need to amalgamate small datasets for our council results, it is not
possible to make a comparison.
Notes:
1. Only the most basic of analysis is possible for the Herefordshire Council figures. It is important that the many limitations in
our data is taken into account, most notably:
the need to amalgamate small groups (datasets)
smaller groups making it impractical to analyse further eg. by gender
missing information
2. Only a difference in pay that cannot be explained by characteristics such as qualifications and experience could be called
discrimination. In practice however, no study can take into account all characteristics that are valued in the labour market,
and measuring the existence or amount of discrimination in pay cannot be reliably achieved.
Page 11Issues arising from this document
Actions relating to the issues raised below can all be found within our Equality Policy 2020-2023.
1. Capture the diversity data of council employees
There is a need for us to improve the amount of diversity data collected from council employees
so that we have a clearer picture of the make-up of our workforce, and are better able to
highlight any anomalies. There are various reasons why data may not be available, eg:
the organisation has failed to request or capture it
an individual has not complied with a request to provide data, or actively chosen not to
provide it
The table opposite shows the number of Info not obtained 2018 2019 2020
employees where information has not
been obtained. It does not include: Marital status 52 17 134
Ethnicity 234 278 328
sex (gender) and age, as this Religion 3 521 117
information is automatically captured Sexual orientation 3 0 111
when someone is employed by the
Nationality 53 16 127
council
people who have actively chosen that Disability 423 459 508
they “prefer not to say” Percent not obtained 10.1% 16.9% 16.5%
The table shows that 16.5% of voluntary information has not been obtained (therefore 83.5% of
information has been obtained). Due to staff turnover this is an on-going challenge, and we
circulate regular communications to staff about the importance of them providing this
information.
2. Narrow the gender pay gap
Herefordshire Council’s female employees are generally earning 8.2% less than male employees.
Further analysis of the statistics is planned to identify any priority areas for work to address this.
3. Improve representation of disabled people in the workforce
There is a relatively low number of council employees identifying as disabled (3.1% of our
workforce).
4. Increase the diversity of our elected representatives
There are on-going activities within the council designed to increase the diversity of our
councillors and increase representation of minority groups.
Compiled by the Information Compliance & Equality Team, Herefordshire Council
www.herefordshire.gov.uk/diversity 01432 260216 diversity@herefordshire.gov.uk
Page 12You can also read