Equity Valuation of the EasyJet Company - Universidade ...
←
→
Page content transcription
If your browser does not render page correctly, please read the page content below
Equity Valuation of the
 EasyJet Company

 Ana Carolina Fonseca
 152418072

Dissertation written under the supervision of José Carlos
 Tudela Martins

Dissertation submitted in partial fulfilment of requirements for the MSc in
 Finance, at the Universidade Católica Portuguesa, June 15th 2020.
Abstract

EasyJet is a British low cost airline based in London Luton. The company carried more than 96
million passengers in FY19 and recorded a total revenue of £6.3 billion. Focused on their
customers’ satisfaction the company has followed key value such as, innovation, integrity, one
team, and above all safety.

The purpose of the current dissertation is to achieve the most accurate and robust value of
EasyJet’s equity value. Following this, the Discounted Cash Flow Method and Multiples
valuation approaches was applied, reaching a price per share of £6,51 on 30 June, 2020.

Furthermore, a sensitivity analysis was performed in order to understand the impact on the
company’s value on changing the expected crash in 2020 and the number of years necessary to
EasyJet recover to the levels before Covid-19 pandemic. Additionally, it was study the impact
on enterprise value by changing the WACC and the terminal growth rate.
Lastly, a comparison between the conclusion of current dissertation and the ones reached by
investment report’s analyst from Market Screener was made. The conclusion from the current
dissertation was that a recommendation to hold EasyJet shock.

 2
Resumo

A EasyJet é uma companhia área britânica cuja base está localizada no aeroporto de Luton em
Londres. No último ano, a empresa transportou mais de 96 milhões de passageiros e registou
um total de vendas no valor de £6,3 mil milhões. Focada na satisfação dos seus clientes, a
EasyJet rege-se por valores como, inovação, integridade, trabalho em equipa e segurança.
O objetivo da presente dissertação é de alcançar o verdadeiro valor de capital da empresa. Para
tal, foram efetuados os métodos dos Fluxos de Caixa Descontados e de avaliação Relativa
através dos Múltiplos, obtendo um valor por ação de £6,51 a 30 de junho de 2020.
De seguida foi efetuada uma análise de sensibilidade, cujo objetivo é estudar o impacto das
variações na percentagem total na queda das vendas em 2020 e no número de anos que a EasyJet
necessita para voltar aos níveis registados antes da pandemia do Covid-19. Adicionalmente,
também foi estudado o impacto de variações no WACC e na taxa de crescimento da economia.
Para concluir, foi efetuada uma análise comparativa entre as conclusões da presente dissertação
e aquelas que foram obtidas pelos analistas do relatório de investimento do Market Screener. A
conclusão da presente dissertação é a recomendação de manter as ações da EasyJet.

 3
Acknowledgments

Fistly, I would like to take this opportunity to express my gratitude towards Professor José
Carlos Tudela for his support and availability during the last months on this dissertation.

Secondly, I would like to express my profund gratitude to my parents and to my brother for
providing me with unfailing support, words of motivation and continuous encourgment through
this journey. This accomplishment would not have been possible without them. Thank you.

I would also to thank to my boyfriend and to my closer friends, who played a decisive role in
my life. I am thankful for their aspiring guidance, friendship, support and the words of
motivation in the last months.

Finally I would like to express a word of gratitude to all professors who made part of this
achievement.

 4
Contents Index

1.Introduction ............................................................................................................................. 9
2.Literature Review .................................................................................................................. 10
 2.1.Discounted Cash Flow Valuation Method ..................................................................... 10
 2.1.1.Free Cash Flow to the Firm and Free Cash Flow to Equity .................................... 11
 2.1.2.Ajusted Present Value .............................................................................................. 15
 2.2. Dividend Discount Model.............................................................................................. 16
 2.3. Economic Value Added ................................................................................................. 17
 2.4. Multiples Valuation ....................................................................................................... 18
 2.5. Conclusion ..................................................................................................................... 20
3. Business Overview ............................................................................................................... 20
 3.1. Key resources for EasyJet success ................................................................................ 21
 3.2. EasyJet Strategies ......................................................................................................... 22
 3.3. Dividend and shareholder’s policy ................................................................................ 24
4. Industry Overview .............................................................................................................. 25
 4.1. Full Services Airline vs Low Cost Carriers .................................................................. 26
5.Macroeconomic .................................................................................................................... 27
 5.1. Fuel ................................................................................................................................ 27
 5.2. Currency ........................................................................................................................ 30
 5.3. GDP ............................................................................................................................... 31
6. Financial Analysis ................................................................................................................ 33
 6.1. Operating Revenues ....................................................................................................... 33
 6.2. Operating Expenses ....................................................................................................... 36
 6.3. EBIT .............................................................................................................................. 39
 6.4. Capex and property, plant and equipment .................................................................... 40
 6.5. Debt................................................................................................................................ 41
 6.6 Effective Tax Rate .......................................................................................................... 41
7. Valuation .............................................................................................................................. 41
 7.1. Discounted Cash Flow ................................................................................................... 41
 7.1.1. Free Cash Flow to the Firm .................................................................................... 41
 7.1.2. Weighted Average Cost of Capital (WACC) ......................................................... 42
 7.1.3. Terminal Value ....................................................................................................... 43
 7.1.4. Estimated Price ....................................................................................................... 43
 7.2. Multiples Valuation ....................................................................................................... 44

 5
7.3. Sensitivity Analysis ....................................................................................................... 46
8. Equity Research Comparison ............................................................................................... 47
9. Conclusion ............................................................................................................................ 48
10. Appendixes ........................................................................................................................ 50
 10.1 Balance Sheet 2019-2024F ........................................................................................... 50
 10.2 Balance Sheet 2024F-2030F ......................................................................................... 51
 10.3 Income Statement 2019-2024F ..................................................................................... 52
 10.4 Income Statement 2024F-2030F .................................................................................. 53
 10.5 Total Seat Revenues 2019-2024F ................................................................................. 54
 10.6 Total Seat Revenues 2024F-2030F............................................................................... 54
 10.7 Cash Flow Statement 2019-2024F ............................................................................... 55
 10.8 Cash Flow Statement 2024F-2030F ............................................................................. 56
 10.9. Net Working Capital 2019-2024F ............................................................................... 57
 10.10. Net Working Capital 2024F-2030F ........................................................................... 58
 10.11. Impact of Brexit ......................................................................................................... 59
11. References ......................................................................................................................... 61

 6
Figures Index

Figure 1: EasyJet Fleet ............................................................................................................ 21
Figure 2: Total Revenues ......................................................................................................... 22
Figure 3: EasyJet Stakeholders ................................................................................................ 24
Figure 4: Return on Invested Capital versus WACC .............................................................. 26
Figure 5: Wouldwide Market Share ......................................................................................... 27
Figure 6: Average Price per Barrel of Crude Oil .................................................................... 27
Figure 7: Industry Fuel Costs and Net Margins ....................................................................... 27
Figure 8: Fuel Hedging Requirement ....................................................................................... 28
Figure 9: Losses/Gains on Cash Flow Hedge ......................................................................... 29
Figure 10: Fuel Efficiency and Jet Fuel Prices ........................................................................ 29
Figure 11: Proportion of Revenues and Costs .......................................................................... 30
Figure 12: World GDP Growth ................................................................................................ 32
Figure13: Air Passengers and World GDP Growth ................................................................. 32
Figure14: UK and Europe GDP Growth .................................................................................. 33
Figure 15: Seats Flown ............................................................................................................. 35
Figure16: Kilometers Flown .................................................................................................... 35
Figure 17: Operating Revenues and Operating Costs .............................................................. 36
Figure 18: Operating Expenses ................................................................................................ 37

 7
Tables Index

Table 1: Total Aircraft per year ............................................................................................... 34
Table 2: Forcast of Total Revenues 2018-2030 ....................................................................... 36
Table 3: Forecast of Crude Oil Price ........................................................................................ 37
Table 4: Historical and Forecasted Crew Cost ........................................................................ 38
Table 5: Forecast of Operating Profit ....................................................................................... 39
Table 6: Forecast of EBIT 2018- 2030 .................................................................................... 40
Table 7: Forecast of FCFF 2020-2030 ..................................................................................... 42
Table 8: Market Value of Operating Leases ........................................................................... 43
Table 9: DCF Estimated Price ................................................................................................. 44
Table 10: Median of Growth Rate and Median of EBITDA of EasyJet .................................. 44
Table 11: Financial Information of Peer Group ....................................................................... 45
Table 12: Multiples of Peer Group ........................................................................................... 45
Table 13: EV/EBITDA Valuation ............................................................................................ 45
Table 14: P/E Valuation ........................................................................................................... 46
Table 15: Sensivity Analysis - % change in TV growth and WACC ...................................... 47
Table 16: Sensitivity Analysis – Change in the nº of years to reach 2019 levels and chang in
crash of 2020 ........................................................................................................................... 47
Table 17: Forecast – Dissertation versus Investment Report ................................................... 48

 8
1. Introduction

EasyJet started flying in 1995 and since its early years the company has won several numeral
awards for costumers ‘preference. Focused on their costumers’ satisfaction the company has
followed key value such as simplicity, innovation, integrity, one team, passion, and above all
safety. The company is one of the low cost airline leading in Europe, carrying more than 96
million passengers in the last financial year and recording a total revenue of £6.3 billion.

Nowadays, the airline industry is facing a global crisis resulting from Covid-19 pandemic. This
global problem has affecting passenger traffic, air cargo demand, airport workforce and
incoming revenues. For FY20, it is expected a decreased on EasyJet’s total revenues and
consequently on enterprise value. However, it is also expected that EasyJet will recover from
this crisis within three years, returning to the levels before Covid-19 pandemic.

The current dissertation will be divided on four main parts. The first one is literature review in
order to explain the concepts behind the valuation and the methods used. Then, an overview
about the business, industry and macroeconomic environment will be present to give a closer
perception to the reader. The third part is mentioned as the methodology of valuation, once it
will include the forecasts for the next years, the valuation itself, using the DCF and multiples
approaches and a sensitivity analysis. The final part is the comparison of the valuation reached
from the current dissertation to the one achieved by a team of investors.

Concluding, the current dissertation’s purpose is to value the company’s business in order to
achieve the most accurate and realistic final share price per unit. Afterwards, this final share
price will be compared with other market research to conclude whether investors should buy,
hold or sell their position.

 9
2. Literature Review

“The goal of company valuation is to give owners, potential buyers and other interested
stakeholders an approximate value of what a company is worth”, Steiger (2008). According to
Damodaran (2016), the idea behind a successful investment and management of the financial
and real assets is to understand where such value of each company is coming from. Fernandez
(2013) noted that the valuation of a company is an indispensable requisite for anyone involved
in the field of corporate finance.

Every asset can be valued, however, some assets are easier to value than others and the
information needed to determine a truthful valuation differs from case to case. According to
Fernandez (2013), the value of a company is subjective and arduous to reach with the right
price, once the future is unpredictable and a fair company’s value may not be the same for
sellers and buyers. Typically, a company’s valuation depends on many factors such as industry,
economic conditions, performance of company and valuation methods. However, there is no
one way to find the certain company’s value, and the best fit to determine a strong and
adjustable valuation is to use more than one approach.

The main objective throughout this section will be the theoretical explanation and description
of the four most used approaches in order to evaluate a firm: Discounted Cash Flow Method,
Dividend Discount Model, Economic Value Added and Multiples Valuation.

2.1. Discounted Cash Flow Valuation Method

According to Damodaran (2002), the Discounted Cash Flow Valuation Method (DCF) “is the
foundation on which all other valuation approaches are built” and it “values the company non
basis of the net present value of its future free cash flows which are discounted by an appropriate
discount rate”, as Steiger (2008) states. In other words, the DCF method struggles to figure out
the present value of the expected company’s future cash flow to evaluate the attractiveness of
an investment opportunity. This approach is based on predictions and according to Damodaran
(2002) it can differ from the firm’s price in the market.

In a more practical way, according to Steiger (2008), to evaluate a company through the DCF
method is fundamental to complete different stages. Firstly, it is required to predict the future
cash flows for the subsequent five to ten years. Afterwards, the weighted average cost of capital

 10
(WACC) should be determined, as an appropriate discount rate, to discount all the future free
cash flows (FCF) in order to determine the net present value. The next stage is to figure out
terminal value (TV) which is the value of a company beyond the forecast period. Then, the TV
should be discounted to the valuation date using the discount rate. Lastly, to obtain the value of
the company, the net present values of the discounted cash flows must be summed up with the
discounted terminal value. The DCF Method can be summarized in the equation below:

 = ∑ +
 (1 + ) (1 + )
 =0

Damodaran (2002) reports that there are three most used approaches to discounted cash flow
that will be explained in this section. The first one is to value just the equity in the business, the
second one is to value the entire firm and the third and last one is to value the firm beginning
with its operations and adding the effects on value of debt and non-equity claims.

2.1.1. Free Cash Flow to the Firm and Free Cash Flow to Equity

In order to compute the DCF valuation, there are two approaches of free cash flow. The first
approach is Free Cash Flow to the Firm (FCFF), which is the cash flow that is available to all
providers of the company´s capital, both debtholders and equity holders. The second approach
is Free Cash Flow to Equity (FCFE), which is the cash flow available only to equity holders,
Damodaran (2016).

The main difference of using the FCFF and the FCFE as a basis for the valuation analysis is
that using the FCFF the result is the enterprise value of the company whereas using the FCFE
the result is the equity value of the company. Since an investor usually takes over all liabilities,
debt and equity, the FCFF is more relevant than the equity approach, as Steiger (2008) observes.

 a) Free Cash Flow to the Firm

According to Damodaran (2002), there are some steps to follow in order to obtain the value of
the company using the free cash flow to the firm.

Firstly, it is necessary to compute the free cash flow to the firm. For that, it is required to
figure out the net operating profit after taxes, which is calculated by deducting taxes from the
company’s earnings before interest taxes (EBIT). In addition, all non-cash expenses found on
the company’s income statement, such as depreciations and amortizations, should be added

 11
back. The capital expenditure (CAPEX) and the changes in the net working capital (NWC) should be deducted because they are not reflected in calculations of the EBIT and it is possible to occur an increase in cash requirements, respectively. The following equation summarizes this first step. = (1 − ) + − ∆ − Where T is the effective tax rate. Subsequently, it is required to compute an appropriate discount rate. According to Steiger (2008), “determining the discount rate requires an extensive analysis of the company´s financing structure and the current market conditions.” The discount rate is one of the most important inputs, once it is “the function of riskiness of the estimated cash flows, with higher rates for riskier assets and lower rates for safer assets”, Damodaran (2002). Furthermore, small changes on the discount rate will cause large changes on the company’s value. As mentioned earlier, the rate used to discount the free cash flows will be the weighted average cost of capital, WACC. The weighted average cost of capital refers to the opportunity cost that an investor has by investing in the company rather than in another business with comparable risk. According to Fernandez (2011), “the WACC is neither a cost nor a required return, but a weighted average of a cost and a required return”. Following this idea, the WACC is determined by the summing up of the product of both the cost of debt and equity by its relevant weight and those products. The WACC is computed in the following way: = ∗ ( ) + ∗ ( ) ∗ (1 − ) + + Where Ke is the cost of equity and Kd is the cost of debt. Cost of Equity The cost of equity is the rate of return that investors require to make an investment. According to Damodaran (2016), it is very difficult to estimate the cost of equity because it is an implicit cost and can vary across different investors in the same company. However, it is determined with the help of the capital asset pricing model (CAPM). According to Sharpe (1964), the general idea behind the CAPM model is that an investor must be compensated by the time value of the money that is related with the risk free and the price of risk which is the additional 12
expected return per unit. Following the CAPM, the cost of equity is calculated based on the risk-free rate (rf), the levered beta coefficient and the market risk premium. The equation below demonstrates the computation of the cost of equity by CAPM. = + ( ) Following the equation, the product of Beta with the Market Risk Premium represents a compensation for the risk in the investment. Levered Beta The levered Beta is the risk added to the market portfolio, which means that Beta estimates the exposure of a company to the market risk. In order to reach the levered Beta, it was computed by using an OLS regression on the returns of company’s volatility relative to the returns of market volatility. Market Risk Premium The market risk premium (MRP) is a significant input in all of the asset pricing models, according to Damodaran (2016), and it is the excess return obtained by bearing the market risk compared with the risk-free rate. In the current valuation, the market risk premium will be figured out by adding both the risk premium for mature markets and the country risk premium. In order to find these two terms, Damodaran’s calculations in January 2019 will be used. Risk-Free To conclude, the risk-free rate is the rate of return paid on risk free investment. In other words, it is the expected returns that investors know with certainty. Usually, the choices of risk free are a short-term government debt rate or a long-term government bonds yield to maturity. In the current valuation, as EasyJet has its headquarters located at London, a 10 years UK Government Bond will be used as the risk free rate. A longevity bonds since was used since they are more suitable for the chosen forecast period of 10 years. Cost of Debt According to Steiger (2008), the cost of debt is the effective interest rate that the firm must pay for borrowing funds to finance its assets. Usually, this rate has different values every year due to changes in the company’s debt structure. Damodaran (2016) states that any investment grade 13
firm with outstanding long term debt can use the yield to maturity (YTM) on bonds issued by these firms to determine the cost of debt. In EasyJet valuation, the cost of debt will be computed by the weighted average yield to maturity of its bonds issued. Terminal value The next step is to figure out the second term of the present value of the firm’s equation, the terminal value. This implies that the company achieved a steady state, which means, “the company remains qualitatively similar year by year after the valuation horizon and that it has a stable development of earnings, free cash flows, dividends and residual income”, as Levin and Olsson (2000) point out. According to Damodaran (2002) the terminal value can be obtained in three different approaches, which are the Liquidation Value, the Multiples and the Stable Growth Model. This last one is the most used and the practical idea beyond this approach is to know the number of years that the company will take to achieve a stable state and to figure out the growth rate that the cash flows of the company will present going forward from that point. At its maturity stage, this firm’s growth rate tends to be reached with the long term economy growth rate of the country where the firm is located or with the global economic growth, “[s]ince no firm can grow forever at a rate higher than the growth rate of the economy in which it operates, the constant growth rate cannot be greater than the overall growth rate of the economy” (Damodaran, 2002). Afterwards, the constant growth rate together with the WACC, as an appropriate discount rate, allows the use of a simple model to determine the terminal value. Since all free cash flows to the firm are discounted by the WACC, the terminal value has to be discounted again in order to obtain the net present value of all free cash flows that occur after the predicted scenario period. In order to get the enterprise value, both net present values are then summed up, as it can be observed in the equation below: = ∑ + (1 + ) (1 + ) =1 +1 Where = − b) Free Cash Flow to the Equity 14
As mentioned before the FCFE estimates the amounts of cash a firm can afford to return to its
stockholders, which means that FCFE results on the equity value of the company, according to
Damodaran (2002). In order to figure out this value, the net income should be added and then
the capital expenditures (CAPEX) and the changes in net working capital (NWC) will be
subtracted. Afterwards, both depreciations and amortizations and the net borrowing (NB),
which is the difference between the new debts issued and the debt repayments, will be added.

The equation below summarizes the calculations of the FCFE:

 = + & − ∆ − +

Subsequently, it is required to find an appropriate discount rate to discount all cash flows, which
usually is the cost of equity (Ke) that can be computed in the same way as in FCFF.

Finally, and following the same reasoning of FCFF methodology, all free cash flows to the
equity, until reaching a steady state, should be discounted by the cost of equity and the terminal
value added, as it can be observed in the following equation:

 = ∑
 +
 (1 + ) (1 + )
 =1

 +1
 Where, =
 −

2.1.2 Adjusted Present Values

The Adjusted Present Value (APV) approach helps investors to analyse the company’s
valuation and to understand where the value comes from. Nowadays, this method tends to be
considered one of the best alternatives to valuate a company, once it “is especially versatile and
reliable”, according to Luerhrman (1997). Luerhrman (1997) states that “like WACC, APV is
used to value operations, or assets-in-place, that is, any existing asset that will generate a stream
of future cash flows”. However, he agrees that WACC should be replaced by APV, since “APV
always works when WACC does and sometimes when WACC doesn’t, because it requires
fewer restrictive assumptions”. One of the biggest advantages of using this approach is to be
able “to analyse financial manoeuvres separately and then add their value to that of the
business.”

 15
According to Damodaran (2002), the adjusted present value valuation consists in the following
three steps:

The first step requires estimating a firm’s value without debt by discounting all free cash flows
to the firm using the unlevered cost of equity.

The second step in this approach is the calculation of the present value of the interest tax savings
generated by borrowing a given amount of money, which is called interest tax shields (ITS). If
the firm’s marginal rate is assumed to stay constant, the ITS “is a function of the tax rate of the
firm and is discounted at the cost of debt to reflect the riskiness of this cash flow”, states
Damodaran (2002).

The last step in this approach is to evaluate the effect of borrowing debt on the default risk of
the company and on the expected cost of bankruptcy. To figure out the present value of the
expected bankruptcy cost, the probability of default (PD) should be multiplied by the present
value of the bankruptcy costs (BC).

The equation below summarizes the process of computing the company’s value with the
adjusted present value:

 +1
 ( )−
 = ∑
 + + + ∗
 (1 + ( )) (1 + ( ))
 =1

2.2. Dividend Discount Model

According to Damodaran (2002), “when an investor buys stock, she generally expects to get
two types of cash flows - dividends during the period she holds the stock and an expected price
at the end of the holding period”.

The dividend discount model (DDM) is the simplest model used for predicting the expected
price of a company’s stocks by “forecasting dividends and discounting them to the present”
through infinity, (Damodaran, 2002). This model is based in two basic inputs, the expected
dividends (DPS) and the cost of equity (Ke), as we can see on the equation below:

 16
 =∞
 ( )
 = ∑
 (1 + )
 =1

According to Damodaran (2002), assumptions about expected future growth rates in earnings
and payouts ratios needed to be made to obtain the expected dividends and the cost of equity.

In some cases, it is very difficult to make projections through infinity and the Dividend Discount
Model had to be adapted based on different assumptions about future growth. The simplest and
most used model is the Gordon Growth Model, which values the company’s stocks in stable
growth firms with dividends growing at a constant rate, states Damodaran (2002).

This model “relates the value of a stock to its expected dividends in the next time period, the
cost of equity and the expected growth rate in dividends”, Damodaran (2002) reports. The
following equation summarizes the Gordon Growth model:

 +1
 =
 −

In order to achieve a proper value of stock some assumptions must be kept in mind. The
measures of the firm’s performance are expected to grow at the same rate than that of the
dividends, given that the growth rate in the firm’s dividends is expected to last forever and this
growth rate cannot exceed the growth rate of the economy in which the firm operates,
Damodaran (2002) suggests. Since this model is too sensitive to the cost of capital and the
expected dividend growth rate, a sensitivity analysis should be performed to mitigate any risks
and to ensure that the application of the Gordon growth model is the most accurate possible
(Pinto, Henry, Robinson, & Stowe, 2010).

2.3. Economic Value Added

“The economic value added (EVA) is a measure of the dollar surplus value created by an
investment or a portfolio of investments”, states Damodaran (2002). In other words, EVA is the
measure of a company’s financial performance. According to Grant (2003), the economic value
added is defined as a difference between the firm’s net operating profit after taxes and the cost
of capital, as we can see on the equation below:

 = ( − )( )
 = −

 17
As it can be observed on the equation above, to compute the economic value added it is
necessary to figure out three basic inputs: the capital invested on investments, the return on the
capital invested on them and the cost of the capital for those investments.

According to Damodaran (2002), in order to calculate the capital invested on investments, it is
necessary to use the book value of capital as a proxy of market value of the firm, since “market
values include capital invested not just in assets in place but in expected future growth”.
However, the book value of capital not only includes the accounting choices made in the current
period, but also includes the assets’ depreciation, the value of inventory and the deal with
acquisition. This way, “converting operating leases into debt, capitalizing R&D expenses and
eliminating the effect of one time or cosmetic charges”, bring the book value of capital closer
to market value of the firm, states Damodaran (2002).

To figure out the return on invested capital, it is necessary to compute the after-tax operating
income earned on the investment. Thus, this calculation also requires some adjustments of the
operating leases, Research and Development expenses and one time charges, says Damodaran
(2002).

The cost of capital should be computed based on the market value of both debt and equity of
the firm, states Damodaran, (2002).

Damodaran (2002) suggests that the value of the firm under the economic value added can be
define as “the sum of capital invested in asset place, the present value of the economic value
added by these investments and the expected present value of the economic value that will be
added by future investments”.

In conclusion, this method is used to measure the value a company generates from investments.
However, this measure can be manipulated, because the economic value added could increase
by reducing the capital invested or making riskier investments, but still end up with a lower
value, argues Damodaran (2002).

2.4. Multiples Valuation Method

According to Suozzo et al. (2001), the multiples valuation figures out the firm’s equity value
based on the market price of comparable firms or comparable transactions. In other words, the
idea behind the multiples valuation is to determine the value of the firm by looking at the market

 18
values of a peer group. This method takes a different approach to value a company than that of
the DCF method and in practice is much simpler than the models studied before.

In the multiples valuation method there are two important decisions to be taken. The first one
consists on identifying the comparable firms – Peer Group selection. This is the most
challenging step, since there are no identical firms within the same industry. In this stage it is
required to decide the optimal size of the peer group and the criteria used to choose the
comparable companies. According to Koller et al. (2015) “a good peer group must not only
operate in the same industry, but also have similar prospects for ROIC and growth”.

The second one consists on deciding about which type of multiples will be used. According to
Suozzo et al. (2001), there are two main groups of multiples: the equity and enterprise value
multiples.

The first one, also known as earnings multiples, remains the most used measure of multiples
valuation, according to Damodaran (2002). This type of multiples expresses the value of
shareholders’ claims on the firm, Suozzo et al. (2001) state and the most popular equity
multiples are the Price to Earnings Ratio (PER), Price to sales (P/S), Price to Book Value
(P/BV) and Price to Cash Flow (P/CF)

Otherwise, the enterprise value multiples expresses the value of all claims related to the whole
firm, claim Suozzo et al. (2001). The most popular enterprise value multiples are Enterprise
Value to EBITDA (EV/EBITDA) and Enterprise Value to Sales (EV/Sales).

In the current valuation, the Price Earnings Ratio multiple and the Enterprise Value to EBITDA
multiple will be used. The first one determines the company’s shares in an apples-to-apples
comparison and it is defined as the market value per share divided by earnings per share,
according to Damodaran (2002). It is recommended to use this multiple when surprises that are
not expected occur or when the companies are stable, since it is very difficult to valuate a
company when the earnings per share are negative.

Regarding Enterprise Value to EBITDA, “this multiple has acquired a number of adherents
among analysts”, mainly because differences in depreciation methods across different
companies do not affect EBITDA and this multiple can be compared across firms with different
levels of leverage, states Damodaran (2002). This multiple can be defined as the sum of the
market value of equity and the market value of debt minus cash divided by EBITDA.

 19
According to Damodaran (2002), there are advantages and disadvantages regarding the use of
multiples. One of the biggest advantages of this method is that it requires few assumptions and
is easy to apply. However, it can be challenging when there are no good direct comparable firms
or when these firms have negative earnings or cash flows. Furthermore, multiples valuation
could be built in errors because the market could be over or undervaluing.

2.5. Conclusion

In order to evaluate the EasyJet, the Discounted Cash Flow (DCF) approach, by applying the
Free Cash Flow to the Firm (FCFF) of the company, and the Multiples approach will be used.
As we mentioned earlier and according to Steiger (2008), the investor usually takes over all
investor liabilities, debt and equity and for this reason is more relevant to use the Free Cash
Flow to the Firm on this valuation than the Free Cash Flow to the Equity. The Discounted Cash
Flow method is the most appropriate for this company due to the amount of information that is
available to get, which made it possible to reach the enterprise value. Otherwise, the Dividend
Discount Model is not suitable since EasyJet dividends distribution is uncertain. For the
Multiples approach, both multiples will be used: Enterprise value to EBITDA (EV/EBITDA)
and Price to Earnings (P/E). In order to achieve the reasonable target price, a peer group will
be selected from a large sample of airline groups, taking into account a number of specific
criteria in order to create a group of comparable companies in terms of structure, dimension and
risk.

3. Business Overview

EasyJet is one of the major players in the low-cost airline industry and its headquarters are in
London Luton Airport. The company was founded in 1995 by Sir Stelios Haji-loannou to offer
low-fares flights in Europe. Since its early years the company has invested in new routes and
bases, it has innovated with new data, making efficient decisions and shaping the future of
travel, and it has created a differentiated service to its customers, giving them the leading offer
in the airports they want to fly to. In the end of 2019, EasyJet operated in 159 airports with a
total of 1 051 routes and achieved seven number one airports. Following this, the company has
won several awards for customers’ preference and others.

EasyJet implements a customer focused strategy by following a set of values, such as:
simplicity, focusing on the things that really matter; integrity, following always what they
believe in and what they say; one team, believing that together they become more efficient;

 20
passion, thinking about the customers, in order to deliver the best service; pioneering,
anticipating the future and creating new ways to make travel easy and affordable; and safety,
which is the most important value for EasyJet, once the company believes that safety should be
always secured in order to keep the customers’ loyalty.

3.1. Key resources for EasyJet success

The EasyJet company has a strong capital base, with a market capitalization of £4.6 billion
and a credit rating of BBB+/Baa1 (EasyJet 2019), which is the strongest credit rating in the
world for airline business.

The company is able to defer new aircrafts order, to extend aircraft leases or return to the lessor
and it is able to sell them or reduce the utilization at times of low demand, in order to generate
an effective and efficient utilization of the resources and to generate returns. EasyJet has a total
fleet of 331 aircraft in 2019 (Figure 1).

The company has been investing in technology in order to create a strong brand and to improve
the existing systems, which helps to deliver a better quality service. In the last financial year,
the airline company introduced new data products and created a new team in order to provide
insight on unexpected recent events and identify opportunities to improve. EasyJet has also
created a team to work directly with external bodies involved in air traffic management in order
to reduce delays. Moreover, in 2019, there were 700 million visits to all digital platforms and
EasyJet was voted the best airline app at the World Aviation Awards.

EasyJet cares about its people and believes they are one of the most important assets for its
business. “With the warmest welcome in the sky, EasyJet customer-facing employees are the
very best in the industry and contribute significantly to the positive experience that customers
enjoy, leading to increased loyalty and repeat business”, (EasyJet, 2019). At the end of the

 21
financial year of 2019, EasyJet employed over 15,000 people, such as pilots, cabin crew and
other staff.

The company interacts with a significant number of stakeholders who are increasingly
demanding for a business that is focused on environmental and social factors and innovation.
In this context, EasyJet has invested in new fleet and technology in order to reduce its impact
on the environment and to improve its customers’ services and working conditions for
employees. Furthermore, the company created various self-help initiatives over the summer
with decisive management actions recording a summer profit performance. Following this,
EasyJet has increased its relationship with stakeholders, which can be proved with the record
number of 96.1 million passengers flying in its flights, resulting in an increase of 8.6% from
2018. (EasyJet report, 2019).

The combination of these resources is responsible for a great and continuous performance
delivered by EasyJet, which can be shown by the growth throughout the years (Figure 2). The
good results observed in the last five years made it possible to keep the company’s investments
not only in its services but also in expansions and acquisitions.

3.2. EasyJet strategies

Network - investing in number one and two airports: the company aims to provide its
customers the airports they want to flight to. In the last financial year, the company has
consolidated its position on the airline industry with 112 new routes, becoming number one or
two on 27 airports, such as of London, Venice and Hamburg.

 22
EasyJet has been establishing a strong position in France. In this context, in April of 2019
EasyJet opened a new base in Nantes.

Moreover, the company has identified a number of potential airports for the coming years where
the GDP and passengers volume is high enough to become the number one in Europe.

Value by efficiency: the importance of a sustainable business has been notable in EasyJet. In
this context, in July 2018 the Airbus A321neo aircraft joined the company fleet. This new
aircraft has 235 seats and it is expected to reduce 9% of the cost per seat compared to A320neo
and also reduce the environmental footprint by 15%. This increased capacity will give EasyJet
the opportunity to grow at slot-constrained airports and offers possibilities to more people on
most popular routes.

Winning customers’ loyalty: EasyJet continues to focus on customers’ loyalty and satisfaction
through investing in the brand and service, innovation and strong operational performance. As
a result of this, the company was named “Best Value Short-Haul Airline” by Skyscanner and
was voted “Best Low-Cost Airline” by Business Traveller magazine in 2018.

In the following years, EasyJet observes a strong opportunity in changing its holiday offers,
creating more value through the offer of great hotels based on its understanding of customers’
needs. In this context, it plans to build a direct relationship with hotel, ensuring an attractive
price to EasyJet customers. Consequently, the company builds greater holiday experience to its
customers.

The company has also started to design a new programme in which customers earn points for
every purchase with EasyJet and its partners and can use these points to purchase exclusive
rewards to improve their trips. This strategy will give the opportunity for EasyJet to build a
strong and loyal relationship with its customers.

The right people: EasyJet believes that people are an important input for the company’s
success, and it has consciously invested in a better place to work. Following this, the company
introduced the Peakon. The Peakon is a new employee listening tool, in which the employees
give real time honest feedback on a more regular basis about EasyJet as an employer, helping
the company to make better decisions. Overall, in the end of the year, employees gave a good
score to the company which it is seen as a good place to work on.

 23
Innovating with data: EasyJet also continues investing in the digital in order to become the
world’s leading data-driven airline, thus improving the customer experience. In this context,
the company is focusing on creating new sources of data to offer simulation capabilities and to
deliver a competitive price for tickets, becoming an attractive company to fly to.

3.3. Dividend and shareholder’s policy

The EasyJet corporate governance includes a Board of Directors, who are responsible for the
company’s performance and they are responsible for the development and implementation of
the strategy; an Airline Management Board, who is responsible for managing the allocation
of capital and central funds, Board Committees, which include safety, nominations, audit,
finance and remuneration committee; a Chairman, who is responsible for the leadership of the
board and ensures that it operates effectively; and The Board, who is responsible for setting
and managing priorities in a way that ensures sustainable long-term growth, taking into account
the interests of the stakeholders (EasyJet, 2019).

The shareholder structure, on figure 3, consists in four main divisions. The first one is
composed by four main shareholders that hold around 34% of the company’s shares: Haji-
loannou family - easy Group Holdings Limited, Polys Holding Limited, Stelios Haji-loannou
and Clelia Haji-loannou. Apart from these there are a few other relevant shareholders such as
Invesco Asset Management, holding 10% of the company´s shares and BlackRock Investment
Management, holding just 5%. The other 51% of the company is owned by individual investors
and other institutions.

 24
In order to reflect the long-term prospects, the company reported a pay-out ratio in 2019 of 50%
of earnings after tax. In the last financial year, EasyJet paid dividends of 43.9 pence per share
(EasyJet, 2019).

4. Industry Overview

The airline industry has been competing between the companies with an intense focus on the
price and cost reduction, which leads to a greater efficiency. The number of passengers who
have booked a flight with a commercial airline has been increasing over the last 15 years. This
continuous demand in air travel has been reinforced by an increase in low cost carriers, by the
growth on global middle class that has increased the number of people able to afford air travel;
and by the growth of airports, which has increased the global carrying capacity.

The last reason is enforced by the increase of the available seat kilometres in the last financial
year. As a result, the passenger load factor 1marked up slightly to a record of 82.4% and for
2020 IATA forecast period the passenger load factor will reach to 82%. This increase is related
with the improved industry financial performance of recent years (IATA 2019).

In the last financial year, the total aviation sector observed a net profit of 26bn dollars, a
reduction of around 4% compared with 2018. This reduction is highly related with the sector’s
main cost driver increase, such as labour, infrastructures, fuel and crew costs. In the following
years, in order to avoid this huge oil costs, commercial airline is expected to invest in new
aircrafts, making a significant contribution to increase fleet fuel efficiency (IATA, 2019).
Otherwise, in 2020 IATA projects $29 bn net profit for global airline industry. This positive
projection is related with the slower than expected global economic growth in 2019, which
contributed to lower demand for crude oil with a decrease of the price per barrel of Brent Crude.

Moreover, since 2014, the airline industry has been observing a return on invested capital
greater than WACC on figure 4. This means that investors have seen their investment being
returned on average above its invested capital.

1
 Number of passengers as a percentage of number of seats flown.

 25
The decline in return on the invested capital from 2016 to 2019 was driven by a demand slower
than the capacity growth and an increase in breakeven load factors. However, the level of
profitability is still very high compared to the industry’s standards.

However, the recent news about Covid-19 pandemic will change this estimates, once it is an
unknown situation and companies was not prepared to fight this crisis and was forced to stop
their activities.

4.1. Full Services Airline vs Low Cost Carriers

The full services Airlines (FSA) are considered the traditional way of flying and still dominate
the airline industry. The price on FSA is higher than on low cost carriers. Although the services
on board of FSA are more complete and the passenger gets more benefits than what is already
included in the price.

On the other hand, the Low-Cost Carriers (LCC) are known by their focus on cost reductions,
in order to offer competitive prices and low fares to customers, although this type of companies
usually does not provide extra services, such as on board meals and drinks. EasyJet is
considered a low-cost company.

The low-cost carriers have been speedily expanding their shares of the global air travel market
over the last decade, which proves that this type of companies have a big impact on the Airline
industry. Otherwise, the FSA have been negatively affected by this rapid rise. In the last
financial year, LCC represented 31% of the worldwide air share, an increase of 1 pp compared

 26
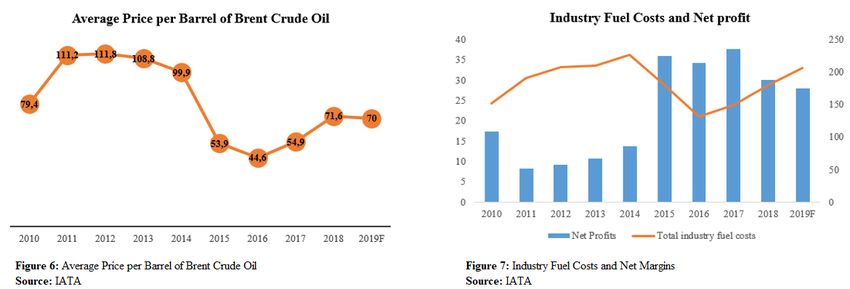
to 2017 (figure 5). The rise of the LCC is justified by the preference of a large part of consumers
for competitive prices over some comfort.

As it is possible to observe on figure 5, these two airline’s segments have recorded an
approximation in terms of share of total flights. If the FSA desire to compete with the LCC, the
first must maintain a high service standard in order to add value to the customer experience and
decrease their tickets price. Otherwise, the LCC, like EasyJet, must unceasingly improve their
competitive advantage, ensuring the importance to deliver high quality and low-cost services
to their customers, in order to guarantee their continuous growth.

5. Macroeconomic Environment

5.1. Fuel

Fuel is one of the most volatile and the biggest cost that the airline sector faces. The airline
sector is highly exposed to fuel fluctuations and their net margins are extremely correlated with
its performance. In the last financial year, fuel represented 22% of EasyJet total costs.

 27
An overall drop in crude oil prices has been observed, which is the source for jet fuel oil, in the
past years (Figure 6). This has a positive impact on the airline companies’ net profit (Figure 7).
As it can be observed, between 2014 and 2015 occurred a sharp decrease in the oil price from
$99,9 per barrel to $53,9, and consequently the companies’ net profit recorded a high increase
from $13.3 billion to $36 billion.

This reverse relationship is related with the unchanged ticket prices when the main cost driver
of the airline companies decreases. Furthermore, people in general have more money to spend
when oil price decreases and the number of trips per passenger and the number of passengers
could increase.

To mitigate the volatile risk of the fuel price, the airline companies take hedging positions,
taking an offset position in order to prevent losses from the increase of fuel oil prices.

Following this, EasyJet hedges 65% to 85% of the next 12 months anticipated fuel requirements
in order to stabilize fuel prices. Additionally, the company is also significantly reducing profits
and cash swings, representing an overall reduce on the risk of the company.

As of 30 September 2019, EasyJet had settled forward jet fuel contracts for the 2020 and 2021
fiscal years. The company was covering through forward contracts 74% of its fuel requirements,
at an average price of £632 per tonne until 31 of March 2020. Moreover, the company also
entered in forward contracts that covered 68% of its fuel requirements, at an average of £655
per tonne for full year of 2020 and for the 2021FY, the company has 45% of its fuel need
covered by forward contracts that settled an average rate of £643 per tonne (Figure 8).

 28
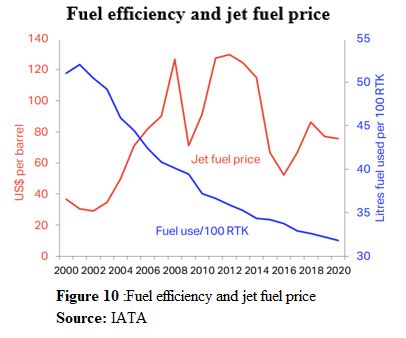
Figure 9 show the losses/gains on fuel cash flow hedge in the last 5 years. It is possible to
observe that between FY2015 and FY2017 EasyJet has been successfully offsetting the fuel
price risk. The company recorded a gain of £299, £375 and £38 million in 2015, 2016 and 2017,
respectively. However, in the last two years, the company recorded losses of £206 and £150 in
2018 and 2019, respectively.

Another way to mitigate the impact of oil prices on airline companies is to introduce more fuel-
efficient aircraft. According to IATA, each new generation of aircraft is on average 20% more
fuel-efficient than the previous model. Figure 10 shows the improvements of fuel efficiency in
terms of capacity use and the oil price fluctuations over the years. IATA forecasted a decline
of around 22% on average operating costs due to the delaying effect of hedging and
continuation of low oil price. The new fleet and the efforts of the governments to remove
inefficiencies from the airspace and airports contribute significantly to improve fuel efficiency
in the next few years.

EasyJet has continued to invest in new aircraft over the years. In 2018, the company started to
operate a new generation of Airbus A320, which is 15% more fuel efficient than the previous
ones, and it is also planning to increase its fleet with the Airbus A321neo.

 29
You can also read