ERCOT Winter Storm Uri Blackout Analysis (February, 2021) - Prepared By: Vibrant Clean Energy, LLC Christopher T M Clack Aditya Choukulkar Brianna ...
←
→
Page content transcription
If your browser does not render page correctly, please read the page content below

ERCOT Winter Storm Uri
Blackout Analysis
(February, 2021)

                              Prepared By:

                Vibrant Clean Energy, LLC
                       Christopher T M Clack
                          Aditya Choukulkar
                                Brianna Coté
                              Sarah A McKee

                                         -0-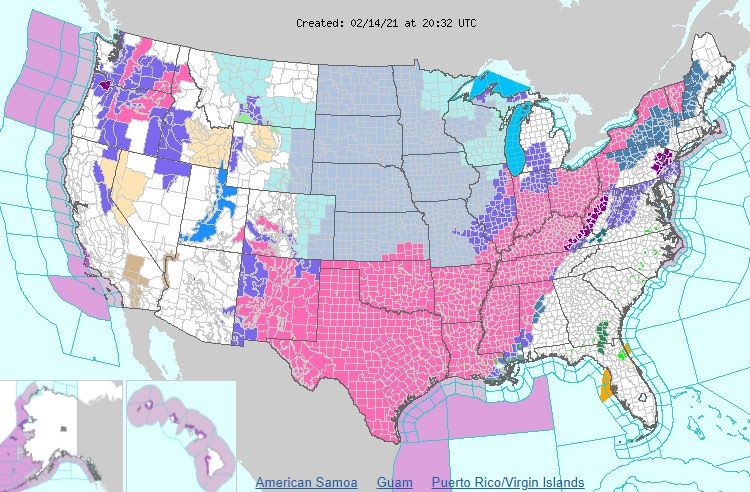
Table of Contents
 1        Summary ............................................................................................................ - 2 -
 2        ERCOT System Overview ............................................................................. - 4 -
 3        Weather Overview ........................................................................................ - 11 -
 4        Wind & Solar Renewable Resources ..................................................... - 14 -
  4.1    ERCOT Wind Analysis ........................................................................................................ - 15 -
  4.2    ERCOT Solar Analysis ......................................................................................................... - 23 -

 5        Natural Gas Resource Overview.............................................................. - 24 -
 6        High Renewable Grid Performance ....................................................... - 25 -

©Vibrant Clean Energy, LLC                                      -1-                                              Boulder, Colorado
info@vibrantcleanenergy.com                               23rd March, 2021                                 VibrantCleanEnergy.com

1             Summary
       The energy world attentively watched the Electric Reliability Council of Texas (ERCOT) as
       Winter Storm Uri crippled the electricity grid that provides power to the majority of Texas
       during President’s Day week of February, 2021. From the early morning of Monday
       (February 15th) continuing through Saturday (February 20th) load was shed across the
       ERCOT footprint as electricity demand outstripped the generation available to supply that
       electricity. The load shedding resulted in rolling blackouts and many without power for
       several hours, and days, in a row. 1 Energy and fuel prices soared as supply was severely
       constrained. In many ways, this record-breaking winter storm and event will be studied for
       years to come in the energy industry. The demand across the different ERCOT regions is
       plotted in Fig 1.1.

         Figure 1.1: The electricity demand for the eight ERCOT regions. The rolling backouts are highlighted in the red
                           box. All regions appear impacted by the blackouts. Data is from the EIA 930.

       The financial repercussions and fallout from this event are still being analyzed. This event
       will inevitably continue to spark discussion, debate and consideration for all entities across
       the US. It painfully displays how grid reliability and planning are key to the modern
       operations of an electricity system that almost all of the economy relies upon. At the time
       of writing, the Texas legislature had already introduced several bills aimed at preventing
       such events occurring in the future. The industry will continue to watch how ERCOT adapts
       to the new challenges this event has highlighted for the industry as a whole.

       Given the magnitude of this event and the number of utilities affected by the extreme
       weather, the nuanced, intricate, and complex nature of the energy markets was clear to see
       for all. Questions were raised about the relationships between the Texas Public Utility
       Commission and ERCOT, between ERCOT and the utilities it oversees, as well as the
       responsibility and purview of each of these entities. Many factors contributed to the
       blackouts, which included frozen wind turbines, natural gas pipelines losing pressure, a
       nuclear plant coolant sensor failure, and fossil thermal unit components, natural gas
       pipelines, coal stockpiles, and oil refineries all freezing.

       1
         Note: The purpose of load shedding is a deliberate act to halt the continual deterioration of the grid balancing process; without doing so
       more generation would be “tripped” offline until the entire system goes dark.

©Vibrant Clean Energy, LLC                                              -2-                                                    Boulder, Colorado
info@vibrantcleanenergy.com                                       23rd March, 2021                                       VibrantCleanEnergy.com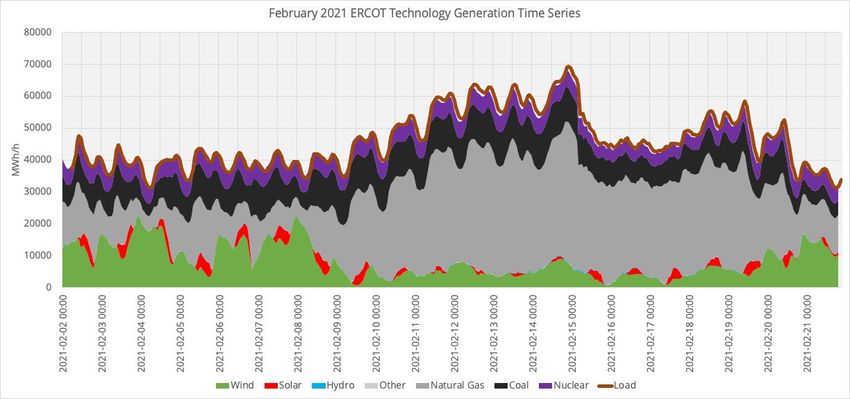
At the worst point of the event over 48% of the generating capacity across ERCOT was
       offline. 2 Simultaneously, a new winter peak demand was being set. Further, planning and
       emergency procedures were not prepared for such an extreme event. The “extreme
       weather” scenario for ERCOT had been derived from a similar, yet far less severe event from
       2011. From the Seasonal Assessment of Resource Adequacy (SARA) Report an extreme
       winter forecast demand peak was 67,208 MW. 3 A new winter peak occurred the evening of
       February 14th, set at 69,222 MW with the forecasted load peak expected to be even higher
       in the coming days. The ERCOT estimated peak demand without load shedding was 76,819
       MW, which greatly surpassed their worst-case planning scenario.

       Finally, we note that the Texas housing design specifications as a whole are not built for
       prolonged cold temperatures either. Therefore, there is no one single point of failure in
       what transpired. This short paper is not an investigation of policy, oversight, or liability.
       Rather, it is a look at the preliminary data available and an overview of what was observed
       from an outside independent consultant.

       Vibrant Clean Energy (VCE®) seeks to provide readers with a short summary of the ERCOT
       system layout and general information reported from ERCOT after this event occurred in
       Section 2. Section 3 discusses the weather during this extreme event. Section 4.1 will dive
       into the performance of the wind resource using the VCE wind power calculations. 4,5 The
       section will discuss the impact proper winterization would have had for this resource.
       Additionally, in Section 4.2 we will review the performance of the solar resource during this
       period using the VCE solar power calculations. Section 5 will provide a brief outline on the
       natural gas resource that also struggled during this period for comparison. Preliminary
       outage data from ERCOT was utilized in this section. 6,7 Lastly, Section 6 is a hypothetical
       analysis of what the wind, utility solar and distributed solar resource would do during this
       week in ERCOT for a 2050 grid system which was built for a clean energy economy and co-
       optimized with a distributed energy system.

       All of the analysis contained in the present paper is derived from data that is open source
       from ERCOT and EIA or produced by VCE (weather datasets or modeling simulations). Many
       of these data sources are preliminary and are subject to possible change.

       The data used in this report is openly available on our website here.

       2
         http://www.ercot.com/content/wcm/key_documents_lists/225373/Urgent_Board_of_Directors_Meeting_2-24-2021.pdf
       3
         http://www.ercot.com/content/wcm/lists/197378/SARA-FinalWinter2020-2021.xlsx
       4
         https://www.vibrantcleanenergy.com/products/datasets/
       5
         https://www.vibrantcleanenergy.com/products/power-forecasting/
       6
         Justin Sabrsula provided valuable data alignment for EIA and ERCOT outage data.
       7
        https://public.tableau.com/profile/brendan.pierpont#!/vizhome/ERCOTOutagesVisualization/EROCTOutagesandDerates

©Vibrant Clean Energy, LLC                                        -3-                                                Boulder, Colorado
info@vibrantcleanenergy.com                                 23rd March, 2021                                   VibrantCleanEnergy.com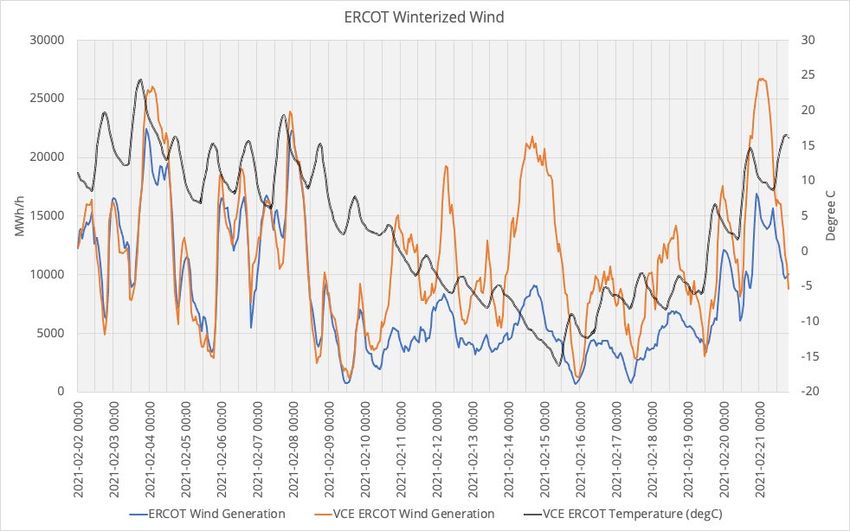
2               ERCOT System Overview
       ERCOT is the independent system operator (ISO) and balancing authority for the majority
       of Texas. It serves over 26 million customers and overseeing 90% of the load in Texas. 8
       Figure 2.1 displays the estimated extent of ERCOT (blue) within Texas (white).

                                                     Figure 2.1: ERCOT domain in Texas.

       Figure 2.2 displays the installed capacity for ERCOT derived from the latest EIA 860 monthly
       data (December 2020). Natural gas contributes the largest amount of capacity in ERCOT
       coming in at around 55% of the total installed capacity. Wind capacity follows at 23% of
       installed capacity. Wind only recently removed coal from the second position in ERCOT.
       Coal and nuclear combined make up about 17% of the ERCOT capacity mix. Utility scale
       solar installations have grown considerably across ERCOT in recent years; however, this
       technology only consists of 4% of the capacity in ERCOT.

       For comparative perspective, Fig. 2.3 shows the ERCOT capacity mix from the end of 2015.
       It can be seen that since 2015, coal has been notably reduced. Natural gas technologies
       make up a slightly smaller percentage piece of the capacity mix. Some new natural gas
       plants are being built as the total installed capacity in ERCOT has increased. This has
       happened alongside increased installation of both wind and solar, which account for the
       majority of the new capacity going into this region. Coal, unlike natural gas, has been
       retired. Storage, although still very small in 2020 has increased dramatically over 2015 (a
       seven-fold increase).

       8
           http://www.ercot.com/content/wcm/lists/219736/ERCOT_Fact_Sheet_2.12.21.pdf

©Vibrant Clean Energy, LLC                                           -4-                        Boulder, Colorado
info@vibrantcleanenergy.com                                    23rd March, 2021           VibrantCleanEnergy.com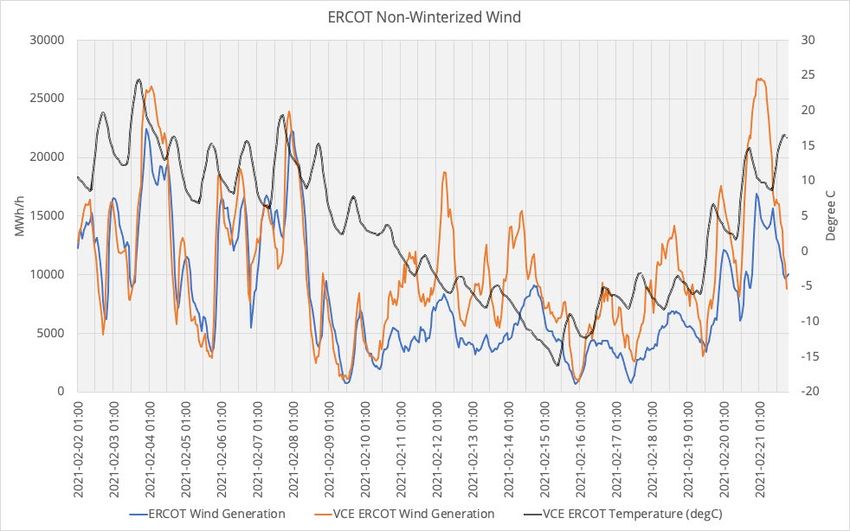
Figure 2.2: WIS:dom estimated installed capacity for ERCOT as of December 2020. The total capacity modeled
                                                 for this region is 119.4 GW.

        Figure 2.3: WIS:dom estimated installed capacity for ERCOT at the end of 2015. The total capacity modeled for
                                                   this region is 106.6 GW.

       Figure 2.4 shows the preliminary generation data from the latest December 2020 monthly
       report from the EIA 923. This shows the total generation sum for 2020, recorded so far, and
       offers a slightly different picture to the capacity plots because renewable capacity factors
       are, on average, much lower than those of thermal units. In Fig. 2.4, it is shown that natural
       gas makes up around 52% of the generation in ERCOT. Coal and nuclear combined make
       up just over 30% of the generation. The strong wind resource in Texas brings wind
       generation in at 15% of the total. Solar generation comes in at less than 2% of the
       generation total.

©Vibrant Clean Energy, LLC                                 -5-                                         Boulder, Colorado
info@vibrantcleanenergy.com                          23rd March, 2021                            VibrantCleanEnergy.com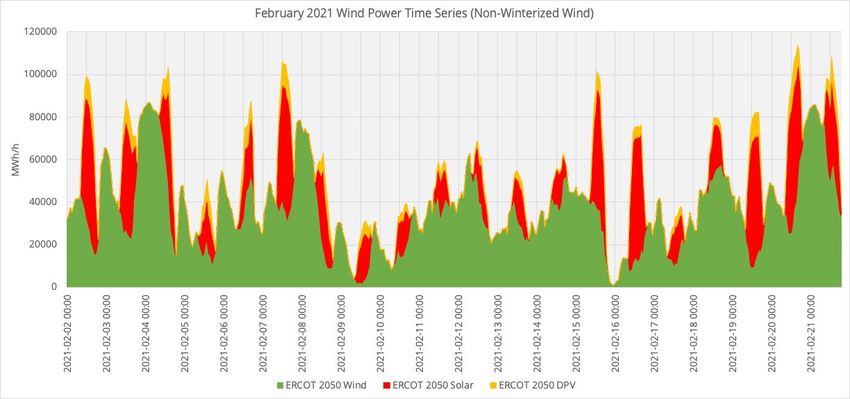
Figure 2.4: WIS:dom estimated generation for ERCOT from the December 2020 monthly EIA 923 report. 9

                      Figure 2.5: ERCOT SARA estimated winter capacity layout for the winter of 2020-2021.

       The above figures show the nameplate capacities of all installed generators across the
       footprint of ERCOT. The SARA report 10 provides the forecasted winter capacities expected
       for the winter season of 2020-2021 as well as the units expected to be available. Figure 2.5
       displays the share of each resource to the total. Note that the SARA report does derate a
       percentage of wind by region and solar. There was no storage relied on. Overall, this mix
       can be compared to the installed capacity shown in Fig. 2.2. The main differences are a
       larger percentage of coal and nuclear. It also shows that on average natural gas is heavily
       relied on during the winter at over 60% of the layout. Some natural gas plants were
       scheduled to be offline due to seasonal maintenance that is often set during the winter
       when energy demand is typically lower. The total winter capacity reported from the SARA
       report was 82,513 MW. During the ERCOT post storm presentation the reported total

       9
          The EIA 923 Monthly reports are known to under report generation compared with their annual counterparts. Typically, more thermal
       generation is reported in the annual numbers.
       10
          http://www.ercot.com/content/wcm/lists/197378/SARA-FinalWinter2020-2021.xlsx

©Vibrant Clean Energy, LLC                                          -6-                                                 Boulder, Colorado
info@vibrantcleanenergy.com                                   23rd March, 2021                                    VibrantCleanEnergy.com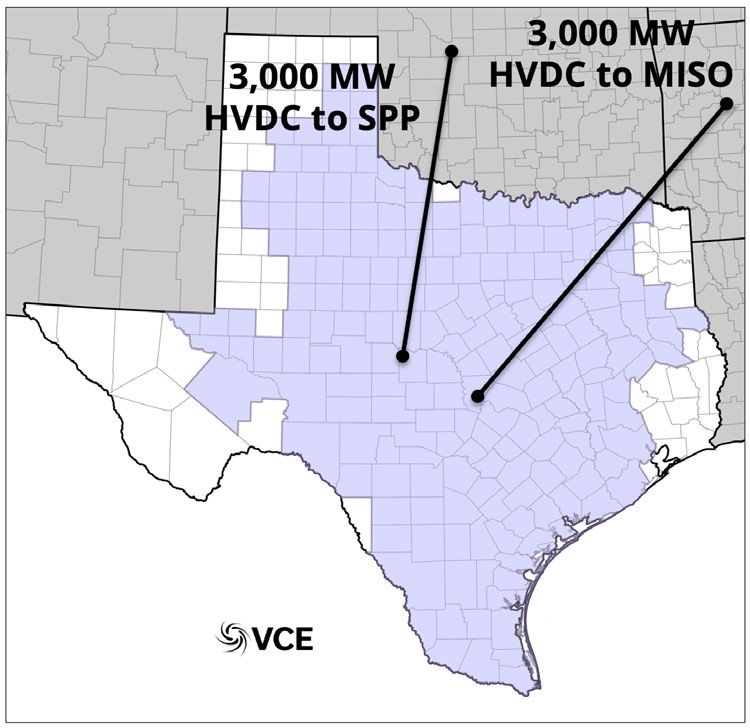
capacity available was 107,514 MW (slide 13). 11 This difference is attributable to additional
       capacity that was brought back online, which was scheduled to be offline to perform regular
       winter maintenance. Thermal units were also allowed to operate at maximum possible
       output. This is normally tied to federal permit to limit emissions. 12 It may also include a few
       newer units that came online sooner than expected. There are several assets, in particular
       on the wind and solar side, which are approved for synchronization to the ERCOT grid that
       appear to be counted in the ERCOT winter planning values. Many of these units are not
       entirely operational yet but are influencing the grid.

       ERCOT is a unique balancing authority entity in several ways. The ERCOT grid is (almost
       completely) islanded from the other interconnect regions in the United States. There are a
       handful of small DC ties to the Mexico grid and from northern/eastern Texas. These are not
       meant for power exchange in a way that would be necessary to support Texas during the
       President’s Day blackouts. ERCOT is also unique in the energy market space as it operates
       without a capacity market. Energy prices are allowed to go as high as $9,000 / MWh under
       scarcity or emergency conditions. Historically, this does not happen frequently. It is
       designed to be a feature of the ERCOT market to incentivize capacity to come online during
       times of scarcity.

       ERCOT is a balancing authority actively built up and prepared for the high summer time
       peaks and warm temperatures of the state. The previous winter peak was set on the
       morning January 17th, 2018 at 65,915 MW. 13 Procedures to handle summer load, including
       demand response shifting tactics, are not necessarily the most robust, certain or
       understood during extreme cold events. This weather event surpassed in every way the
       previous scenario which helped set the current ERCOT extreme cold weather event
       procedures.

            Figure 2.6: ERCOT created graphic from an emergency board of directors meeting which shows the outage
                                                 capacity outages by fuel type.

       As a post-mortem to this event, ERCOT provided information publicly to be reviewed.
       Figure 2.6 shows their calculated outages by generation fuel type. They also released some
       this of this data publicly ahead of the 60-day confidentiality marker, 14 though not all
       generators provided their outage data.

       11
         http://www.ercot.com/content/wcm/key_documents_lists/225373/Urgent_Board_of_Directors_Meeting_2-24-2021.pdf
       12
         https://www.energy.gov/oe/downloads/federal-power-act-section-202c-ercot-february-2021
       13
          http://www.ercot.com/news/releases/show/216844
       14
          http://www.ercot.com/content/wcm/lists/226521/Unit_Outage_Data_20210304__Public_.xlsx

©Vibrant Clean Energy, LLC                                        -7-                                               Boulder, Colorado
info@vibrantcleanenergy.com                                 23rd March, 2021                                  VibrantCleanEnergy.com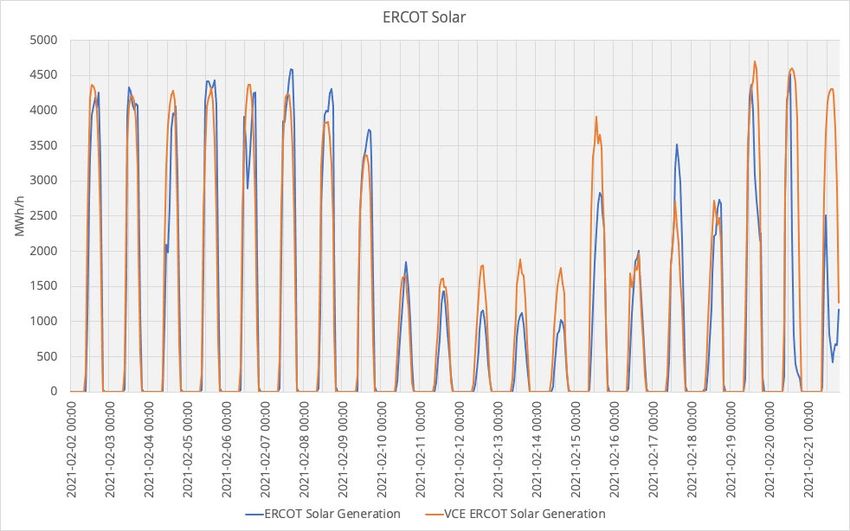
Figure 2.6 shows early on February 15th how large chunks of generation started falling off
       across wind, natural gas and coal all around the same time. The South Texas nuclear plant
       also tripped offline slightly later in the morning of the 15th. During the worst period, ERCOT
       had almost half of its generation offline.

       As an aside, Fig. 2.6 as presented is very misleading with respect to wind generator outages.
       The wind was not under an outage at the levels displayed, rather the wind was not
       generating because it was not windy at that time. This is to be expected by ERCOT, while
       the fossil generation is expected to be “firm,” meaning it should be available. Wind is
       variable and is only available when there is conditions conducive to production; something
       that ERCOT knows and understands.

       The ERCOT SARA report for winter 2020/2021 provides a forecast for a typically expected
       winter peak and the fuel technology generation anticipated to be available. This report also
       provides an expected peak load, typical thermal outages and operating reserve usages are
       calculated. The same information is provided for an extreme peak load and extreme
       generation outage event. The first two columns in Fig. 2.7 show this information. As an
       example, in a forecasted extreme load, low generation event, almost 14 GW of thermal
       generation is expected to be unavailable. In a low wind event, only 1.8 GW of wind is
       expected to be available. The third column of Fig. 2.7 shows one such extreme event where
       the load ERCOT formulated (without load shedding) was at 75 GW. 15 The estimated extreme
       load came in well under the demand that actually occurred during this extreme weather
       event. At this point in time, the load was almost 8 GW higher than the worst scenario
       planned for. Thermal outages were reported at 21 GW 16 at the same time, also much higher
       than an expected worst case. The wind available was actually higher than the extreme low
       wind values projected. The final column of Fig. 2.7 shows actual values from this event at
       the same time as column three. Note, the wind value that is shown to be available at that
       the specific time is from the VCE wind power for ERCOT (which is derived from turbines
       with full winterization).

             Figure 2.7: ERCOT summary statistics of a typical winter peak load scenario, an extreme winter peak
       load/extreme generation outage scenario and actual extreme peak load and outage values observed during the
        Texas Energy Crisis at 8am CST on February 15th. The final column shows the VCE derived winterized wind and
                                    solar series for comparison. Values are in MW/MWh.

       Figure 2.8 shows the generation from each technology in ERCOT during February. The sharp
       drop in generation in the early hours of February 15th from coal and natural gas is evident.
       Wind energy observes a slow decline throughout the 15th, but was actually holding steady
       when the blackouts first started happening. Nuclear also saw a drop a little later on
       February 15th. Actual load is also plotted for comparison.

       15
            http://www.ercot.com/content/wcm/key_documents_lists/225373/Urgent_Board_of_Directors_Meeting_2-24-2021.pdf
       16
            http://www.ercot.com/content/wcm/lists/226521/Unit_Outage_Data_20210304__Public_.xlsx

©Vibrant Clean Energy, LLC                                           -8-                                               Boulder, Colorado
info@vibrantcleanenergy.com                                    23rd March, 2021                                  VibrantCleanEnergy.com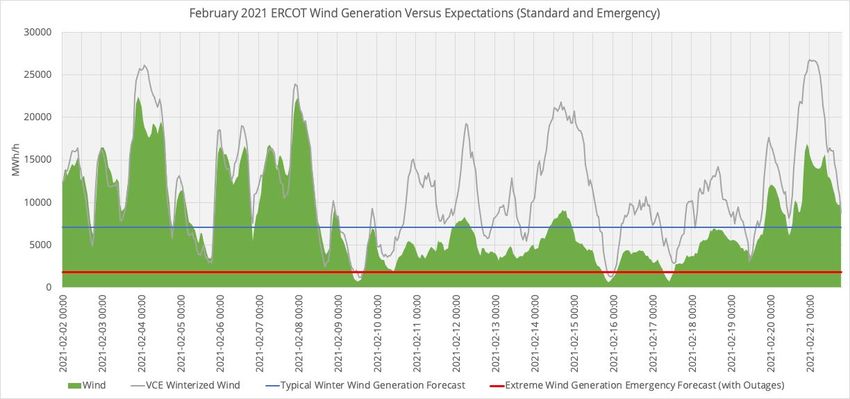
Figure 2.8: ERCOT generation by fuel type. Load is also plotted. This is plotted from February 2nd 2021 through
                                      February 21st 2021. The time zone is set to EST.

       Figure 2.9 shows the thermal generation for ERCOT in February. There are three horizontal
       lines that show the typical thermal winter generation ERCOT planned to have available
       (blue), the thermal generation ERCOT expected to have available with extreme thermal
       outages incorporated (red) and the a newly calculated thermal generation forecast
       integrating thermal outages experienced during this event (bold dark red). This clearly
       shows the thermal fleet not generating what was expected during an extreme load and
       generation outage situation due to the extreme weather conditions as physical assets
       became inoperative.

        Figure 2.9: ERCOT thermal generation alongside various thermal capacity expectations ERCOT had for normal
           winter peak (blue), extreme thermal outage capacity expectations (red) and thermal outage expectations
           recalculated with thermal outages observed during the energy crisis (bold dark red). This is plotted from
                          February 2nd 2021 through February 21st 2021. The time zone is set to EST.

       The expected output in an extreme low wind scenario was also provided by the SARA
       report. Figure 2.10 shows the wind generation (green) during this event alongside the
       expected output in a normal winter situation (blue) and expected wind output in an extreme
       low wind situation (red). In most cases the wind outperformed extreme low expectations
       with the exception of a few hours throughout this period. Wind output did come in below
       normal winter wind outlooks. The VCE derived winterized wind generation is also shown
       (gray). This is discussed to more detail in Section 4. This winterized wind generation would
       have provided ERCOT many hours of normal winter wind output. No expectations were
       provided by ERCOT for the solar technology as of yet. With solar growing on the Texas grid,
       it is expected this will start to be incorporated into extreme planning.

©Vibrant Clean Energy, LLC                                  -9-                                          Boulder, Colorado
info@vibrantcleanenergy.com                           23rd March, 2021                             VibrantCleanEnergy.com
Figure 2.10: ERCOT wind generation (green) alongside various wind capacity expectations ERCOT had for normal
winter peak (blue) and extreme low wind capacity expectations (red). The gray line is the VCE derived wind
power production with standard turbine winterization (less impact from icing). This is plotted from February 2nd
2021 through February 21st 2021. The time zone is set to EST.
Lastly, we show the real-time and day ahead energy prices 17 as reported by ERCOT during
this event. Real-time market prices started to rise steeply on February 14th and hit the
market cap of $9,000/MWh when the blackouts first started occurring. The real-time market
energy prices were continuously at the market cap from February 16th through most of
February 19th. An emergency Texas PUC statement 18 was filed which allowed ERCOT to
keep the real-time price at market cap for longer than market mechanisms typically allow
for. Outside of this period, it is obvious to see the much more typical lower prices
experienced in ERCOT in general.
Figure 2.10: ERCOT Day Ahead (blue) and real-time (orange) energy market prices. This is plotted from February
2nd 2021 through February 21st 2021. The time zone is set to EST.
Pulled from https://www.engieresources.com/historical-pricing-data
17
https://www.puc.texas.gov/agency/resources/pubs/news/2021/PUCTX-REL-COLD21-021521-EMERGorder-FIN.pdf
18
©Vibrant Clean Energy, LLC - 10 - Boulder, Colorado
info@vibrantcleanenergy.com 23rd March, 2021 VibrantCleanEnergy.com3 Weather Overview
The North American storm of February 2021, unofficially known as Winter Storm Uri,
affected Canada all the way to Mexico in February 2021. There was very little of the
contiguous US not influenced by this event at some point. Figure 3.1 shows all counties in
Texas, Oklahoma and Arkansas under a Winter Storm Warning hazard code from the
National Weather Service at the same time.
Figure 3.1: National Weather Service spatial alert map on 2/14/21 at 20:32 UTC. The pink shade is Winter Storm
Warning.
A meandering polar front jet stream and a strong upper-level trough (instability) allowed
arctic air to barrel extremely far south from the north pole. An example of this from the
National Weather Service is shown in Figure 3.2. The scientific community have shown
(through modeling) that due to anthropomorphic climate change the upper level winds will
destabilize more and cause more of these cold air intrusions. This is because the strength
of the jet stream is reduced and fluctuations ensue as the system tries to return to a new
equilibrium (with the jet stream retreating northward over time or, equivalently, the tropical
regions of the globe will widen). 19
Figure 3.2: National Weather Service visual of a “Polar Vortex” at jet stream level. 20
19
https://www.nature.com/articles/s41598-019-43823-1
20
https://www.weather.gov/safety/cold-polar-vortex
©Vibrant Clean Energy, LLC - 11 - Boulder, Colorado
info@vibrantcleanenergy.com 23rd March, 2021 VibrantCleanEnergy.comFigure 3.3 shows the upper-level (500 mb) geopotential height contours and wind speeds
from the late evening of February 14th, 2021 (February 15th 2021 at 00 UTC). This is provided
from the Plymouth State Weather Center archives. 21 This shows the upper-level instability
and jet stream trough (dip) which steered the storm. This displays clearly how far south the
polar front jet stream dropped during this time.
Figure 3.3: The mid-level (500 mb) contoured heights with wind speeds overlayed from Plymouth State Weather
Center archives at 00 UTC on February 15th, 2021.
Figure 3.4, reproduced from the NOAA weather archives, shows the surface weather system
that was driven by the upper-level jet stream trough. Early in the morning of February 15th,
2021, a low-pressure system was currently off the Gulf Coast of Texas. The cold front
attached to this system barreled down into northern Mexico. Winds from the north behind
the front allowed cold air from the artic to flow right down into Texas.
Other regional ISOs were also affected. Both SPP and MISO just to the north of ERCOT also
faced extreme conditions and rolling blackouts as well. The coldest temperatures of the
storm overlapped with most of the SPP footprint. SPP also had to implement emergency
procedures. The gravity and culmination of the effects were not as long-lived or as
prominent as they were in ERCOT, however.
21
https://vortex.plymouth.edu/
©Vibrant Clean Energy, LLC - 12 - Boulder, Colorado
info@vibrantcleanenergy.com 23rd March, 2021 VibrantCleanEnergy.comFigure 3.4: Surface Weather Analysis Plot from February 15th, 2021 at 06 UTC. This surface plot is provided from
NOAA’s Weather Prediction Center Archives. 22
22
https://www.wpc.ncep.noaa.gov/archives/web_pages/sfc/sfc_archive.php
©Vibrant Clean Energy, LLC - 13 - Boulder, Colorado
info@vibrantcleanenergy.com 23rd March, 2021 VibrantCleanEnergy.com4 Wind & Solar Renewable Resources
The variable nature of wind and solar resources was brought to the forefront of the
discussion during the blackouts in ERCOT. In short, these resources did experience issues
with snow cover on solar panels and icing on some wind turbines. However, that does not
immediately translate to renewables being the only issue that occurred during this event.
As was observed in Section 2 of this paper, hypothetically, if both the wind and solar
resources were operating at max capacity during this event, these resources would make
up only about 31% of the ERCOT generation mix according to the SARA capacity report. At
its worst, ERCOT had almost 49% of its generation offline. Further, solar and wind power
capacity factors are weather dependent. The forecasting of this event, including snow and
icing on turbines would (or potentially should) have been known. The lack of winterization
of wind turbines, in particular, did contribute its piece to the problems experienced by
ERCOT during this event.
Weather is an integral component to modeling generation from variable renewable energy
sources (such as wind and solar), the efficiency of conventional generators, the transmission
ampacity and electric losses, and the electric demand profiles (specifically traditional
demands, electric space heating, electric water heating and electric vehicle charging). VCE
places a lot of emphasis on the creation and analysis of these data for such reasons.
The raw weather data is obtained from the National Oceanic and Atmospheric
Administration (NOAA) High Resolution Rapid Refresh (HRRR) weather forecast model,
which is a specially configured version of Advanced Research WRF (ARW) model. The HRRR
is run every hour over a 3-km horizontal resolution that covers the continental United States
as well as portions of Canada and Mexico. Since its inception, HRRR has undergone rapid
and continuous improvement to its physical parameterization schemes, many of which
have specifically targeted improved forecasts for the renewable energy sector. For a
meticulous overview of how VCE derives the wind and solar datasets used in the model and
analyzed in this paper, please reference Section 2.4 of our technical documentation. 23
Of particular note here, using these weather datasets allows our model to gain insights into
periods when the sun is not shining and/or the wind is not blowing. The following sections
offer a look at these wind and solar datasets as they pertain to the current fleet of
renewables installed on the ERCOT grid. A mix of the latest EIA 860 Monthly, the 2020/2021
winter SARA seasonal report and the latest resource capacity trends from ERCOT 24 was
used to set a baseline of renewable capacity available during this blackout event in ERCOT.
23
https://vibrantcleanenergy.com/wp-content/uploads/2020/08/WISdomP-Model_Description(August2020).pdf
24
http://www.ercot.com/content/wcm/lists/219848/Capacity_Changes_by_Fuel_Type_Charts_February_2021_monthly.xlsx
©Vibrant Clean Energy, LLC - 14 - Boulder, Colorado
info@vibrantcleanenergy.com 23rd March, 2021 VibrantCleanEnergy.com4.1 ERCOT Wind Analysis
Of particular scrutiny during this event were the wind farms that experienced icing and
frozen conditions. VCE derives weather datasets throughout the rotor diameter layers of
the atmosphere at 3km granularity across the US. This is created for hub heights ranging
from 80 to 240 meters. This includes a rotor-equivalent power, wind speed, temperature,
density and moisture parameter. By default, normal operational temperatures for wind
turbines are set to be between -25oC and 45oC. In addition, the potential for icing is also
calculated. Icing is considered possible when temperatures are below -15oC and cloud-
water mixing ratio is greater than zero. The periods with potential for icing or temperatures
outside of normal operating conditions are set to zero power output. It is important to
identify periods such as the above where generation will be limited or zero as these are
usually correlated with periods of high energy demand. This was the case in the ERCOT
power crisis.
Figure 4.1 shows the time series of ERCOT wind generation alongside the VCE derived wind
generation and the VCE derived temperature at hub height. This is plotted from February
2nd through February 21st. The ERCOT wind generation was downloaded through the EIA
Hourly Grid Monitor. 25 VCE used a combination of the EIA 860 December 2020 Monthly
report and the 2020/2021 winter SARA report to build the latest existing wind farm fleet
for ERCOT for this analysis. There were a few instances where wind farms were synchronized
with the grid but the Commercial Operation Date was still to come according to ERCOT.
Most likely these farms are influencing the grid from time to time. Where possible, VCE
pulled the wind farm hub height from the USGS turbine metadata set. 26 This was then
aligned with the VCE weather data to pull the wind power and temperature closest to the
height of the wind farm hub heights.
Figure 4.1: ERCOT wind generation provided by the EIA Hourly Electric Grid Monitor (blue), ERCOT wind
generation as calculated by the VCE weather datasets (orange) and average wind farm hub height temperature
from the VCE weather datasets (black). This is plotted from February 2nd 2021 through February 21st 2021. The
time zone is set to EST.
https://www.eia.gov/beta/electricity/gridmonitor/dashboard/electric_overview/US48/US48
25
https://eerscmap.usgs.gov/uswtdb/
26
©Vibrant Clean Energy, LLC - 15 - Boulder, Colorado
info@vibrantcleanenergy.com 23rd March, 2021 VibrantCleanEnergy.comFigure 4.1 shows that from February 11th through 21st, but especially on February 15th, the
standard VCE derived generation is much higher than the generation provided by ERCOT.
As described previously, this calculation assumed certain icing condition scenarios. Since it
was apparent that not all Texas wind farms were appropriately winterized, the delta
between these two times series in Fig. 4.1 during this icing event shows the lost opportunity
and gives a proxy for what could have been produced by the wind given proper
winterization. It is still possible with winterization for icing to occur; however, it is not as
easily triggered by atmospheric conditions experienced in the winter storm analyzed. At its
lowest point, the VCE derived average turbine hub height temperature dipped below -15oC
on the 15th. It is apparent that by February 21st, ERCOT had still not regained fully normal
operation from its wind fleet as temperatures were just finally recovering enough by that
time to start dethawing what froze.
Figure 4.2 shows the total difference between the ERCOT wind generation and the VCE
derived wind generation. This plot highlights the difference. The total wind generation
difference from February 10th through February 21st 2021 is 1,570 GWh. It is important to
point out that this may be on the higher side as certain wind farms may have been affected
by the grid itself and not icing. Further, the wind fleet VCE setup has wind plants that are
synchronized with the grid, but not yet fully operational. Lastly, forecast errors in our
dataset could change this difference slightly. This should be used as a proxy of what wind
farms in Texas could have been producing given proper winterization. Peak ERCOT outages
were occurring from February 15th through 16th. When blackouts started occurring during
the early morning on the 15th according to this analysis, over 14 GW of wind power might
have been available given proper winterization. However, the general wind resource was
dropping across Texas on the 15th as high pressure set in following the storm’s passage.
Regardless of turbine icing, other sources of generation would have been necessary during
the 15th to meet demand. Under this scenario with more wind production possible, these
generators could have generated an estimated $5.1 to $5.5 billion in revenue and reduced
the impact of some of the rolling blackouts required (see Figs 4.6 & 4.7).
Figure 4.2: ERCOT wind generation provided by the EIA Hourly Electric Grid Monitor (blue), ERCOT wind
generation as calculated by the VCE weather datasets (orange) and the difference between the two datasets
(cream). This is plotted from February 2nd, 2021 through February 21st, 2021.
Figure 4.3 is the same as Fig. 4.1 except that the icing conditions for the VCE derived wind
generation were updated. Instead of a cold weather shut off at -25oC, this was increased to
©Vibrant Clean Energy, LLC - 16 - Boulder, Colorado
info@vibrantcleanenergy.com 23rd March, 2021 VibrantCleanEnergy.com-15oC. Further, icing was set to occur starting when temperatures dipped below -2oC and
the cloud water mixing ratio was greater than zero. This is meant to mimic the lack of
turbine winterization in Texas more accurately. The resulting series is shown against the
same ERCOT wind generation as before. The two series are far closer in magnitude during
the main icing event from February 10th through February 15th. This plot shows that
additional icing may have been occurring even beyond the updated icing variation. From
the 16th forward, updating the icing conditions does not make a difference in the VCE
derived series since the weather was warming by that time. Turbines were still dethawing,
but weather conditions at that time were not actively adding to that icing. In addition, it
takes time for ERCOT to bring generators back online when they have been disconnected
or demand has been shed.
One additional note from Fig. 4.3, is that the VCE wind power model assumes that the
equipment used within the turbine is properly insulated and that the substations and
transmission lines are available and not impacted by the icing and freezing conditions.
Within a full simulation of WIS:dom®-P, these impacts are able to be taken into account,
but for this comparative analysis, we do not perform such a simulation.
Figure 4.3: ERCOT wind generation provided by EIA’s Hourly Electric Grid Monitor (blue), ERCOT wind
generation with more stringent icing as calculated by VCE’s weather datasets (orange) and average wind farm
hub height temperature from VCE’s weather datasets (black). This is plotted from February 2nd, 2021 through
February 21st, 2021.
For complete comparison, Fig. 4.4 is similar to Fig. 4.2, but now the VCE generation has the
updated icing conditions included. We also plot the fully winterized VCE estimated
generation to allow comparison around how the generation with winterization would have
increased further.
©Vibrant Clean Energy, LLC - 17 - Boulder, Colorado
info@vibrantcleanenergy.com 23rd March, 2021 VibrantCleanEnergy.comFigure 4.4: ERCOT wind generation provided by the EIA Hourly Electric Grid Monitor (blue), ERCOT wind
generation as calculated by the VCE weather datasets with more stringent icing conditions (orange) and the
difference between the two datasets (cream). The regular VCE ERCOT wind generation with typical icing criteria
is plotted for comparison (gray). This is plotted from February 2nd, 2021 through February 21st, 2021.
Figure 4.5 below shows the area difference between the standard way (full winterization)
VCE accounts for icing and the more stringent or harsher icing criteria. This shows that icing
conditions ceased starting on the 15th, but that turbine dexterity did not return through the
21st.
Figure 4.5: ERCOT wind generation provided by the EIA Hourly Electric Grid Monitor (blue), ERCOT wind
generation as calculated by the VCE weather datasets with more stringent icing conditions (orange) and the
regular VCE ERCOT wind generation with typical icing criteria is plotted for comparison (gray). The cream
shaded area shows the difference between the normal VCE icing criteria and the more stringent update. This is
plotted from February 2nd, 2021 through February 21st, 2021.
There are many ways wind farms are set up for power sales on the grid. From PPA to
merchant, exposures to prices vary depending on the entity setup. During the ERCOT
energy crisis, power bid in the day ahead for many wind sites was not available in real-time.
This meant certain units were required to buy power from the spot market which was at
market price cap for several days consistently. The layers of profit or loss vary greatly
especially depending on participation in the virtual and bilateral markets. Figure 4.6 shows
the value of wind generation production if everything produced during this period was sold
in the Day Ahead Market. Figure 4.7 shows the value of wind generation production if
©Vibrant Clean Energy, LLC - 18 - Boulder, Colorado
info@vibrantcleanenergy.com 23rd March, 2021 VibrantCleanEnergy.comeverything produced was sold in the Real-time Market. Both figures show three series: the
VCE derived winterized wind generation, the VCE derived non-winterized wind generation
and the ERCOT wind generation. In both figures, the cumulative value of each series is
provided from February 10th through February 20th. In reality, the value will be somewhere
in between as over production and under production from day ahead offers would be
addressed in the real-time market. This is meant to provide book end values. Further, this
does not address any charges incurred for not meeting obligation. It is clear though the
loss of value that occurred without proper winterization. The capability to produce more
during this time was available.
Figure 4.6: Day Ahead Market value if all wind generation was sold at those prices. The VCE Winterized Wind
Generation (blue), VCE Non-Winterized Wind (orange) and ERCOT wind generation (gray) are considered. This is
plotted from February 2nd, 2021 through February 21st, 2021.
Figure 4.7: Real-time Market value if all wind generation was sold at those prices. VCE Winterized Wind
Generation (blue), VCE Non-Winterized Wind (orange) and ERCOT wind generation (gray) are considered. This is
plotted from February 2nd, 2021 through February 21st, 2021.
Figure 4.8 shows the wind power generation from all ISOs across the contiguous US plotted
with data from the EIA Hourly Electric Grid Monitor. The night of the 15th going into the
16th, when ERCOT wind generation was lowest, both PJM and MISO had an anti-correlated
uptick in wind generation. The storm that had moved east from Texas was producing
tighter pressure gradients and higher winds speeds in other areas. This affected the north
eastern portions of MISO and both the east and west portions of PJM. This suggests that a
more interconnected national grid would be beneficial from an extreme events perspective
because spatial diversity can help alleviate impacts. These benefits are just another example
of why a national grid overlay would help the United States adapt to the future generation
mix and climate consequences.
©Vibrant Clean Energy, LLC - 19 - Boulder, Colorado
info@vibrantcleanenergy.com 23rd March, 2021 VibrantCleanEnergy.comFigure 4.8: ISO wind power generation provided by the EIA Hourly Electric Grid Monitor for all ISOs across the
contiguous US. This is plotted from February 2nd, 2021 through February 21st, 2021. February 10th through 21st is
highlighted in black to point out the difficult period in ERCOT. The time zone is set to EST.
Figure 4.9 shows the same information as Fig. 4.8 except this is the VCE derived weatherized
wind power production over this period. This is using our standard weatherization for icing
criteria. The WIS:dom-P model uses this information to dispatch and optimally build
generation and transmission in future scenarios.
Figure 4.9: ISO wind power generation derived by VCE using standard icing criteria for all ISOs across the
contiguous US. ERCOT is the bolded orange series. This is plotted from February 2nd, 2021 through February 21st,
2021. February 10th through 21st is highlighted in black to point out the difficult period in ERCOT. The time zone
is set to EST.
Figure 4.10: Illustration of two HVDC transmission lines connecting ERCOT with MISO and SPP. The connection
points are illustrative and do not represent actual siting preferences.
©Vibrant Clean Energy, LLC - 20 - Boulder, Colorado
info@vibrantcleanenergy.com 23rd March, 2021 VibrantCleanEnergy.comTo provide a quantitative hypothetical example, we assume that two high-voltage direct
current (HVDC) transmission lines have been constructed. One between ERCOT and MISO
and the other between ERCOT and SPP. These two transmission lines would cost
approximately $1.2 billion each to construct (total cost $2.4 billion). HVDC is assumed
because ERCOT and MISO/SPP are not synchronized and this transmission technology
allows these types of grids to be connected together without synchronization. Figure 4.10
shows a cartoon illustration of the HVDC connections.
Since MISO and SPP were also encountering some difficulties during the winter storm, we
note that the timings of the difficulties are not entirely coincident; therefore, the
connections to/from ERCOT benefit MISO, SPP and ERCOT with resource sharing as the
weather marches across the different regions. Our analysis here, though, only considers the
benefits to ERCOT. We further note that the 6,000 MW of HVDC connections would not
have alleviated the all of the issues that ERCOT experienced. Even at full rated power, the
HVDC transmission lines could not cover all of the lost demand.
For the HVDC transmission lines to be effective, more generation would be necessary in
both MISO and SPP. We assume an increase in MISO and SPP capacity of 20% for this
example. We assume that the wind is generating exactly as the existing wind in MISO and
SPP. Further analysis is required to produce a more robust analysis of the interaction
between the RTOs using grid simulations (with, e.g., WIS:dom-P).
Figure 4.11: The wind power that the HVDC transmission lines could add to ERCOT from MISO (yellow) and SPP
(blue). These are stacked upon the ERCOT local generation from wind. These values are scaled from the actual
production reported in each RTO. The time zone is set to EST.
Figure 4.11 shows the wind power that could have been imported to ERCOT from MISO
and SPP. These values are given from scaling the actual production reported from both
RTOs. It shows that for the ERCOT lowest wind generation, MISO and SPP could have added
2,400 MW from the HVDC connections. Further, the second lowest point could have
provided 1,200 MW in wind generation to ERCOT. In addition, the HVDC capacities total
6,000 MW, therefore, there would be 3,600 MW of additional capacity that could be
supplemented with other generation. Over the blackout period, the HVDC enabled wind
from MISO and SPP could have provided 515 GWh of generation.
In Fig 4.12, we show the same data as in Fig. 4.11, but replace the actual reported
generation with the VCE hypothetical generation from wind if full winterization had been
established for all wind generation in ERCOT, MISO and SPP. Note that the MISO
generation does not change very much at all, since most of the wind in that RTO is
winterized. SPP changes upwards slightly, suggesting that some wind in that RTO is not
©Vibrant Clean Energy, LLC - 21 - Boulder, Colorado
info@vibrantcleanenergy.com 23rd March, 2021 VibrantCleanEnergy.comfully winterized. Finally, the ERCOT wind generation increases enormously. The increase in
ERCOT wind generation suggests that before the blackouts in ERCOT, the HVDC
transmission lines could have been used to export wind to assist MISO and SPP as the
storm had already arrived over those footprints.
Figure 4.12: The wind power that the HVDC transmission lines could add to ERCOT from MISO (yellow) and SPP
(blue). These are stacked upon the ERCOT local generation from wind. These values are scaled from the VCE
winterized possible wind generation in each RTO. The time zone is set to EST.
Figure 4.12 shows that winterization of wind across MISO and SPP would have enabled an
additional 1,052 MW of generation to be provided to support ERCOT at the lowest
generation point and an additional 1,000 MW at the second lowest point. The additional
generation would total 128 GWh over the blackout period (643 GWh vs the 515 GWh from
reported data).
This example is simplistic because we are assuming that the HVDC links exist and there is
excess capacity built in MISO and SPP. The purpose of the example is to highlight the
decorrelation between the RTOs in terms of timings for the wind generation changes and
how that decorrelation could be used to support each grid. The cost of the HVDC
transmission is low compared with alternatives. It would be even more effective as a
national grid structure that could share power much further away. 27,28
Much more analysis and studies can be performed to compute the exact values of
transmission, generation, and interconnection that could have resolved the issues that
ERCOT experienced. The main point that we make with this lengthy section is that wind
actually provided support over the winter storm and with intelligent planning could have
provided much more. This is in contrast to many reports on the effectiveness of wind power
during the terrible crisis.
27
https://www.vibrantcleanenergy.com/wp-content/uploads/2016/09/Future_cost-competitive_electricity_syst.pdf
28
https://www.vibrantcleanenergy.com/wp-content/uploads/2020/10/EIC-Transmission-Decarb.pdf
©Vibrant Clean Energy, LLC - 22 - Boulder, Colorado
info@vibrantcleanenergy.com 23rd March, 2021 VibrantCleanEnergy.com4.2 ERCOT Solar Analysis
Solar is not a large piece of the installed capacity across ERCOT. However, it is certainly one
of the fastest growing technologies in the region. As such, the loss of solar during this event
was not felt as keenly as from the wind resource. Similar to wind, the ERCOT solar fleet was
determined from a mix of EIA 860 December monthly data as well as the 2020/2021 SARA
winter seasonal assessment information. The derived solar data was pulled based on the
solar installation metadata. Since a solar plant’s technology is not as readily available
information as wind farm hub height, the solar technology pulled from the VCE weather
datasets is the single axis tracking pitched to latitude tilt.
Figure 4.13 shows the ERCOT solar generation from the EIA Hourly Electric Grid Monitor
from February 2nd through February 21st, 2021. For the same time frame, the VCE derived
ERCOT solar generation is also plotted. It is apparent when the system with cloud cover
and snow went through ERCOT. Quickly though, after the storm passed, the solar
generation starts to bounce back on February 15th. By the 19th, the solar had mostly
recovered.
In fact, solar performed better than the ERCOT SARA values would have expected and this
generation contributed to helping keep more customers with power as the grid climbed
out of its depths of load shedding.
Figure 4.13: ERCOT solar generation provided by the EIA Hourly Electric Grid Monitor (blue) and ERCOT solar
generation as calculated by the VCE weather datasets (orange). This is plotted from February 2nd 2021 through
February 21st, 2021. The time zone is set to EST.
©Vibrant Clean Energy, LLC - 23 - Boulder, Colorado
info@vibrantcleanenergy.com 23rd March, 2021 VibrantCleanEnergy.com5 Natural Gas Resource Overview
Natural gas technologies account for the largest makeup of the ERCOT generator mix.
Hardware components at certain natural gas units froze as temperatures dipped to their
lowest the night of February 14th into the 15th. Further, natural gas supply lines ran low on
supply and pipelines lost pressure. Some pipelines also froze. Figure 5.1 shows natural gas
generation from February 2nd through February 21st, 2021. ERCOT provided preliminary
outage data with several disclaimers. 29 One caveat is that not all generators provided the
outage data in advance of the 60-day confidentiality period usually in place for this
information. This data was provided to ERCOT by ERCOT-registered resource entities. The
outage data was only available through the worst part of these events, February 14th
through the end of February 19th. At its worst, over 17,000 MW of natural gas was offline
in this preliminary data. This occurred in the early morning of February 15th.
Figure 5.1: ERCOT natural gas generation provided by the EIA Hourly Electric Grid Monitor (blue), ERCOT natural
gas generation with preliminary outage data added back in (orange), the difference between these two series
(cream) and the SARA 2021/2021 winter assessment for natural gas winter capacities (gray). This is plotted from
February 2nd through February 21st, 2021. Outage data was only available from February 14th through February
19th, 2021. The time zone is set to EST.
The total lost generation due to outages reported by ERCOT and EIA in Fig. 5.1 is almost
exactly the generation that wind could have provided under full winterization assumptions.
Therefore, it might have been possible, with the correct amount of storage to have avoided
the failures in the grid altogether. The costs of doing so might be such that it is not feasible;
however, with better winterization and planning, it seems from first glance to be solvable.
29
http://www.ercot.com/content/wcm/lists/226521/Unit_Outage_Data_20210304__Public_.xlsx
©Vibrant Clean Energy, LLC - 24 - Boulder, Colorado
info@vibrantcleanenergy.com 23rd March, 2021 VibrantCleanEnergy.com6 High Renewable Grid Performance
VCE operates the WIS:dom-P model, a fully-combined capacity expansion and production
cost model that has been used to develop and analyze future pathways which the US
energy grid could take given certain criteria and policy. VCE created one such study across
the US, which required a clean electricity by 2050 and co-optimization with Distributed
Energy Resources (DER) available. 30 The layout and capacity of renewables from such a
scenario was run through the same analysis as provided in Section 4. Wind and solar (utility
and distributed) installations from this model run were aligned with the VCE weather
datasets. Since future hub heights are unknown, all wind was pulled from the 100m level.
With hub heights becoming taller this was representative of where the industry was headed.
On the solar side, the single axis tracking pitched to latitude tilt was used for utility scale
units. The VCE derived distributed solar values was used for distributed solar installations.
This information was analyzed for the ERCOT region in Fig. 6.1 during the February energy
crisis.
Figure 6.1: ERCOT wind generation as calculated by the VCE weather datasets (green), ERCOT utility solar
generation as calculated by the VCE weather datasets (red) and ERCOT distributed solar generation as calculated
by the VCE weather datasets (orange). This is plotted for weather from February 2nd, 2021 through February 21st,
2021 with assets from a hypothetical 2050 clean energy grid WIS:dom-P scenario.
Figure 6.2: ERCOT wind (green), utility solar (red), and distributed solar generation (orange) as calculated by the
VCE weather datasets. This is plotted from February 2nd, 2021 through February 21st, 2021 for a hypothetical
clean energy grid scenario from a 2050 WIS:dom-P model run.
Figure 6.2 shows the same plot as Fig. 6.1 except here the icing criteria is more aligned with
a non-winterized wind setup.
30
The data from a scenario (CE-DER) was taken from this recent VCE report:
https://www.vibrantcleanenergy.com/wp-content/uploads/2020/12/WhyDERs_TR_Final.pdf
©Vibrant Clean Energy, LLC - 25 - Boulder, Colorado
info@vibrantcleanenergy.com 23rd March, 2021 VibrantCleanEnergy.comIt is apparent that during the 15th of February, solar would have been one of the
technologies standing in as the wind resource was dropping throughout that day. The night
of the 16th when both the wind and solar resources were incredibly low, WIS:dom would
have had to find other avenues to support the grid at this time. In the scenario presented,
ERCOT has ~40 GW (with 40 hours) of storage deployed by 2050. This would have covered
all the shed load in combination with the wind and solar.
More analysis is required to dive deeper into the future generation mixes and how the
system would respond. WIS:dom-P already include a decade of high resolution weather
data that it must solve against. It must carry reserves (planning and following). This event
has highlighted the need to update the planning reserve margin formulations for “firm”
generation. These should have a time-varying, temperature / weather derived, probability
of outage applied, such that the events that transpired in ERCOT are never repeated. This
would solidify understanding across the industry that all assets and infrastructure on the
electricity system are weather dependent and must be treated as such. Of course, some
assets are more sensitive to weather than others.
From the perspective of VCE, it would be instructive to run future simulations through these
extreme weather events to analyze how robust the solutions are and whether these
pathways need to be enhanced for future uncertain volatile weather events.
©Vibrant Clean Energy, LLC - 26 - Boulder, Colorado
info@vibrantcleanenergy.com 23rd March, 2021 VibrantCleanEnergy.comYou can also read


