Liver Fibrosis and Inflammation under the Control of - ERK2 - MDPI
←
→
Page content transcription
If your browser does not render page correctly, please read the page content below
Article
Liver Fibrosis and Inflammation under the Control of
ERK2
Kuo-Shyang Jeng, Ssu-Jung Lu, Chih-Hsuan Wang and Chiung-Fang Chang *
 Division of General Surgery and Department of Medical Research, Far Eastern Memorial Hospital, No.21,
 Sec. 2, Nanya S. Rd., Banciao Dist., New Taipei City 220, Taiwan, R.O.C.; kevin.ksjeng@gmail.com (K.-S.J.);
 sunnylu312@gmail.com (S.-J.L.); joyce.walawala@gmail.com (C.-H.W.)
 * Correspondence: cfchang.gina@gmail.com; Tel.: +886-2-7728-4564

 Received: 15 April 2020; Accepted: 25 May 2020; Published: 27 May 2020

 Abstract: Chronic liver injury could lead the formation of liver fibrosis, eventually some would
 develop to hepatocellular carcinoma (HCC), one of the leading malignancies worldwide. The aim
 of the study is to dissect the role of extracellular signal-regulated kinase 2 (ERK2) signaling in liver
 fibrosis and inflammation. The choline-deficient, ethionine-supplemented (CDE) diet could lead to
 fatty livers and generate oval cells, activate hepatocyte stellate cell (HSC) and recruit immune cells
 as the liver fibrosis model mice. WT and ERK2 deficient (ERK2−/−) mice were compared in terms of
 liver weight/body weight, liver function, liver fibrosis markers and the differential gene expression
 in hepatotoxicity. ERK2−/− mice display the less degree of liver fibrosis when compared to WT mice.
 The protein level of alpha smooth muscle (α-SMA) was reduced and several hepatocellular
 carcinoma-related genes such as MMP9, FoxM1 were down-regulated. In addition, the cell
 proliferation and the percentages of activated T cells were reduced in ERK2−/− mice upon liver injury.
 Therefore, ERK2 plays an important role in regulating liver cirrhosis and inflammation.

 Keywords: ERK2; MAPK; liver cirrhosis; liver inflammation

1. Introduction
      Liver fibrosis is one of major causes of morbidity worldwide [1,2]. Aberrant apoptotic
hepatocytes and activated hepatic stellate cells (HSC) are involved in the process of liver cirrhosis.
Alpha smooth muscle (alpha-SMA) is a marker for liver fibrosis [3,4]. In chronic liver diseases, liver
cell death and collagen accumulation could lead to release chemokines for recruiting immune cells
[5,6]. Long-term irreversible liver damage could result in advanced liver diseases such as
hepatocellular carcinoma (HCC), one of the leading causes of cancer-related deaths worldwide [7,8].
The treatment of HCC is still a challenge, with 1-year survival rates of 20% and a median survival of
8 months [9]. Sorafenib is a multi-kinase inhibitor as the first line treatment for the late stage HCC
[10,11]. However, it could only extend the median survival by about three months. Therefore, it is
important to understand the detail mechanism of liver cirrhosis for developing potential diagnosis
biomarkers or drug target in preventing its progression to HCC [12].
      Extracellular signal-regulated kinase (ERK) belongs to mitogen-activated protein kinase
(MAPK) pathway, which the cascade is under the control of RAF protein, MEK1/2 and ERK1/2. The
phosphorylation of ERK could directly regulate the downstream gene expression. Erk1 deficient mice
display normal liver function whereas ERK2 plays a pivotal mediator in hepatocyte cell cycle [13,14].
ERK1 deficiency mice display normal protein level of the cell cycle related protein and kinase for
proliferation [13]. Increased ERK activity contributes to liver energy metabolism [15]. Besides, ERK2
could be involved in the suppression of ER stress in high sucrose and high fat diet [16]. The down-
regulation of RAF kinase inhibitory protein (RKIP) promotes ERK signaling and thereby results in
serious liver fibrosis [17].

Int. J. Mol. Sci. 2020, 21, 3796; doi:10.3390/ijms21113796                           www.mdpi.com/journal/ijms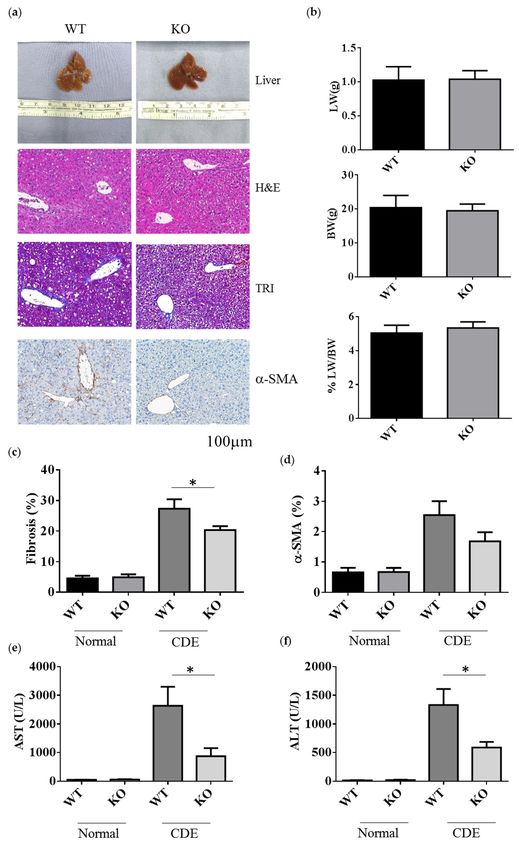
Int. J. Mol. Sci. 2020, 21, 3796                                                                2 of 19

     The simultaneous activation of ERK and AKT pathways enhance cell cycle progression in
Hepatitis B virus (HBV)-replicating hepatocytes whereas HCV envelop protein activates the ERK
pathway to facilitate human hepatoma cell proliferation and survival [18]. ERK signaling pathway
plays a crucial role in HCC cell growth, cell migration and epithelial-mesenchymal transition (EMT)
development [19–21]. The phosphorylation of ERK could be a potential marker to represent the
sensitivity of sorafenib for HCC treatment and show a significant correlation with a decreased overall
survival [22,23]. ERK substrate Egr1 has been found to promote angiogenesis, fibrogenesis and
tumorigenesis in HCC [24]. Inhibition of MAPK signaling pathway could reduce cell proliferation,
decrease cancer stem cell expression and increase apoptosis in hepatoma cells [25–27].
     Patients with liver fibrosis/cirrhosis have higher risks of developing HCC [7,28]. By
understanding the detail mechanism for ERK signaling in liver fibrosis would be helpful to identify
potential targets to prevent the process from liver fibrosis to HCC. In this study, the role of ERK2 in
liver fibrosis and liver inflammation would be investigated in transgenic mice (Erk2 deficient mice)
under the liver fibrosis mouse model.

2. Results

2.1. Erk2-Deficient Mice Displayed Normal Liver but Reduced Body Weight under the Normal Chow Diet
     WT and Erk2-deficient (Erk2−/−, KO) livers under normal chow diet appear similar in terms of
liver color, liver sections for hematoxylin and eosin (H&E) staining, Masson’s Trichrome (TRI)
staining and the staining of liver fibrosis protein α-SMA and ERK2 (Figure 1a). In H&E and TRI
staining, KO livers appear normal as WT livers. The liver weight is similar between WT and Erk2−/−
mice. However, the body weight in Erk2−/− mice is slightly lower than WT mice. Therefore, the
percentages of liver weight to body weight in Erk2−/− mice were higher than those of WT mice (Figure
1b). The percentages of α-SMA in KO liver sections were similar to that in WT sections. It suggested
Erk2-/- livers appear normal as WT liver under the normal chow diet.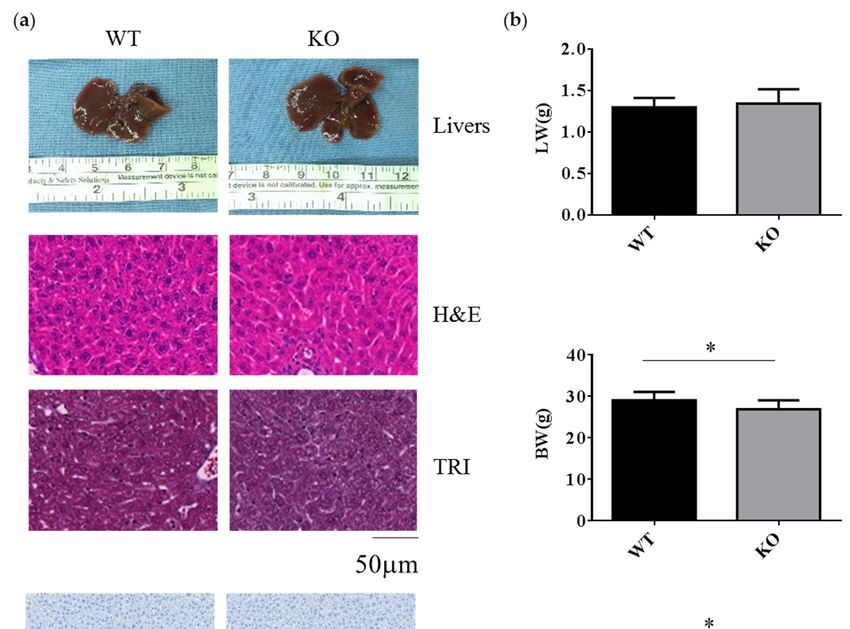
Int. J. Mol. Sci. 2020, 21, 3796                                                                      3 of 19

      Figure 1. Decreased body weight and increased the percentages of liver weight to body weight in
      Erk2−/− (KO) livers. (a) The representative livers, liver histology (H&E, hematotoxylin and eosin
      staining), liver fibrosis (TRI, Trichrome staining) or immunostaining of α-SMA and ERK2 of the WT
      and Erk2−/− (KO) mice was under the chow diet (normal diet) treatment; (b) The liver weights (LW),
      body weight (BW), and the percentages of liver weight to body weight in Wild-type (WT) and Erk2−/−
      (KO) were represented as mean+/− SE under normal diet with tamoxifen injection. (WT, n = 9; KO, n
      = 8). (* p < 0.05).

2.2. Erk2-/- Mice Displayed Less Degree of Liver Fibrosis upon Short-Term Liver Injury
      To examine the role of Erk2 in liver fibrosis, WT and Erk2−/− (KO) mice were fed with the choline-
deficient with supplemented for ethionine (CDE) diet to induce liver fibrosis. WT and Erk2−/− liver
were examined for liver weight, body weight and tissues sections for H&E, TRI and α-SMA staining
(Figure 2a). After CDE diet treatment, the color of livers turned into brown (Figure 2a first panel).
The body weights, liver weights, and the percentages of liver weight to body weight were similar in
WT and Erk2−/− mice (Figure 2b). In H&E staining, more infiltrated cells and oval cell hyperplasia
were found in WT livers when compared with Erk2−/− livers (Figure 2a second panel). The percentages
of fibrosis were calculated by the percentages of collagen area (in blue) to the whole images in the
TRI staining. There were no significant differences in the degree of liver fibrosis of WT and Erk2−/−
livers under normal chow diet. However, the percentages of liver fibrosis in WT livers was
significantly higher than Erk2−/− livers by TRI staining (Figure 2a,c). The percentages of α-SMA in KO
liver sections were similar to that in WT sections with the normal chew diet (Figure 2a,d). However,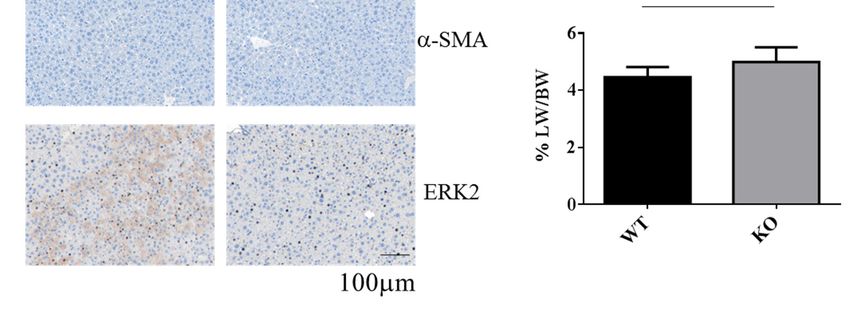
Int. J. Mol. Sci. 2020, 21, 3796                                                                  4 of 19

the percentages of α-SMA staining reduced in Erk2−/− livers when compared to WT livers upon the
CDE diet (Figure 2a,d).
     The degree of liver fibrosis is significantly different in WT and Erk2−/− mice under liver injury by
the CDE diet, the levels of aspartate aminotransferase (AST) and alanine aminotransferase (ALT)
were examined. Liver cirrhosis could increase the level of AST and ALT. The mouse serum levels of
AST and ALT under CDE diet increased 30–50× fold when compared to those under normal chow
diet in WT mice (Figure 2e,f). Moreover, Erk2−/− mice displayed significantly lower level of AST and
ALT than WT mice under the CDE diet treatment (Figure 2e,f). Taken together, Erk2 plays a role in
liver fibrosis upon the short-term liver injury.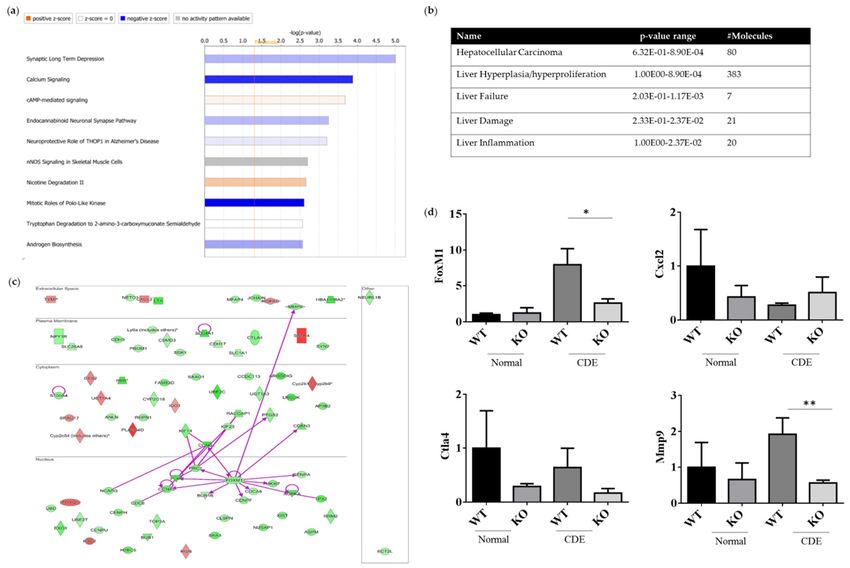
Int. J. Mol. Sci. 2020, 21, 3796 5 of 19
Int. J. Mol. Sci. 2020, 21, 3796                                                                              6 of 19

      Figure 2. Decreased the degrees of fibrosis in Erk2−/− livers. (a) The representative liver histology (H&E
      staining) or liver fibrosis (TRI staining), alpha-SMA of the WT and Erk2−/− (KO) mice after the CDE
      treatment; (b) The percentages of liver weights to body weights were presented (n = 15); (c) The
      percentages of fibrosis from the TRI staining were quantitated by inform software (Normal-WT,
      Normal-KO n = 3, 6 fields each sample, total 18 fields. CDE-WT, CDE-KO n = 5, 6 fields each sample,
      total 30 fields). (*p < 0.05); (d) The percentages of α-SMA from the immunohistochemistry staining
      were quantitated by inform software. (WT, KO n = 3, 6 fields each sample, total 18 fields). (e) (f) The
      serum level of ALT and AST was measured. Normal chew diet: WT (n = 12), KO (n = 9); CDE diet: WT
      (n = 11), KO (n = 11). Data were represented as mean +/− SE and were considered significant if * p <
      0.05.

2.3. Reduction of Gene and Protein Expression Level in Fibrosis Genes alpha-SMA in Erk2−/− Livers
     Egr1 is one of downstream genes of ERK signaling. As expected, Egr1 gene expression would be
down-regulated in Erk2−/− (KO) livers when compared to WT livers (Figure 3a). CDE diet could
induce oval cells proliferation and liver cirrhosis-related gene expression. Alpha-SMA (Asma)
expression is positively correlated with the degree of fibrosis. It is one of specific markers for liver
fibrosis and hepatocyte stellate cells (HSCs) activation. The level of alpha-SMA is higher in WT livers
under the CDE diet when compared to WT under the normal diet (Figure 3b). Erk2−/− (KO) mice
express less level of liver cirrhosis genes than WT (Figure 3b). In addition, there is a significant
reduction in the protein level of alpha-SMA in Erk2−/− livers when compared to WT livers under the
CDE diet treatment (Figure 3c,d). As expected, the protein level of ERK2 and phos-ERK2 was
significantly lower in Erk2−/− livers in the comparison with WT livers (Figure 3c,d).
Int. J. Mol. Sci. 2020, 21, 3796 7 of 19
Figure 3. Erk2−/− (KO) livers express less cirrhosis gene α-SMA than WT livers. Gene expression of
Egr1(a), alpha-SMA(b) were determined by QPCR. Data were normalized by the average of
expression level in WT under the normal chew diet (WT, normal) as 1. Data were represented as mean
+/− SE and were considered significant if * p < 0.05; ** p < 0.01. WT (n = 4), KO (n = 4); (c) WT and Erk2−/−
livers were subjected to Western Blotting and analyzed for protein expression in alpha-SMA,
phospho-ERK (P-ERK1 and P-ERK2), ERK (ERK1 and ERK2) and loading control glyceraldehyde-3-
phosphate dehydrogenase (GAPDH); (d) Protein expression were quantized by Image J and
normalized by the expression of GAPDH. The relative protein expression level was shown. (WT n =
4; KO n = 4; * p < 0.05; ** p < 0.01).
2.4. Reduction of Cell Proliferation in Erk2−/− Livers upon Liver Fibrosis
Since there was a significant difference in the degree of fibrosis in WT and Erk2−/− (KO) livers, it
would be interesting to investigate whether the differences of cell proliferation or apoptosis areInt. J. Mol. Sci. 2020, 21, 3796 8 of 19
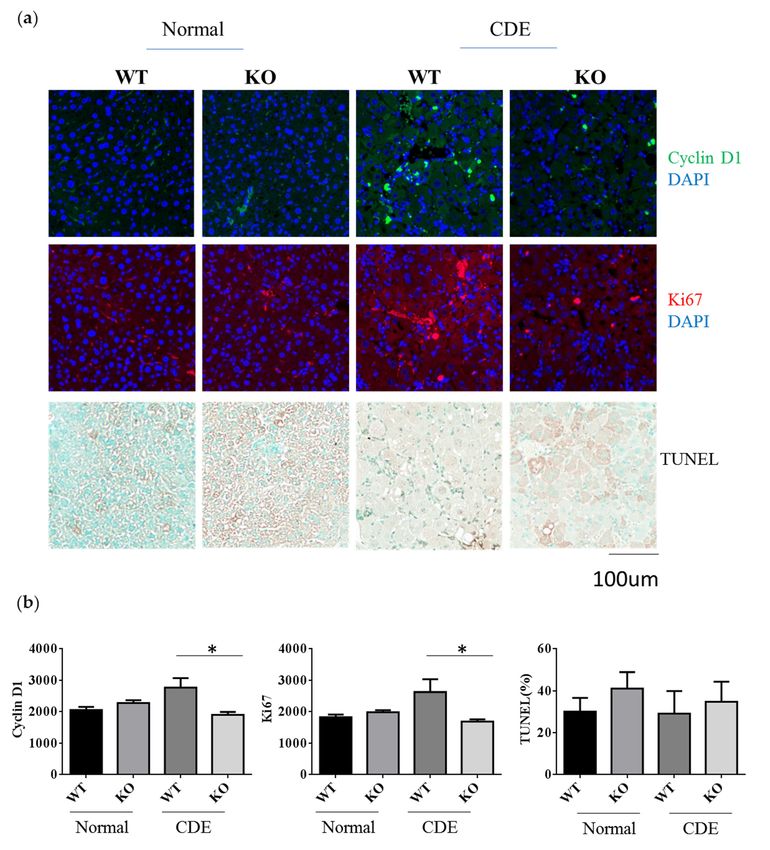
significant between two groups. Cyclin D1 plays an important role in cell cycle and ki-67 labels
proliferative response. The average intensities of Cyclin D1 and Ki-67 were similar in WT and KO
under the normal diet (Figure 4a,b). There was a significant reduction of Cyclin D1 and Ki-67 in KO
livers when compared to WT livers under the CDE diet (Figure 4a,b). The terminal deoxynucleotidyl
transferase dUTP nick end labeling (TUNEL) stains for the apoptotic cells. The percentages of TUNEL
positive area were similar in WT and Erk2−/− (KO) livers (Figure 4a,b). Although the percentages of
TUNEL positive area are higher in KO livers, it is not significant. Taken together, Erk2 deficiency
could lead to significant reduction in liver cell proliferation.
Figure 4. Reduction of cell proliferation in Erk2−/− (KO) mice under the CDE diet. (a) WT and Erk2−/−
liver sections were stained with cyclin D1 and ki-67 with DAPI staining for nucleus. Liver sections
were stained with TUNEL assay kit HRP-DAB; (b) The average intensities of cyclin D1 and ki-67were
measured by MetaXpress analysis software. (WT, KO n = 3, 6 fields each sample, total 18 fields). The
percentages of TUNEL positive area (brown) were quantitated by inform software (WT, KO n = 3, 6
fields each sample, total 18 fields; * p < 0.05).
2.5. Reduced Activated T Cells in Erk2−/− (KO) upon the CDE Diet Treatment
The T cell responses were examined to address the degree of liver inflammation upon the CDE
diet treatment. The percentages of CD4 and CD8 T cells were about 11–19% and 8–15% in WT andInt. J. Mol. Sci. 2020, 21, 3796 9 of 19
Erk2−/− livers (Figure 5a left panel). There were no significant differences in the percentages of CD4
and CD8 T cells in WT and Erk2−/− livers (Figure 5b,c left panel). The percentages of CD44+ in CD4 T
cells were about 70% in WT livers and 41% in Erk2−/− (KO) livers (Figure 5a middle panel). There is a
significant reduction in the percentages of activated CD4 T cells (CD4+CD44+) in KO livers (Figure
5b). In addition, the percentages of activated CD8 T cells (CD8+CD44+) reduced significantly in KO
livers when compared to WT livers (Figure 5a right panel, c). It suggested that less activation of T cell
responses in Erk2−/− (KO) livers upon liver fibrosis.
In addition, the immune responses in liver fibrosis and the degree of liver fibrosis could be
regulated by the cytokines or chemokines. CCL3 could increase proliferation and migration of hepatic
stellate cells (HSCs). There was a significant reduction in CCL3 expression in KO livers compared to
WT liver upon the CDE diet (Figure 5c upper left panel). However, the level of CCL3 is too low to be
detected in mouse serum. Besides, IL-6 induces hepatic inflammation and collagen synthesis. The
level of IL-6 increased in the CDE diet group when compared to the normal chow diet group (Figure
5c upper right panel, 5d). However, there were no significant differences in WT and KO livers or
serum. HSCs and Kupffer cells (KCs) can express TGFβ to inhibit T cell activation and proliferation.
There were no significant differences in gene expression level of TGFβ in WT and KO livers upon the
CDE diet. Moreover, CCL20 mediates the process for liver fibrosis. The gene expression level of
CCL20 is lower than other cytokines such as CCL3, IL-6, TGFβ. Although the relative CCL20 gene
expression level is higher in KO livers, there were no significant differences between WT and KO
livers (Figure 5c bottom right panel). Although the serum levels of CCL20 were higher in the CDE
diet group than normal chow diet group, there were no differences between WT and KO serum
(Figure 5d).Int. J. Mol. Sci. 2020, 21, 3796 10 of 19
Figure 5. Reduced activated T cells in Erk2−/− (KO) upon the CDE diet treatment. (a) hepatic
lymphocytes from WT and Erk2−/− (KO) livers were stained for T cells (CD4 or CD8) and activated
markers (CD44). The percentages of CD4, CD8, CD44+/CD4+ and CD44+/CD8+ T cells were shown inInt. J. Mol. Sci. 2020, 21, 3796 11 of 19
representative WT and Erk2−/− (KO) liver; (b) The percentages of CD4 T cells and CD44+/CD4+ T cells
were represented as mean +/− SE (WT n = 12; KO n = 12); (c) The percentages of CD8 T cells and
CD44+/CD8+ T cells were represented as mean +/− SE (WT n = 12; KO n = 12). The differences between
WT and KO were considered significant if p < 0.05. (** p < 0.01; *** p < 0.001); (d) Gene expression of
Ccl3, IL-6, TGF-β and Ccl20 were determined by QPCR. Data were normalized by the average of
expression level in WT under the normal chew diet (WT, normal) as 1. Data were represented as mean
+/− SE and were considered significant if * p < 0.05; ** p < 0.01. WT (n = 4), KO (n = 4); (e) the serum
level of IL-6 and CCL20 was measured. Normal chew diet: WT (n = 6), KO (n = 6); CDE diet: WT (n =
7, KO (n = 7). Data were represented as mean +/− SE and were considered significant if * p < 0.05.
2.6. Differentially Expression Genes (DEGs) of WT and Erk−/− Livers upon Liver Injury
Both the gene expression profiles WT and Erk2−/− (KO) livers under the CDE diet treatment were
subjected to next-generation sequencing analysis for the whole gene expression profiles. The top 10
canonical signaling pathways were identified from differential expression genes (DEGs) (Figure 6a).
MAPK1 (ERK2) is involved in the top 2 to 4 canonical signaling pathways, including calcium
signaling, cAMP-mediated signaling and endocannabinoid Neuronal Synapse Pathway (Table S1).
ERK2 deficiency could lead to reduction in the canonical pathway mitotic roles of Polo-like kinase
for cell cycle and cell division. In addition, DEGs of WT and Erk2−/− livers under the CDE diet were
further classified in hepatotoxicity. There were 80 molecules in hepatocellular carcinoma with a p-
value form 6.32E-01 to 8.90E-04 (Figure 6b and Table S2). Moreover, 383 DEGs are found in liver
hyperplasia/hyperproliferation and 7–21 DEGs were identified in liver failure, liver damage and liver
inflammation (Figure 6b and Table S2).
The direct interactions of DEGs for HCC were represented (Figure 6c). 66 genes were down-
regulated in green whereas 14 genes were up-regulated in red, when comparing the expression
profiles of Erk2−/− and WT livers under liver fibrosis. Our data suggested FoxM1 is down-regulated
in liver injury in the absence of ERK2. Previous studies demonstrated ERK signaling could induce
Forkhead Box M1 (FoxM1) to promote trophoblast cell invasion and mediate TGF-β-induced EMT in
non-small cell lung cancer [29,30]. FoxM1 directly interacts with many HCC-related molecules such
as cyclin B1(CNNB1), protein regulator of cytokinesis (PRC1), polo-like kinase 1 (PLK1), cyclin A2
(CCNA2), BUB mitotic checkpoint serine/threonine kinase B (BUB1B), centromere protein F (CENPF),
cell division cycle associated protein 8 (CDCA8), aurora kinase A (AURKA), marker of proliferation
Ki-67 (MKI67), centromere protein A (CENPA) and MMP9 (Figure 6c). EMT marker MMP 9 is down-
regulated in Erk2−/− livers. Moreover, the stem cell marker CD133 (PROM1) is also down-regulated
in Erk2−/− livers. On the other sides, up-regulated genes include somatostatin receptor 4 (SSTR4),
phospholipase A2 group IVD (PLA2G4D), cytochrome P450 family 2, subfamily b, polypeptide 9
(Cyp2b9) etc. The gene expression of FoxM1, Cxcl2, Ctla4 and Mmp9 were confirmed by the
quantitative polymerase chain reaction (qPCR). In addition, the gene expression levels of Cxcl2, Ctla4
and Mmp9 by Q-PCR is to confirm the next generation sequencing (NGS) data. It has similar results
that Erk2−/− (KO) livers reduced the expression of FoxM1, Ctla4, Mmp9 and increased the expression
of Cxcl2 when compared to WT liver upon the CDE diet (Figure 6d).Int. J. Mol. Sci. 2020, 21, 3796 12 of 19
Figure 6. ERK2-regulated differential expression genes (DEGs) in canonical signaling pathways.
DEGs from WT and Erk2−/− livers under the CDE diet treatment (each group, n = 5) were subjected to
the analysis of canonical signaling pathways. (a) Top-10 enriched canonical signaling pathways
identified by Ingenuity Pathway Analysis. Orange, activated; blue, inhibited; gray, no activity pattern
available. (Positive z-score, activation; negative z-score, inhibition). (b) Erk2-dependent DEGs in
hepatotoxicity. (c) 80 DEGs in HCC were represented in red (up-regulation) and green (down-
regulation). The direct interactions were shown in purple solid arrows. Molecules are shown in their
locations such as extracellular space, plasma membrane, cytoplasm, nucleus and other. (d) Gene
expression of FoxM1, Cxcl2, Ctla4, and Mmp9 were determined by QPCR. Data were normalized by
the average of gene expression level in WT under the normal chew diet (WT, normal) as 1. Data were
represented as mean +/− SE and were considered significant if *p < 0.05; ** p < 0.01. WT (n = 4), KO (n
= 4).
3. Discussion
Liver fibrosis/cirrhosis is associated with aberrant apoptosis of hepatocytes, collagen formation
and hepatic lymphocyte inflammation [31,32]. ERK signaling pathway modulates different cellular
responses in liver fibrogenesis of hepatic myofibroblasts [33]. ERK2 plays a more important role than
ERK1 because ERK2 expression in livers display normal function with ERK1 deficiency [13,14]. ERK1
deficiency mice display normal proliferation with the normal protein level of the cyclin D1, Cdk1 and
BrDU [13]. It demonstrated ERK1 is dispensable for hepatocyte replication. It is correlated with the
study that ERK1−/− mice are viable and have normal sizes [34]. However, the inhibition of ERK2
expression abolished the DNA synthesis. ERK2 could have a positive role in controlling cell
proliferation. Therefore, this study focused on the role of ERK2 in liver fibrosis.
Erk2−/− mice display less degree of liver fibrosis in the comparison to WT mice in terms of the
expression of fibrosis markers alpha-SMA, collagen staining by TRI and liver enzymes (AST, ALT).
Alpha-SMA is a detective marker for the early stage fibrosis [35]. The expression of phos-ERK is
positively correlated with the expression of alpha-SMA in HCC patients [36]. In hepatic cell line,
apelin could activate ERK signaling to increase alpha-SMA, collagen I and cyclin D1 [37]. ERK
signaling could activate type I collagen in fibroblasts [38]. It is agreed with our study that ERK2 plays
an important role in regulating the liver fibrosis. In liver fibrosis model (Methionine-choline deficient,Int. J. Mol. Sci. 2020, 21, 3796 13 of 19
MCD diet), the levels of ALT AST of mice were about 500 and 900 U/L [39]. In this study, the levels
of ALT were over 1000 U/L in WT mice under the CDE diet treatment. It could depend on the mice
variance. Although the levels of AST and ALT in our study were higher, the differences between WT
and KO were still significant. Liver fibrosis is involved in the imbalance of cell proliferation and
apoptosis. ERK2 signaling is required for cell proliferation and survival [40]. In this study, ERK2
deficient livers express less cyclin D1 and Ki-67. It suggested less proliferation occurs in ERK2
deficient liver upon the process of fibrosis. It could be a reason that ERK2 deficient mice display less
degree of liver fibrosis.
In addition, hepatic inflammatory cells include activated T lymphocytes such as CD4+CD44+
and CD8+CD44+ cells [41]. ERK2−/− hepatic lymphocytes display less the percentages of CD44
expression in the comparison to WT upon liver fibrosis. CD44 is a key marker for the hepatic
inflammation and strongly up-regulated in non-alcoholic steatohepatitis (NASH) patients [42].
Moreover, CD44 is a cancer stem cell marker and mediates signaling pathways for tumor
differentiation, invasion, and metastasis [43]. The CD44 and CD133 expression increased with the
grades of inflammation and stages with fibrosis upon virus infection [44]. The expression of CD133
was down-regulated in Erk2−/− livers when compared to WT livers in this study.
In addition, the cytokines and chemokine regulates liver fibrosis and immune responses. CCL3
is a mediator of experimental liver fibrosis [45]. CCL3-/- mice less stellate cell activity and express less
α-SMA. There was a significant reduction in Ccl-3 gene expression in KO livers. It is similar ERK2−/−
and CCL3−/− mice had less degree of liver fibrosis. However, the level of CCL3 could not be detected
in WT and KO mice serum. IL-6 induces hepatic inflammation and collagen synthesis [46,47]. HSCs
and KCs can express TGFβ to inhibit T cell activation and proliferation. In addition, CCL20 is up-
regulated in liver fibrosis diseases [48]. However, there were no significant differences in IL-6, TGFβ,
CCL20 in WT and Erk2−/− livers.
Several DEGs of HCC markers were down-regulated in Erk2−/− mice under the liver fibrosis.
HCC displays the heterogeneity of histopathological characteristics [49]. Therefore, it is necessary to
identify the molecular mechanisms of ERK2-dependent biomarkers in the process of liver cirrhosis,
even to HCC. In particular, the expression of FoxM1 was reduced in Erk2−/− livers in the comparison
with WT livers. FoxM1 could promote cell proliferation, EMT and metastasis in human HCC [50–52].
In mouse model, FoxM1 drives inflammation responses for liver fibrosis and hepatocarcinogenesis
[53]. It is possible that FoxM1 is down-regulated to reduce inflammation responses in absence of
ERK2. Therefore, Erk2−/− livers display less degree of liver fibrosis than WT livers.
MMP9 belongs to matrix metalloproteinase family involved in liver injury, repair, and fibrosis
[54]. The balance between MMP and extracellular matrix (ECM) protein is important for liver
homeostasis. MMP9 expression is detected in the early stages of hepatic fibrogenesis. The X protein
of HBV could induce MMP9 expression through ERK and PI3K pathway in HCC [55]. Our study
demonstrated ERK2 signaling could regulate MMP9 expression in liver fibrosis mouse model.
Moreover, CD133 (PROM1) is a progenitor cell marker in liver and cancer stem cell marker in HCC
[56,57]. CD133 positive HCC cell clone have constitutively express the phosphorylation of ERK1/2
[58]. It suggested less CD133 expression were found in liver fibrosis in absence of ERK2 signaling. If
altering ERK signaling could reduce the degree of liver fibrosis, it would slow down the process from
liver fibrosis to HCC. Therefore, our study provides the new insight that altering ERK signaling
pathway by ERK2 deficiency alone could reduce liver fibrosis and inflammatory responses.
4. Materials and Methods
4.1. Mice and CDE Diet Treatment
The Erk2f/f is generated by Dr. April Fischer and Dr. Stephen M. Hedrick [59,60]. The ERCre
mice is kindly provided by Dr. Luwig [61]. The Erk2f/f. ERCre were generated by the cross of Erk2f/f
mice and ERCre mice. All animal experiments were approved IACUC of Far Eastern Memorial
Hospital (No. 105-01-37-C2). 7–8 weeks old wild-type and Erk2f/f. ERCre mice were injected i.p. with
2mg tamoxifen (Sigma, St. Louis, MO, USA) for five consecutive days to induce Erk2 deletion inInt. J. Mol. Sci. 2020, 21, 3796 14 of 19
Erk2f/f. ERCre mice as Erk2−/− mice. Livers were harvested 6 weeks after normal chow diet or choline-
deficient (#518753, DYETS Inc., Bethlehem, PA, USA) ethionine (Sigma)-supplemented (CDE) diet.
4.2. Histology
Liver tissue were fixed in formalin and embedded in parafilm wax. Liver sections were stained
with hematoxylin and eosin (H&E) according to the standard protocol. Masson’s Trichrome (TRI)
Stain was used to examine the degree of liver fibrosis due to increasement of collagen. TRI stain
represents three acidic dyes: aniline blue to stain collagen, acid fuchsin for cytoplasm or muscle
(bright-red) and orange G for red blood cells. For immunohistochemistry staining, liver tissue
sections were stained with primary antibody against alpha-SMA (Abcam #124964, Cambridge, UK).
The secondary antibody conjugated with HRP (Abcam #406401) and DAB substrate kit (Abcam
#ab64238) were used to visualize the signal. To measure hepatocyte apoptosis, the TUNEL assay was
performed on liver paraffin section label the 3-end of fragmented DNA by an apoptosis detection kit
according to the manufacturer’s instructions (Abcam #206386). All images were acquired on a
LUMAR12 inverted microscope (Olympus Corp., Tokyo, Japan) with Nuance Multispectral image
acquisition software system (PerkinElmer, Waltham, MA, USA). The images were quantified by
inform software (PerkinElmer). Foe immunofluorescence staining, liver tissues were stained for
cyclin D1 (Millipore Corp., Burlington, MA, USA) followed by the secondary antibody conjugated
with fluorescein isothiocyanate (FITC) and Ki-67-e615 (ebioscience Inc., San Diego, CA, USA ). All
images were acquired on the ImageXpress Micro 4 system and analyzed MetaXpress High-Content
Image Acquisition and Analysis Software (Molecular Devices LLC., San Jose, CA, USA).
4.3. Serum Analysis of ALT and AST
The serum levels of ALT and AST were measured by the Hitachi 7080 autobiochemical analyzer
(Hitachi Ltd., Tokyo, Japan) in the National Laboratory Animal Center, Taiwan. The mouse serum
levels of IL-6 and CCL20 were measured by the ELISA kit (Biolegend Inc.,San Diego, CA, USA)
4.4. RNA Isolation and Quantitative Gene Expression
Total RNA was isolated from liver cells using RNeasy plus mini kit (Qiagen Inc., Redwood city,
CA, USA) according to the manufacture’s protocol. Total RNA was reversely transcripted to cDNA
by high capacity cDNA RT kit (Applied Biosystems Inc., Foster, CA, USA). The mRNA expression
was under analysis using real-time PCR machine Roche LightCycler480 (Roche Applied Science,
Mannheim, Germany). The level of target gene expression was obtained by the normalization to the
endogenous gene (GAPDH).
4.5. Western Blotting
Cell lysates were collected by lysis buffer on ice and the protein concentrations was determined
with the BCA assay (PierceTM #23227, ThermoFisher Scientific, Rockford, IL, USA). Protein samples
were loaded into gels and electrophoresed on 10% gels depends on the molecular weight of protein.
Separated proteins gels were transferred to PVDF membranes and then blocked with 5% BSA
blocking buffer for 30 min prior to primary antibody incubation. The primary antibody was used at
room temperature for 2 h including a rabbit polyclonal antibody against mouse ERK1/2 (Cell
signaling #9102, Danvers, MA, USA), Phos-ERK (Cell signaling #9101), alpha-SMA (Abcam#124964)
and GAPDH (Abcam #181602) as an internal control. The secondary antibodies with HRP conjugated
were used and detected by using enhanced chemiluminescence (ECL). Images were captured and
analyzed densitometrically by LAS 3000 imaging system (Fujifilm Corp., Tokyo, Japan). Software
Image J was used to quantify the protein expression of alpha-SMA and ERK2 normalized by GAPDH.
4.6. Flow Cytometry
Hepatic lymphocytes were subjected to flow cytometry analysis. Cells were stained for
Fluorescent-labeled antibodies against CD4, CD8 and CD44 (Biolegend Inc., San Diego, CA, USA).Int. J. Mol. Sci. 2020, 21, 3796 15 of 19
Samples were subjected and collected from the flow cytometer FACS Calibur (BD Sciences, San Jose,
CA, USA). Data were analyzed by the Flowjo software (Tree Star Inc., Ashland, OR, USA).
4.7. RNA Sequencing
Total RNA was isolated from liver cells using the RNeasy plus mini kit (Qiagen, Redwood city,
CA, USA) according to the manufacture’s protocol. RNA was fragmented for RNA libraries by using
200–500 ng of total RNA according to TrueSeq Stranded mRNA kit (Illumina, San Diego, CA, USA).
For sequencing, mRNA library was subjected to HiSeq 3000/4000 PE Cluster kit and analyzed by
HiSeq4000 (Illumina). Post sequencing base calling and adaptor trimming were used by the
Trimmomatic. Data mapping were analyzed by the Bowtie 2 software (Johns Hopkins University,
Baltimore, MD, USA) and gene expression were analyzed by RSEM software. Gene reads were
normalized by fragments mapped per kilo base length of the transcript per million reads (FPKM)
method. EBseq software (Bioconductor, R package) and Ingenuity Pathway Analysis (IPA, Qiagen)
software was used to analyze the differential gene expression (DGE) from WT and Erk2−/− livers.
DGEs were selected from the gene expression of fold change (KO/WT) is less 0.5-fold and over 2-fold.
4.8. Statistical Analysis
Statistical analysis and graphs were created by GraphPad Prism software (GraphPad software,
San Diego, CA, USA). All the data was reported as mean ± standard error. Comparisons between
different groups were performed using the t-test. p < 0.05 was considered statistically significant.
5. Conclusions
ERK2−/− mice display the reduction in the degree of liver fibrosis and less inflammation under
liver fibrosis mouse model. ERK2 signaling pathway regulates the progression liver fibrosis through
multiple HCC-related biomarkers such as FoxM1, MMP9, CD133 etc. ERK2 deficiency could lead to
reduction in cell proliferation in liver fibrosis. In conclusion, altering ERK signaling pathway by ERK2
deficiency could reduce liver fibrosis and inflammatory responses.
Supplementary Materials: Supplementary materials can be found at www.mdpi.com/1422-0067/21/11/3796/s1.
Table S1. Gene list of Erk2 regulated DEGs in the top 10 canonical signaling pathways; Table S2. Gene list of
Erk2 regulated DEG in hepatotoxicity.
Author Contributions: Conceptualization, K.-S.J. and C.-F.C.; methodology, S.-J.L., C.-H.W. and C.-F.C.;
validation, investigation, K.-S.J., S.-J.L., C.-H.W. and C.-F.C.; writing—original draft preparation, K.-S.J. and C.-
F.C.; project administration, supervision and funding acquisition, C.-F.C. All authors have read and agreed to
the published version of the manuscript.
Funding: This research was funded by the Ministry of Science and Technology, Taiwan, grant number “MOST
106-2314-B-418-001-MY3, MOST 105-2320-B418-001, MOST 104-2314-B-418-018”, Far Eastern Memorial Hospital,
grant number “FEMH-106-2314-B-418-001-MY3, FEMH-2019-C-078, FEMH-2020-C-092” and Far Eastern
Memorial Hospital-National Yang-Ming University Joint Research Program, grant number “107DN17,
108DN28, 109DN28”.
Acknowledgments: We appreciate all support and equipment from the Core Laboratory and the Animal
Laboratory of Far Eastern Memorial Hospital, Taiwan.
Conflicts of Interest: The authors declare no conflict of interest.
Abbreviations
HCC Hepatocellular carcinoma
ERK Extracellular signal-regulated kinase 2
CDE Choline-deficient, ethionine-supplemented
HSC Hepatocyte stellate cell
alpha- Alpha smooth muscle
SMAInt. J. Mol. Sci. 2020, 21, 3796 16 of 19
MAPK Mitogen-activated protein kinase
RKIP RAF kinase inhibitory protein
HBV Hepatitis B virus
EMT Epithelial-mesenchymal transition
H&E Hematoxylin and eosin
TRI Masson’s Trichrome
LW Liver weight
BW Body weight
CDE Choline-deficient with supplemented for ethionine
AST Aspartate aminotransferase
ALT Alanine aminotransferase
GAPDH Glyceraldehyde-3-phosphate dehydrogenase
TUNEL Terminal deoxynucleotidyl transferase dUTP nick end labeling
KCs Kupffer cells
DEGs Differential expression genes
FoxM1 Forkhead Box M1
CNNB1 Cyclin B1
PRC1 Protein regulator of cytokinesis
PLK1 Polo-like kinase 1
CCNA2 Cyclin A2
BUB1B BUB mitotic checkpoint serine/threonine kinase B
CENPF Centromere protein F
CDCA8 Cell division cycle associated protein 8
AURKA Aurora kinase A
MKI67 Marker of proliferation Ki-67
CENPA Centromere protein A
SSTR4 Somatostatin receptor 4
PLA2G4D Phospholipase A2 group IVD
Cyp2b9 Cytochrome P450 family 2, subfamily b, polypeptide 9
qPCR quantitative polymerase chain reaction
NGS Next generation sequencing
MCD Methionine-choline deficient
NASH Non-alcoholic steatohepatitis
ECM Extracellular matrix
FITC Fluorescein isothiocyanate
References
1. Tsochatzis, E.A.; Bosch, J.; Burroughs, A.K. Liver cirrhosis. Lancet 2014, 383, 1749–1761, doi:10.1016/S0140-
6736(14)60121-5.
2. Asrani, S.K.; Devarbhavi, H.; Eaton, J.; Kamath, P.S. Burden of liver diseases in the world. J. Hepatol. 2019,
70, 151–171, doi:10.1016/j.jhep.2018.09.014.
3. Yoshida, S.; Ikenaga, N.; Liu, S.B.; Peng, Z.W.; Chung, J.; Sverdlov, D.Y.; Miyamoto, M.; Kim, Y.O.; Ogawa,
S.; Arch, R.H.; et al. Extrahepatic platelet-derived growth factor-beta, delivered by platelets, promotes
activation of hepatic stellate cells and biliary fibrosis in mice. Gastroenterology 2014, 147, 1378–1392,
doi:10.1053/j.gastro.2014.08.038.
4. Carpino, G.; Morini, S.; Ginanni Corradini, S.; Franchitto, A.; Merli, M.; Siciliano, M.; Gentili, F.; Onetti
Muda, A.; Berloco, P.; Rossi, M.; et al. Alpha-SMA expression in hepatic stellate cells and quantitative
analysis of hepatic fibrosis in cirrhosis and in recurrent chronic hepatitis after liver transplantation. Dig.
Liver Dis. 2005, 37, 349–356, doi:10.1016/j.dld.2004.11.009.
5. Xu, R.; Zhang, Z.; Wang, F.S. Liver fibrosis: Mechanisms of immune-mediated liver injury. Cell. Mol.
Immunol. 2012, 9, 296–301, doi:10.1038/cmi.2011.53.
6. Pellicoro, A.; Ramachandran, P.; Iredale, J.P.; Fallowfield, J.A. Liver fibrosis and repair: immune regulation
of wound healing in a solid organ. Nat. Reviews. Immunol. 2014, 14, 181–194, doi:10.1038/nri3623..Int. J. Mol. Sci. 2020, 21, 3796 17 of 19
7. Siegel, R.L.; Miller, K.D.; Jemal, A. Cancer statistics, 2020. Ca Cancer J. Clin. 2020, 70, 7–30,
doi:10.3322/caac.21590.
8. Llovet, J.M.; Zucman-Rossi, J.; Pikarsky, E.; Sangro, B.; Schwartz, M.; Sherman, M.; Gores, G. Hepatocellular
carcinoma. Nat. Rev. Dis Primers 2016, 2, 16018, doi:10.1038/nrdp.2016.18.
9. Olsen, S.K.; Brown, R.S.; Siegel, A.B. Hepatocellular carcinoma: Review of current treatment with a focus
on targeted molecular therapies. Ther. Adv. Gastroenterol. 2010, 3, 55–66, doi:10.1177/1756283X09346669.
10. Llovet, J.M.; Ricci, S.; Mazzaferro, V.; Hilgard, P.; Gane, E.; Blanc, J.F.; de Oliveira, A.C.; Santoro, A.; Raoul,
J.L.; Forner, A.; et al. Sorafenib in advanced hepatocellular carcinoma. New Engl. J. Med. 2008, 359, 378–390,
doi:10.1056/NEJMoa0708857.
11. Kim, H.Y.; Park, J.W. Molecularly targeted therapies for hepatocellular carcinoma: Sorafenib as a stepping
stone. Dig. Dis. 2011, 29, 303–309, doi:10.1159/000327563.
12. Li, H.; Zhang, L. Liver regeneration microenvironment of hepatocellular carcinoma for prevention and
therapy. Oncotarget 2016, 10.18632/oncotarget.12101, doi:10.18632/oncotarget.12101.
13. Fremin, C.; Ezan, F.; Boisselier, P.; Bessard, A.; Pages, G.; Pouyssegur, J.; Baffet, G. ERK2 but not ERK1
plays a key role in hepatocyte replication: An RNAi-mediated ERK2 knockdown approach in wild-type
and ERK1 null hepatocytes. Hepatology 2007, 45, 1035–1045, doi:10.1002/hep.21551.
14. Aroor, A.R.; Jackson, D.E.; Shukla, S.D. Elevated activation of ERK1 and ERK2 accompany enhanced liver
injury following alcohol binge in chronically ethanol-fed rats. Alcohol. Clin. Exp. Res. 2011, 35, 2128–2138,
doi:10.1111/j.1530-0277.2011.01577.x.
15. Jiao, P.; Feng, B.; Li, Y.; He, Q.; Xu, H. Hepatic ERK activity plays a role in energy metabolism. Mol. Cell.
Endocrinol. 2013, 375, 157–166, doi:10.1016/j.mce.2013.05.021.
16. Kujiraoka, T.; Satoh, Y.; Ayaori, M.; Shiraishi, Y.; Arai-Nakaya, Y.; Hakuno, D.; Yada, H.; Kuwada, N.;
Endo, S.; Isoda, K.; et al. Hepatic extracellular signal-regulated kinase 2 suppresses endoplasmic reticulum
stress and protects from oxidative stress and endothelial dysfunction. J. Am. Heart Assoc. 2013, 2, e000361,
doi:10.1161/JAHA.113.000361.
17. Huang, Q.; Liang, C.; Wei, L.; Nie, J.; Lu, S.; Lu, C.; Zhuo, L.; Lu, Z.; Lin, X. Raf Kinase Inhibitory Protein
Down-Expression Exacerbates Hepatic Fibrosis In Vivo and In Vitro. Cell. Physiol. Biochem. 2016, 40, 49–61,
doi:10.1159/000452524.
18. Min, L.; He, B.; Hui, L. Mitogen-activated protein kinases in hepatocellular carcinoma development. Semin.
Cancer Biol. 2011, 21, 10–20, doi:10.1016/j.semcancer.2010.10.011.
19. Bessard, A.; Fremin, C.; Ezan, F.; Fautrel, A.; Gailhouste, L.; Baffet, G. RNAi-mediated ERK2 knockdown
inhibits growth of tumor cells in vitro and in vivo. Oncogene 2008, 27, 5315–5325, doi:10.1038/onc.2008.163.
20. Gailhouste, L.; Ezan, F.; Bessard, A.; Fremin, C.; Rageul, J.; Langouet, S.; Baffet, G. RNAi-mediated MEK1
knock-down prevents ERK1/2 activation and abolishes human hepatocarcinoma growth in vitro and in
vivo. Int. J. Cancer 2010, 126, 1367–1377, doi:10.1002/ijc.24950.
21. Son, H.; Moon, A. Epithelial-mesenchymal Transition and Cell Invasion. Toxicol. Res. 2010, 26, 245–252,
doi:10.5487/TR.2010.26.4.245.
22. Zhang, Z.; Zhou, X.; Shen, H.; Wang, D.; Wang, Y. Phosphorylated ERK is a potential predictor of sensitivity
to sorafenib when treating hepatocellular carcinoma: Evidence from an in vitro study. BMC Med. 2009, 7,
41, doi:10.1186/1741-7015-7-41.
23. Schmitz, K.J.; Wohlschlaeger, J.; Lang, H.; Sotiropoulos, G.C.; Malago, M.; Steveling, K.; Reis, H.; Cicinnati,
V.R.; Schmid, K.W.; Baba, H.A. Activation of the ERK and AKT signalling pathway predicts poor prognosis
in hepatocellular carcinoma and ERK activation in cancer tissue is associated with hepatitis C virus
infection. J. Hepatol. 2008, 48, 83–90, doi:10.1016/j.jhep.2007.08.018.
24. Ueda, T.; Honda, M.; Horimoto, K.; Aburatani, S.; Saito, S.; Yamashita, T.; Sakai, Y.; Nakamura, M.;
Takatori, H.; Sunagozaka, H.; et al. Gene expression profiling of hepatitis B- and hepatitis C-related
hepatocellular carcinoma using graphical Gaussian modeling. Genomics 2013, 101, 238–248,
doi:10.1016/j.ygeno.2013.02.007.
25. Chen, J.; Ji, T.; Zhao, J.; Li, G.; Zhang, J.; Jin, R.; Liu, J.; Liu, X.; Liang, X.; Huang, D.; et al. Sorafenib-resistant
hepatocellular carcinoma stratified by phosphorylated ERK activates PD-1 immune checkpoint. Oncotarget
2016, 7, 41274–41284, doi:10.18632/oncotarget.8978.
26. Yip-Schneider, M.T.; Klein, P.J.; Wentz, S.C.; Zeni, A.; Menze, A.; Schmidt, C.M. Resistance to mitogen-
activated protein kinase kinase (MEK) inhibitors correlates with up-regulation of the MEK/extracellularInt. J. Mol. Sci. 2020, 21, 3796 18 of 19
signal-regulated kinase pathway in hepatocellular carcinoma cells. J. Pharmacol. Exp. Ther. 2009, 329, 1063–
1070, doi:10.1124/jpet.108.147306.
27. Liu, Y.; Wang, X.; Sun, C.Y.; Wang, J. Delivery of mitogen-activated protein kinase inhibitor for
hepatocellular carcinoma stem cell therapy. ACS Appl. Mater. Interfaces 2015, 7, 1012–1020,
doi:10.1021/am508262j.
28. Raza, A.; Sood, G.K. Hepatocellular carcinoma review: Current treatment, and evidence-based medicine.
World J. Gastroenterol. 2014, 20, 4115–4127, doi:10.3748/wjg.v20.i15.4115.
29. Xie, Y.; Cui, D.; Sui, L.; Xu, Y.; Zhang, N.; Ma, Y.; Li, Y.; Kong, Y. Induction of forkhead box M1 (FoxM1)
by EGF through ERK signaling pathway promotes trophoblast cell invasion. Cell Tissue Res. 2015, 362, 421–
430, doi:10.1007/s00441-015-2211-y.
30. Kong, F.F.; Zhu, Y.L.; Yuan, H.H.; Wang, J.Y.; Zhao, M.; Gong, X.D.; Liu, F.; Zhang, W.Y.; Wang, C.R.; Jiang,
B. FOXM1 regulated by ERK pathway mediates TGF-beta1-induced EMT in NSCLC. Oncol. Res. 2014, 22,
29–37, doi:10.3727/096504014X14078436004987.
31. Chakraborty, J.B.; Oakley, F.; Walsh, M.J. Mechanisms and biomarkers of apoptosis in liver disease and
fibrosis. Int. J. Hepatol. 2012, 2012, 648915, doi:10.1155/2012/648915.
32. Fabregat, I.; Roncero, C.; Fernandez, M. Survival and apoptosis: A dysregulated balance in liver cancer.
Liver Int. 2007, 27, 155–162, doi:10.1111/j.1478-3231.2006.01409.x.
33. Foglia, B.; Cannito, S.; Bocca, C.; Parola, M.; Novo, E. ERK Pathway in Activated, Myofibroblast-Like,
Hepatic Stellate Cells: A Critical Signaling Crossroad Sustaining Liver Fibrosis. Int. J. Mol. Sci. 2019, 20,
doi:10.3390/ijms20112700.
34. Pages, G.; Guerin, S.; Grall, D.; Bonino, F.; Smith, A.; Anjuere, F.; Auberger, P.; Pouyssegur, J. Defective
thymocyte maturation in p44 MAP kinase (Erk 1) knockout mice. Science 1999, 286, 1374–1377,
doi:10.1126/science.286.5443.1374.
35. Hirabaru, M.; Mochizuki, K.; Takatsuki, M.; Soyama, A.; Kosaka, T.; Kuroki, T.; Shimokawa, I.; Eguchi, S.
Expression of alpha smooth muscle actin in living donor liver transplant recipients. World J. Gastroenterol.
2014, 20, 7067–7074, doi:10.3748/wjg.v20.i22.7067.
36. Xie, Y.X.; Liao, R.; Pan, L.; Du, C.Y. ERK pathway activation contributes to the tumor-promoting effects of
hepatic stellate cells in hepatocellular carcinoma. Immunol. Lett. 2017, 188, 116–123,
doi:10.1016/j.imlet.2017.06.009.
37. Wang, Y.; Song, J.; Bian, H.; Bo, J.; Lv, S.; Pan, W.; Lv, X. Apelin promotes hepatic fibrosis through ERK
signaling in LX-2 cells. Mol. Cell. Biochem. 2019, 460, 205–215, doi:10.1007/s11010-019-03581-0.
38. Bhogal, R.K.; Bona, C.A. Regulatory effect of extracellular signal-regulated kinases (ERK) on type I collagen
synthesis in human dermal fibroblasts stimulated by IL-4 and IL-13. Int. Rev. Immunol. 2008, 27, 472–496,
doi:10.1080/08830180802430974.
39. Stankovic, M.N.; Mladenovic, D.R.; Duricic, I.; Sobajic, S.S.; Timic, J.; Jorgacevic, B.; Aleksic, V.; Vucevic,
D.B.; Jesic-Vukicevic, R.; Radosavljevic, T.S. Time-dependent changes and association between liver free
fatty acids, serum lipid profile and histological features in mice model of nonalcoholic fatty liver disease.
Arch. Med. Res. 2014, 45, 116–124, doi:10.1016/j.arcmed.2013.12.010.
40. D’Souza, W.N.; Chang, C.F.; Fischer, A.M.; Li, M.; Hedrick, S.M. The Erk2 MAPK regulates CD8 T cell
proliferation and survival. J. Immunol. 2008, 181, 7617–7629.
41. Koyama, Y.; Brenner, D.A. Liver inflammation and fibrosis. J. Clin. Investig. 2017, 127, 55–64,
doi:10.1172/JCI88881.
42. Patouraux, S.; Rousseau, D.; Bonnafous, S.; Lebeaupin, C.; Luci, C.; Canivet, C.M.; Schneck, A.S.; Bertola,
A.; Saint-Paul, M.C.; Iannelli, A.; et al. CD44 is a key player in non-alcoholic steatohepatitis. J. Hepatol. 2017,
67, 328–338, doi:10.1016/j.jhep.2017.03.003.
43. Schulte, L.A.; Lopez-Gil, J.C.; Sainz, B., Jr.; Hermann, P.C. The Cancer Stem Cell in Hepatocellular
Carcinoma. Cancers 2020, 12, doi:10.3390/cancers12030684.
44. Rozeik, M.S.; Hammam, O.A.; Ali, A.I.; Magdy, M.; Khalil, H.; Anas, A.; Abo El Hassan, A.A.; Rahim, A.A.;
El-Shabasy, A.I. Evaluation of CD44 and CD133 as markers of liver cancer stem cells in Egyptian patients
with HCV-induced chronic liver diseases versus hepatocellular carcinoma. Electron. Physician 2017, 9, 4708–
4717, doi:10.19082/4708.
45. Heinrichs, D.; Berres, M.L.; Nellen, A.; Fischer, P.; Scholten, D.; Trautwein, C.; Wasmuth, H.E.; Sahin, H.
The chemokine CCL3 promotes experimental liver fibrosis in mice. PLoS ONE 2013, 8, e66106,
doi:10.1371/journal.pone.0066106.Int. J. Mol. Sci. 2020, 21, 3796 19 of 19
46. Choi, I.; Kang, H.S.; Yang, Y.; Pyun, K.H. IL-6 induces hepatic inflammation and collagen synthesis in vivo.
Clin. Exp. Immunol. 1994, 95, 530–535, doi:10.1111/j.1365-2249.1994.tb07031.x.
47. Schmidt-Arras, D.; Rose-John, S. IL-6 pathway in the liver: From physiopathology to therapy. J. Hepatol.
2016, 64, 1403–1415, doi:10.1016/j.jhep.2016.02.004.
48. Chu, X.; Jin, Q.; Chen, H.; Wood, G.C.; Petrick, A.; Strodel, W.; Gabrielsen, J.; Benotti, P.; Mirshahi, T.; Carey,
D.J.; et al. CCL20 is up-regulated in non-alcoholic fatty liver disease fibrosis and is produced by hepatic
stellate cells in response to fatty acid loading. J. Transl. Med. 2018, 16, 108, doi:10.1186/s12967-018-1490-y.
49. Jeng, K.S.; Chang, C.F.; Jeng, W.J.; Sheen, I.S.; Jeng, C.J. Heterogeneity of hepatocellular carcinoma
contributes to cancer progression. Crit. Rev. Oncol. Hematol. 2015, 94, 337–347,
doi:10.1016/j.critrevonc.2015.01.009.
50. Yu, M.; Tang, Z.; Meng, F.; Tai, M.; Zhang, J.; Wang, R.; Liu, C.; Wu, Q. Elevated expression of FoxM1
promotes the tumor cell proliferation in hepatocellular carcinoma. Tumour Biol. 2016, 37, 1289–1297,
doi:10.1007/s13277-015-3436-9.
51. Chai, N.; Xie, H.H.; Yin, J.P.; Sa, K.D.; Guo, Y.; Wang, M.; Liu, J.; Zhang, X.F.; Zhang, X.; Yin, H.; et al.
FOXM1 promotes proliferation in human hepatocellular carcinoma cells by transcriptional activation of
CCNB1. Biochem. Biophys. Res. Commun. 2018, 500, 924–929, doi:10.1016/j.bbrc.2018.04.201.
52. Meng, F.D.; Wei, J.C.; Qu, K.; Wang, Z.X.; Wu, Q.F.; Tai, M.H.; Liu, H.C.; Zhang, R.Y.; Liu, C. FoxM1
overexpression promotes epithelial-mesenchymal transition and metastasis of hepatocellular carcinoma.
World J. Gastroenterol. 2015, 21, 196–213, doi:10.3748/wjg.v21.i1.196.
53. Kurahashi, T.; Yoshida, Y.; Ogura, S.; Egawa, M.; Furuta, K.; Hikita, H.; Kodama, T.; Sakamori, R.; Kiso, S.;
Kamada, Y.; et al. Forkhead Box M1 Transcription Factor Drives Liver Inflammation Linking to
Hepatocarcinogenesis in Mice. Cell. Mol. Gastroenterol. Hepatol. 2020, 9, 425–446,
doi:10.1016/j.jcmgh.2019.10.008.
54. Duarte, S.; Baber, J.; Fujii, T.; Coito, A.J. Matrix metalloproteinases in liver injury, repair and fibrosis. Matrix
Biol. 2015, 44–46, 147–156, doi:10.1016/j.matbio.2015.01.004.
55. Chung, T.W.; Lee, Y.C.; Kim, C.H. Hepatitis B viral HBx induces matrix metalloproteinase-9 gene
expression through activation of ERK and PI-3K/AKT pathways: Involvement of invasive potential. Faseb
J. 2004, 18, 1123–1125, doi:10.1096/fj.03-1429fje.
56. Yoshikawa, S.; Zen, Y.; Fujii, T.; Sato, Y.; Ohta, T.; Aoyagi, Y.; Nakanuma, Y. Characterization of CD133+
parenchymal cells in the liver: Histology and culture. World J. Gastroenterol. 2009, 15, 4896–4906,
doi:10.3748/wjg.15.4896.
57. Yin, S.; Li, J.; Hu, C.; Chen, X.; Yao, M.; Yan, M.; Jiang, G.; Ge, C.; Xie, H.; Wan, D.; et al. CD133 positive
hepatocellular carcinoma cells possess high capacity for tumorigenicity. Int. J. Cancer 2007, 120, 1444–1450,
doi:10.1002/ijc.22476.
58. Ding, W.; Mouzaki, M.; You, H.; Laird, J.C.; Mato, J.; Lu, S.C.; Rountree, C.B. CD133+ liver cancer stem cells
from methionine adenosyl transferase 1A-deficient mice demonstrate resistance to transforming growth
factor (TGF)-beta-induced apoptosis. Hepatology 2009, 49, 1277–1286, doi:10.1002/hep.22743.
59. Fischer, A.M.; Katayama, C.D.; Pages, G.; Pouyssegur, J.; Hedrick, S.M. The role of erk1 and erk2 in multiple
stages of T cell development. Immunity 2005, 23, 431–443, doi:10.1016/j.immuni.2005.08.013.
60. Chang, C.F.; D’Souza, W.N.; Ch’en, I.L.; Pages, G.; Pouyssegur, J.; Hedrick, S.M. Polar opposites: Erk
direction of CD4 T cell subsets. J. Immunol. 2012, 189, 721–731, doi:10.4049/jimmunol.1103015.
61. Guo, K.; McMinn, J.E.; Ludwig, T.; Yu, Y.H.; Yang, G.; Chen, L.; Loh, D.; Li, C.; Chua, S., Jr.; Zhang, Y.
Disruption of peripheral leptin signaling in mice results in hyperleptinemia without associated metabolic
abnormalities. Endocrinology 2007, 148, 3987–3997, doi:10.1210/en.2007-0261.
© 2020 by the authors. Licensee MDPI, Basel, Switzerland. This article is an open access
article distributed under the terms and conditions of the Creative Commons Attribution
(CC BY) license (http://creativecommons.org/licenses/by/4.0/).You can also read