ESG Investing: A review - Søren Hvidkjaer Head of Department, Professor of Finance, CBS - Finsif
←
→
Page content transcription
If your browser does not render page correctly, please read the page content below
ESG Investing:
              A review

             Søren Hvidkjær
Head of Department, Professor of Finance, CBS
Focus of the Report
- and a roadmap
How do ESG strategies affect investor’s risk-
adjusted return?
– Theoretical foundation
– Classification of CSR/ESG studies
– Evidence:
• Sin stocks: Negative sector screening
• ESG ratings: Positive/negative screening
• Event studies
• Active ownership
• A meta study
– Conclusion and implication of the results
Søren Hvidkjær – Nordic SIF 19th September 2017 2Theoretical considerations for the ESG
investor
• For an equity investor who
– does not possess insider information and
– does not engage in active ownership,
• the central performance question is not whether
ESG initiatives creates value in the firm, but
rather whether the stock price accurately reflects
the value of these initiatives.
Søren Hvidkjær - Nordic SIF 19th September 2017 3Abnormal Returns to ESG Strategies – why?
• Potential drivers of positive return to ESG
1. Underreaction to ESG information
• Evidence of underreaction in other cases
• Evidence of underreaction for intangible information
2. ESG strategies have become more common
• Potential drivers of negative return to ESG
1. Demand effect: If a stock is ignored by many
investors, the price falls which implies higher
future expected return
2. Companies e.g. in the tobacco industry have
incentives to practice conservative accounting
Søren Hvidkjær - Nordic SIF 19th September
4
2017Abnormal Returns to ESG Strategies?
• Demand effect depends on
– How widespread are ESG strategies
– Slope of demand curve for stocks
• Depends on arbitrage activity
• ESG strategies can lead to a lack of diversification
– More relevant for sector exclusions than single-
stock exclusions
• ESG strategies can be costly
– Especially relevant for passive investors
Søren Hvidkjær - Nordic SIF 19th September
5
2017Corporate Governance and Active
Ownership
• Potential principal-agent problems
– Underinvestment in ESG initiatives:
• Management has short horizon (myopic) e.g. because
of career considerations.
– Overinvestment in ESG initiatives:
• Management’s social preferences are paid by the
shareholders
• Management uses stakeholder arguments for their own
gain.
• Corporate governance initiatives and active
ownership can help resolve P-A problems
Søren Hvidkjær - Nordic SIF 19th September
6
2017Studies of Financial Effects of CSR/ESG
Classification:
1. Risk-adjusted abnormal returns to ESG portfolios
2. Event studies of market reaction to ESG events
3. Relationship between ESG/CSR and accounting-
based performance measures e.g. ROA
4. Relationship between ESG/CSR and the ex ante
cost of capital to firms
Søren Hvidkjær - Nordic SIF 19th September
7
2017Evidence of Abnormal Returns for sin
stocks: Selected studies
Study Period Market Method Alpha p.a.
Hong and 1926- USA Equal weighted, FF 1-4 3-4%
Kacperczyk (2009, 2006 factor model relative to
JFE, ABS 4* F) similar stocks
Fabozzi, Ma and 1970- 21 Equal weighted, 1-factor 8-12%
Oliphant (2008, 2007 countries
JPM, ABS 2 F)
Trinks and 1991- 94 Value weighted, FF global 8-13%
Scholtens (2017, 2012 countries 4-factor (misspecification)
JBusEth, ABS 3 NF)
Hoepner and 2001- Stocks Value- and equal weighted, 3-4%
Schopohl (2016, 2015 excl. in FF 1 and 4-factor
JBusEth, ABS 3 NF) GPFG/AP
ABS rating explained p. 10 in the report. High to Low rank: 4*, 4, 3, 2, 1
Søren Hvidkjær - Nordic SIF 19th September
8
2017The Portfolio: Equal or Value Weighted?
Adamsson and Hoepner (2015) criticize Hong and
Kacperczyk for equal weighting:
– HK regress an equal- weighted portfolio of sin stocks
on a value-weighted market benchmark. This implies
that the outperformance could be driven by a small
cap performance bias rather than sin stocks
characteristics […]. This argument is founded on the
empirical observation that small stocks outperform
large stocks […]. The exceptionally good performance
could hence be due to an over-weighting of small cap
stocks and underweighting of large cap stocks.
Søren Hvidkjær - Nordic SIF 19th September
9
2017Hoepner-Schopohl
Hoepner and Schopohl’s presentation of results:
– We conduct a time-series analysis of the
performance implications of the exclusion
decisions of two leading Nordic investors,
Norway’s Government Pension Fund-Global
(GPFG) and Sweden’s AP-funds. We find that their
portfolios of excluded companies do not generate
an abnormal return relative to the funds’
benchmark index.
Søren Hvidkjær - Nordic SIF 19th September
10
2017Hoepner-Schopohl table 3
AP7 AP1–4 GPFG
Equal Value Equal Value Equal Value
(1) (2) (3) (4) (5) (6)
Panel A: CAPM model
1-factor 0.450*** 0.286* 0.373 0.346 0.425* 0.364
Alpha (2.63) (1.83) (1.19) (1.13) (1.65) (1.62)
Obs. 166 166 109 109 162 162
Adj. R2 0.83 0.77 0.73 0.39 0.67 0.59
Panel B: four -factor model
4-factor 0.361** 0.204 0.519* 0.345 0.373 0.292
Alpha (2.04) (1.23) (1.71) (1.19) (1.28) (1.17)
Adj. R2 0.85 0.78 0.76 0.47 0.67 0.60
Monthly returns. *, ** and *** indicates significance at 10, 5, and 1% level.
Søren Hvidkjær - Nordic SIF 19th September
11
2017Hoepner-Schopohl Portfolios
70
GPFG
60
AP1–4
AP7
50
No of Stocks
40
30
20
10
0
2001 2002 2003 2004 2005
Søren2006
Hvidkjær2007
- Nordic2008 2009
SIF 19th 2010 2011 2012 2013 2014 2015
September
12
2017ESG rating and Stock Returns
Borgers et al. (2013, JEF, ABS 3 F): Stocks with high ESG rating
outperformed stocks with low rating, but not in 2004-9.
Halbritter and Dorfleitner (2015, RFE, ABS 1 F/NF) confirm this and find
no return differences when extending to 2012, while Larsen (2016, F/I,
ABS 0) finds a difference from 2012-2016 in raw returns.
Søren Hvidkjær - Nordic SIF 19th September
13
2017Did the Market Underreact to ESG?
• Borgers et al show high returns for stocks with
high ESG rating around earnings announcements
in 1992-2004, but not in 2004-09
• Consistent with underreaction in the first period
followed by correct pricing in the second period.
Søren Hvidkjær - Nordic SIF 19th September
14
2017E, S or G?
Environmental Evidence
• Limited environmental evidence:
– Studies based on ratings from Innovest use very
short period
– Studies based on KLD show inconsistent results
Søren Hvidkjær - Nordic SIF 19th September
15
2017E, S or G?
Social: Employee Satisfaction
Study Period Market Data/Method Alpha p.a.
Edmans 1984-2009 U.S. large cap Value weighted 2,1-3,5%
(2011, JFE “100 best returns subtracted
ABS 4* F) companies to from comparable Return
work for in stocks (size and difference up
America” market/book equity); to 4 years after
Then FF 4-factor formation
• Underreaction to intangible information:
– Realized profit higher than analysts long term estimates
– However not abnormal returns around earnings
announcement
• Kempf-Osthoff (2005) and Statman-Glushkov (2009) report
evidence based on KLD scores consistent with Edmans
Søren Hvidkjær - Nordic SIF 19th September
16
2017E, S or G?
Governance Evidence
• What is corporate governance
– shareholder or stakeholder perspective
Study Period Market Data/Method Alpha p.a.
Bebchuk, Cohen 1990-99 USA G- and E-index Significant:
and Wang (2013, equal- and value weighted 6-14%
JFE, ABS 4* F) FF 1-4 factor
2000-08 Insignificant
Auer (2016, 2004-12 Europa Sustainalytics ratings (Did the Market Underreact to G?
• Bebchuk-Cohen-Wang show high returns to
highly ESG rated stocks around earnings
announcements in 1990-99, but not in 2000-08.
– Consistent with underreaction in the first period
and correct pricing in the second.
Søren Hvidkjær - Nordic SIF 19th September
18
2017Event studies
• How does the market react to ESG
initiatives/incidents?
Study Sample Event return
Fisher-Vanden and 117 events in 1993-2008: • EPA CL: -1% event return–
Thorburn (2011, • EPA Climate leaders equivalent to $3bn on average
JEEM, ABS 3 NF) • Ceres • Ceres: 0% event return
Krüger (2015, JFE, 2,116 events in 2001-07 • Neg. events have neg. return
ABS 4* F) from KLD • Pos. events have -/0 return
Flammer (2013, 273 WSJ articles in 1980- • Eco-harmful: Neg. return
AMJ, ABS 4* NF) 2009 classified as eco- • Eco-friendly: Pos. return
harmful or eco-friendly
Søren Hvidkjær - Nordic SIF 19th September
19
2017Event Example in Flammer (2013)
• WSJ 14/2 1991: Exxon Appears to Be Close to
Settling Valdez Suits for Less Than $1 Billion
– "It is our opinion that a $650 million settlement is
a severe undervaluation of the natural resources
damage caused by the oil spill, and that if this deal
goes through, the state and federal governments
have been severely outdealed by Exxon," said Mr.
Miller.
• Eco-friendly or eco-harmful news?
Søren Hvidkjær - Nordic SIF 19th September
20
2017Event: Interaction with G
Study Result
Fisher-Vanden and Companies with low governance (G-index):
Thorburn (2011, • Higher probability of participating in EPA CL
JEEM, ABS 3 NF) • More negative event return
Krüger (2015, JFE, Companies with low gearing and lots of liquidity (free
ABS 4* F) cash flow theory, Jensen 1986)
• More negative return to positive ESG initiatives
Søren Hvidkjær - Nordic SIF 19th September
21
2017Active Ownership
• Potential principal-agent problems create an
opportunity for active ownership to create value
Study Sample Event return
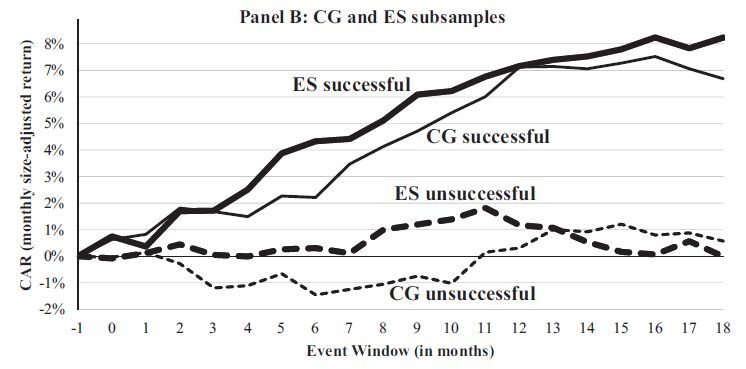
Dimson, Karakas and 382 successful and • Success – over the following year
Li (RFS, 2015, ABS 4* 1,770 unsuccessful • 1-year abnormal ret. of 7%
F) engagements in 1999- • Higher ROA
2009 for a large ESG • More ESG investors
investor • Unsuccessful: No effect
Søren Hvidkjær - Nordic SIF 19th September
22
2017Active Ownership
Both ES and G initiatives are value creating if successful
Dimson, Karakas and Li (2015)
Søren Hvidkjær - Nordic SIF 19th September
23
2017A Meta-/Vote Count Study
• Friede, Busch and Bassen (2015, JSusFinInv, ABS
0) review meta studies of 2200 underlying
studies. They report:
– “large majority of studies reports positive
findings” between ESG and financial performance
– “the results show that the business case for ESG
investing is empirically very well founded.”
• Some reasons to be skeptical …
Søren Hvidkjær - Nordic SIF 19th September
24
2017A Meta-/Vote Count Study
• Evidence of bias in the underlying studies and
especially in the review studies.
– As an example Clark, Feiner and Viehs (2015) finds
a positive connection in 94 out of 110 studies, but
some of the classifications
• are wrong – Fisher-Vanden and Thorburn (2011)
• are due to simple cash flow effects – Krüger (2015),
Capelle-Blancard and Laguna (2010)
• double counts studies – Edmans (2011, 2012), CG
studies
Søren Hvidkjær - Nordic SIF 19th September
25
2017A Meta-/Vote Count Study
• Lots of studies shows correlation between ESG and
accounting performance measures such as ROA
– but the relevant question for an investor is if the
market has already incorporated this into the stock
price
• It is notoriously difficult to conclude causality from
correlation, especially with accounting performance
measures
– the causality question is usually ignored in the CSR
literature
Søren Hvidkjær - Nordic SIF 19th September
26
2017A Meta-/Vote Count Study
• Friede, Busch and Bassen conclude that they
– “clearly find evidence for the business case for ESG
investing. This finding contrasts with the common
perception among investors. The contrary perception
of investors may be biased due to findings of portfolio
studies, which exhibit, on average, a neutral/mixed
ESG–CFP performance relation.”
• However, compared to FBB, investors might in fact
better understand that what matters in the ”business
case” for ESG investing are indeed the results from
the portfolio studies.
Søren Hvidkjær - Nordic SIF 19th September
27
2017Conclusion and Implications 1/4
• Substantial evidence of sin stocks outperforming
– Sector based screening destroys value for
investors/savers
– Conflict of interest especially in pension funds with
mandatory participation
• between the fund manager and the savers
• among savers
– A solution to the conflict of interest requires non-
binary models
– Higher cost of capital is equivalent to a consumption
tax
• except for distribution of revenues
Søren Hvidkjær - Nordic SIF 19th September
28
2017Conclusion and Implications 2/4
• Evidence of high returns to highly ESG rated
stocks: Especially in 1991-2004, not in 2005-2012,
but maybe since 2012
– limited evidence of the E-ratings effect
– portfolios based on social screening (employee
satisfaction) have yielded abnormal returns.
– corporate governance: high return in 1990-99, but
not subsequently
• No evidence that high ratings yield low returns
Søren Hvidkjær - Nordic SIF 19th September
29
2017Conclusion and Implications 3/4
• No evidence of the stock market reacting positive
to ESG/CSR initiatives
– indicates principal-agent problems
– P-A problems can be resolved with good corporate
governance
– interpretation: High ES rating is good if G is high,
but bad if G is low (more research is needed here)
• Value in active ownership
Søren Hvidkjær - Nordic SIF 19th September
30
2017Conclusion and Implications 4/4
• ESG strategies experience strong growth
– historical evidence should be interpreted with
even greater caution
– when profitable strategies become common, the
profit disappears
– This especially applies to simple strategies such as
ESG ratings
– more sophisticated use of ESG information and
active ownership?
Søren Hvidkjær - Nordic SIF 19th September
31
2017You can also read


