Essentials for aerosol delivery to term and pre-term infants
←
→
Page content transcription
If your browser does not render page correctly, please read the page content below
Review Article on Medical Aerosol in Acute and Critical Care
                                                                                                                                 Page 1 of 10

Essentials for aerosol delivery to term and pre-term infants
Andrew R. Clark

Aerogen Pharma Corporation, San Mateo, CA, USA
Correspondence to: Andrew R. Clark. Aerogen Pharma Corporation, Suite 360, 1660 S. Amphlett Blvd, San Mateo, CA 94402, USA.
Email: aclark@aerogenpharma.com.

                Abstract: Effectively delivering pharmaceutical aerosols to the lungs of preterm and term infants
                represents a considerable technical challenge. Small infants are obligatory nose breathers, they have small
                airways, low tidal volumes and rapid respiration rates. It is ethically unacceptable to investigate aerosol
                deposition in vivo in newborns due to ethical concerns about the radiation exposure involved in imaging
                studies and drug delivery and blood draws in pharmacokinetics studies. The purpose of the work reported
                in this article was thus to report the use of modeling to develop an understanding of the regional deposition
                of aerosols in neonates and to build a theoretical basis for choosing an optimum aerosol size to maximize
                delivery and minimize variability. Recent data on aerosol deposition in the nasal airways of newborn term
                and preterm infants was coupled to an established, scalable, lung deposition model to investigate the effects
                of age, aerosol size and ventilation on regional airway deposition. In the term newborn infant lung deposition
                ranged from 25% to 35% depending on Geometric Standard Deviations (GSDs). Intrasubject variability
                was minimized for aerosols with larger GSD. However, mean lung deposition is reduced with increasing
                GSD. A compromise between maximum lung deposition and increased intersubject variability appears to be
                in the region of GSDs of 1.75. In the 30-week GA preterm infant lung deposition is slightly higher than in
                the term infant despite smaller airways and lower tidal volumes. This is likely due to the lower inhaled flow
                rates that are concomitant with lower lung volumes. Finally, when aerosol delivery is directly to the trachea,
                as it would be if delivered via an endotracheal tube there is a monotonic increase in lung deposition with
                increasing aerosol size with peripheral deposition peaking at 2 to 3 μm. However, practical limitations of
                aerosol transport through endotracheal tubes, limiting delivered aerosol size, likely caps lung deposition at
                around 30% to 30% of the delivered dose.

                Keywords: Aerosol; deposition; term infants; preterm infants

                Submitted Nov 03, 2020. Accepted for publication Jan 29, 2021.
                doi: 10.21037/atm-20-7265
                View this article at: http://dx.doi.org/10.21037/atm-20-7265

Introduction                                                               considerable barrier to aerosol penetration into the lower
                                                                           airways and “fine” aerosols are required in order to avoid
Effectively delivering aerosols to the lungs of preterm and
                                                                           inertial impaction (2). Once aerosol has penetrated beyond
term infants represents one of the last great challenges in                the nose deposition in the lung the challenge becomes rapid
pharmaceutical aerosol science. Small infants are obligatory               respiratory rates resulting in short residence times that do
nose breathers, they have small airways, low tidal volumes                 not allow enough time for these “fine” aerosols to sediment
and rapid respiratory rates (1). In general, when respiratory              and deposit (2). Thus, and to some extent similar to adults
support is needed, nasal CPAP is used unless mechanical                    inhaling aerosols, there is an optimum aerosol size which
ventilation is indicated. Aerosol delivery to the lungs via                is small enough to penetrate the lung, but large enough to
the nose during nasal CPAP is technically demanding.                       sediment and deposit in it.
The small dimensions of the nasal passages represent a                         Further, the intersubject variability in nasal airway

© Annals of Translational Medicine. All rights reserved.                 Ann Transl Med 2021;9(7):594 | http://dx.doi.org/10.21037/atm-20-7265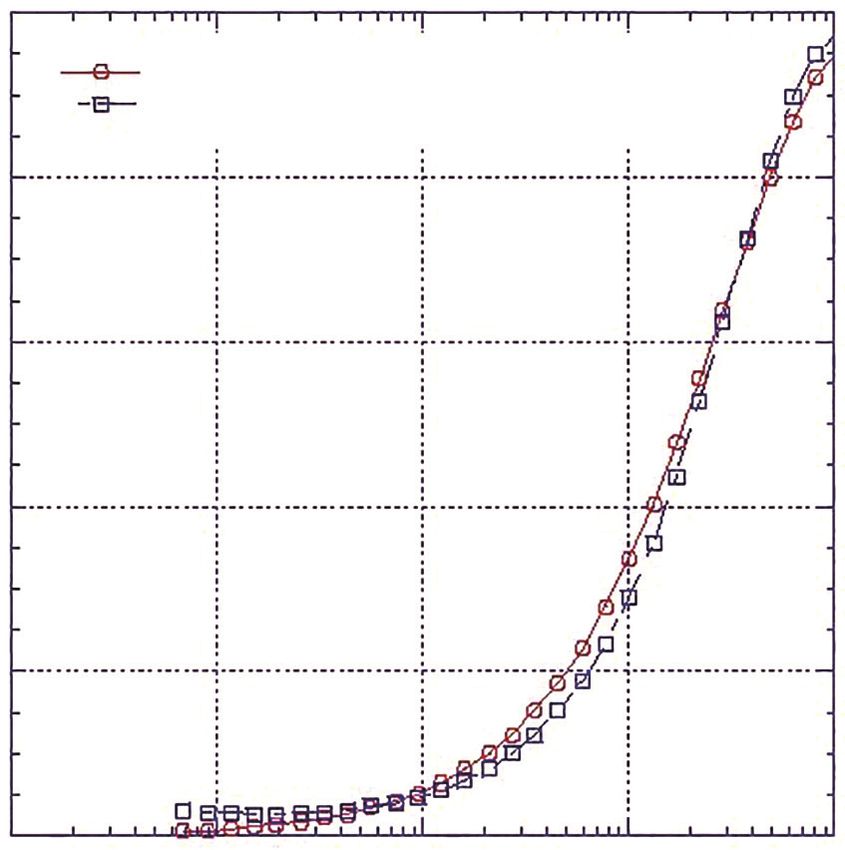
Page 2 of 10                                                                         Clark. Aerosol delivery in term and pre-term infants

 Table 1 Sources and description of models used to generate the         Methods
 nasal deposition data summary presented in Figure 1
                                                                        The deposition model employed the data summarized by
                          Model                            Number of
 Publication                          Model age range                   Clark et al. (7) describing nasal deposition in newborns
                        designation                         models
                                                                        and premature infants coupled to a modified version of the
 Tavernini et al. (5)       −           1 to 79 days          8
                                                                        algebraic deposition model described by Rudolf et al. (8,10).
 Janssens et al. (11)     SAINT          9 months             1         The variability in nasal deposition was characterized by
 Minocchieri et al.       PrINT         28 weeks              1         minimum, mean and maximum deposition efficiency curves
 (12)                                 Gestational Age                   and this was coupled to the mean deposition functions
 Clark et al. (7)                        4 months             1         from the algebraic model. This approach was taken for
                                                                        two reason; Firstly, nasal variability is much higher than
                                        28 weeks              1
                                      Gestational Age
                                                                        airway variability and therefore has a much bigger impact
                                                                        on deposition and secondly because it was felt that the
 ICRP (9)                       Scaled based on adult data
                                                                        amount and nature of the nasal deposition data did not
                                                                        readily facilitate reliable estimates of 95% confidence limits.
                                                                        Thus, the two approaches to assessing variability, minimum
dimensions, and the impact this has on nasal deposition, is             maximum for nasal deposition and 95% confidence limits
well documented in adults, children and newborns (3-5).                 for the algebraic model are not compatible.
Thus, not only is there an optimum size resulting in
maximum lung deposition in an individual, but there is
also an optimum aerosol size that minimizes intersubject                Nasal deposition
variability. These optimum sizes may or may not be the                  The source of the data and age of the infants on which the
same and it may be necessary to sacrifice higher deposition             nasal models are based are described in Table 1. The nasal
in some individuals to ensure reasonable deposition in                  deposition data are presented in Figure 1. Although this
others. This makes it a challenging exercise to choose the              collection of data does not strictly represent only newborn
appropriate aerosol size for this group of tiny patients.               term or preterm infants it should be noted that data from
   In addition, it is impossible to directly investigate                specific models of preterm infants fall well within the data
aerosol deposition in newborns using conventional in vivo               spread and examination across multiple age ranges from
techniques due to ethical concerns about the radiation                  preterm to adults (3-5) shows large intersubject variability
exposure involved in imaging studies and drug delivery and              with only a small trend with age. It was therefore felt that,
blood draws in pharmacokinetics studies (6).                            for the purposes of this initial theoretical investigation using
   The purpose of the work reported in this article was                 this data set without any attempts to extrapolate to preterm
to use modeling to develop an understanding of regional                 infants was acceptable. Indeed, because of the variability it
deposition in neonates and, by way of sensitivity analysis, to          is difficult to identify a valid basis for such an extrapolation.
estimate the effects of age, lung characteristics and inhaled           Tavernini and colleagues (5) devoted considerable analytical
flow rates on the optimum aerosol size. The method chosen               effort to finding a function which explained (minimized)
was to integrate recent data from publications on deposition            intersubject variability in their nasal models. They finally
in neonatal nasal casts (7) with a numerical deposition                 settled on a function involving Stokes and Reynolds
model based and an algebraic formulation developed by                   numbers. However, the variables used to calculate these
Rudolf et al. (8). This algebraic model was based on data               dimensionless groups, while readily obtained from models,
gathered and summarized by the Task Group on Lung                       are not available in live preterm infants. The only variables
Dynamics (9). The model was chosen specifically because                 that can be practically controlled and/or measured during
it was developed to represent normal tidal breathing of a               nasal aerosol delivery to neonates are particle size, d, and
uniform aerosol concentration, as would be experienced                  flow rate, Q. Hence, the representation of data set relating
when inhaling droplets from nebulizers and the later part               nasal deposition to the impaction parameter, d2Q, as the
of the model allows for scaling constants that represent the            dependent variable was used for this modeling exercise,
relative sizes of the major airway compartment across age               Figure 1. It should be noted, although not obvious from
groups.                                                                 the figure, that not only are there differences between

© Annals of Translational Medicine. All rights reserved.               Ann Transl Med 2021;9(7):594 | http://dx.doi.org/10.21037/atm-20-7265
Annals of Translational Medicine, Vol 9, No 7 April 2021                                                                                        Page 3 of 10

                                    1.0                                                  their scaling constants for a newborn infant (9).
                                              Minimu m fit
                                              Mean
                                              Maximum fit                                   η=
                                                                                             1 − (2.1x 10⁻⁴ × d 2Q SFT3 + 1) −1                           [2]
                                              Tavernini et al.
                                    0.8       SAINT (9-month-old)
                                              PrlNT (28 weeks GA)
                                                                                            Where SF T is a scaling factor based on the ratio of
 Deposition (Fraction of inhaled)

                                              4-month-old
                                              28 weeks GA                                trachea diameters for adults to newborns and is used to
                                              ICRP (New Born)
                                    0.6                                                  scale adult nasal deposition data to newborns. Given that
                                                                                         no data existed to validate this use of SFT at the time of the
                                                                                         model’s development, this function was justified based on
                                    0.4                                                  limited work performed by Zhou (13) and Swift (14). Since
                                                                                         this equation and scaling correction obviously overestimates
                                                                                         nasal deposition compared to the nasal models employed
                                    0.2                                                  in more recent publications it was not considered further
                                                                                         during this modeling investigation.

                                    0.0
                                          1       10           100        1000   104     Lung deposition
                                                          d2Q (μm2cm3s−1)
                                                                                         With the substitution of the fitted nasal deposition function
Figure 1 Summary of available nasal deposition data and fitted                           described above (Eq. [1]), the algebraic model of Rudolf et al.
minimum (dashed line right), mean (solid line) and maximum                               (8,10) was used in its published form. The model is
(dashed line left) deposition curves. The bulk of the data (8 nasal                      described in detail elsewhere (8). Briefly, deposition in
models) are from Tavernini et al. (5), the SAINT data is from                            each airway compartment is calculated using two empirical
Storey-Bishoff et al. (11), the PrINT data is calculated from                            equations, one representing inertial deposition and the
Minocchieri et al. (12) and the 4-month and 28 weeks old model                           other diffusional deposition. Total deposition is then
data is from Clark et al. (7). Also shown is the original ICRP model                     calculated as the root mean square of the two components.
for nasal deposition in newborns (9).                                                    In addition to particle size the model requires a set of
                                                                                         physiological variables and age-related scaling factors. In its
                                                                                         original published form these variables are given for adults,
individual nasal models but also for a given model tested                                children and newborn (term) infants. The variables for
under different flow conditions.                                                         newborn infants are presented in Table 2.
   Data relating nasal deposition efficiency to d 2Q from
the infant nasal models were fitted (minimum, mean and
maximum) using a hyperbolic function of the form;                                        Calculations

                                                                                         The algebraic model with the above nasal equations
                      η = 100 × (1 − exp(−a(d 2Q) p ) 		                          [1]    included was implemented using an Excel spreadsheet
                                                                                         (Microsoft, Office 365). Fractionated log-normal particle
   Where a and P are fitting constants.                                                  distributions we generated for various Mass Median
   Equation [1], with the appropriate fitting constants                                  Aerodynamic Diameters (MMADs) and GSDs using a
representing the maximum, mean and minimum deposition                                    geometric size band multiplier. The regional deposition
efficiency curves are shown in Figure 1. The mean curve                                  of the geometrically weighted mean for each size band
was fitted using a least squares fitting routine, the minimum                            was calculated using the algebraic deposition model.
and maximum curves were fitted by eye. The fitted curves                                 Total deposition in each region of the airways, nose, lung
were used as a replacement for the nasal deposition function                             (conducting and peripheral regions), and exhaled fractions
employed in the published algebraic model.                                               were then calculated by summation across the entire size
   For completeness also shown in Figure 1 is the curve                                  distribution. The size distribution of the aerosol depositing
generated using the nasal deposition equation [2] used in                                in each airway region was also calculated. The calculations
the published model that was originally adopted by the                                   flow is illustrated in Figure 2. The detailed equations can be
International Commission on Radiological Protection using                                found in Rudolf et al. (8).

© Annals of Translational Medicine. All rights reserved.                                Ann Transl Med 2021;9(7):594 | http://dx.doi.org/10.21037/atm-20-7265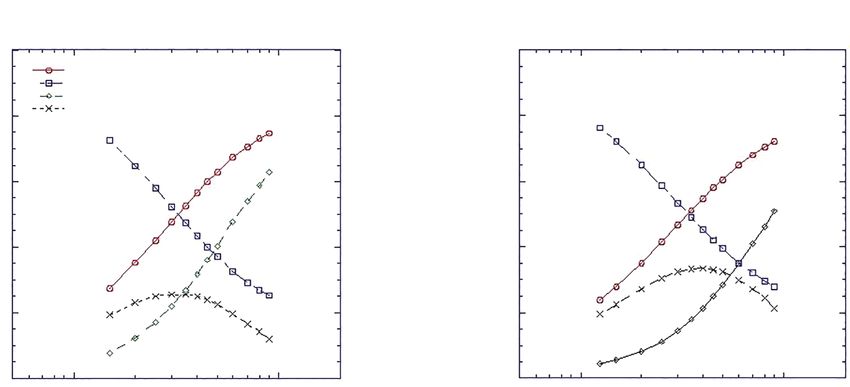
Page 4 of 10                                                                        Clark. Aerosol delivery in term and pre-term infants

 Table 2 ICRP and modeling parameters for newborns and a               varying MMAD and a GSD of 1.75. Three curves are
 30-week gestational age premature infant                              presented for each region representing the minimum,
 Age range                            Newborn#       30 weeks GA$,&    mean and maximum nasal deposition as determined from
 Physiological parameters                                              the nasal cast data. As would be expected at large MMADs
                                                                       nasal capture limits aerosol penetration into the lung and
     Inhaled flow rate (Q)             65 mL/s         20 mL/s/kg
                                                                       at small MMADs lung retention is limited by exhalation.
     Inhaled volume (Vt)                39 mL         5.685 mL/kg
                                                                       For a newborn conforming to the breathing parameters and
     Forced residual capacity (FRC)    110 mL              37 mL       scaling factors described in Table 1 mean lung deposition
     Extra Thoracic volume (VE)          2 mL              0.6 mL      reaches 30% at an MMAD of 3 μm. However, the range of
                                                                       deposition, maximum to minimum nasal retention, varies
     Tracheobronchial volume (VBo)       4 mL              1.25 mL
                                                                       from 10% to 45%, i.e., a factor of over 4. Of note, as would
     Bronchiolar volume (Vbo)            7 mL              2.2 mL
                                                                       be expected, the median size at which peak lung deposition
 Scaling factors  @
                                                                       occurs varies inversely with degree of nasal retention and
     Trachea (SFT)                      2.989               3.61       increases as nasal retention decreases.
                                                                          Figure 4A,B,C present total lung deposition as a function
     Bronchial (SFB)                    1.674               1.84
                                                                       of GSD for aerosols of various MMADs. Increasing
     Alveolar (SFA)                     2.500               2.80       GSD flattens the dependency of deposition upon particle
 #                                $
  , data obtained form (8,9); , physiological parameters derived       size and reduces peak lung deposition, while at the same
             &
 from (15); , inhaled volumes and flow rates obtained from (16);       time decreasing variability. Mean peak lung deposition
 @
   , scaling factors calculated using diameters of airway groups
                                                                       decreases from 37% to 24% and variability (ratio of highest
 determined from autopsies of premature infants (17).
                                                                       to lowest), decreases by 20% (from 3.6 to 2.6) as GSD
                                                                       increases from 1.0 to 2.5. Indicating, as would be expected,
   Base calculations were performed using the published                that deposition of mono disperse aerosols is more sensitive
ICRP parameters for newborns and the minimum, mean                     to variation in intersubject airway parameters.
and maximum nasal deposition functions derived from the                   Figure 5 presents the lung deposition data for a 30-week
data presented in Figure 1. A range of particle sizes, 1.25 to         GA premature infant. Figure 5A shows the effect of inhaled
9.0 μm MMAD, and GSDs, 1, 1.75, 2.5 were investigated.                 flowrate assuming lung volumes are scaled in proportion to
   In addition, deposition in a 30-week Gestational Age                inhaled flowrate. Figure 5B shows the effect of inhaled flow
premature infant was investigated. Scaling for the trachea,            rate assuming fixed airway volumes. In either case increasing
central and peripheral zone, as required by the algebraic              inhaled flow rates results in lower lung deposition, in the
model, were calculated using autopsy data (17) (Table 2).              case of Figure 5A that is despite an increase in lung volumes.
Sensitivity analysis around the based case 30-week GA                  It should also be noted that rather than a reducing lung
infant was performed by varying lung volumes in proportion             deposition, compared to a term newborn, lung deposition
to inhaled flowrate and then by varying inhaled flow rates             is slightly enhanced. This slight increase is well within
with a fixed lung volume.                                              the maximum variability generated by variations in nasal
   Finally, the model was adapted to investigate aerosol               deposition exemplified in Figure 3.
delivery directly into the trachea of newborn infants by                  Figure 6 presents the results of modelling aerosol delivery
assuming no nasal filtering. This is somewhat equivalent               directly into the trachea as would be the case when aerosol
to delivery via an endotracheal tube during mechanical                 delivery is via an endotracheal tube during mechanical
ventilation, but not attempt was made to model flows                   ventilation. (Note: no attempt was made to model any jet
through an ET tube. Calculations were performed for a                  like flow that might be induced at the exit of the ETT).
term and 30-week GA infant.                                            Figure 6A presents data for a newborn and Figure 6B for an
                                                                       appropriately scaled 30-week GA premature infant. Scaling
                                                                       constants and inhalation parameters were as presented in
Results
                                                                       Table 1 and indicated in the figures. In this case there is
Figure 3A,B,C present regional deposition and exhaled                  no filtering in the nose and the only factor limiting lung
aerosol as percentage of the inhaled dose for aerosols of              deposition is exhalation. Hence, lung deposition increases

© Annals of Translational Medicine. All rights reserved.              Ann Transl Med 2021;9(7):594 | http://dx.doi.org/10.21037/atm-20-7265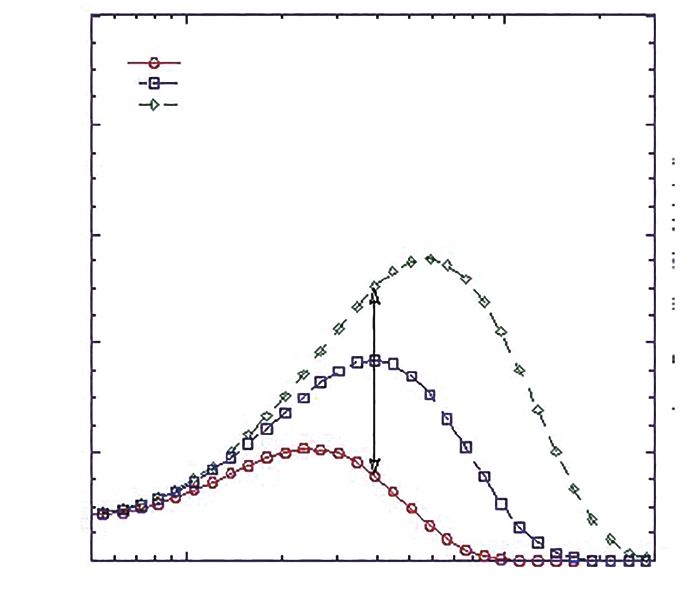
Annals of Translational Medicine, Vol 9, No 7 April 2021 Page 5 of 10
Input
= 100 (1 − exp(−a(d 2Q) p )
Figure 2 Calculation flow for deposition modeling illustrating input parameters and output variables. The model was implemented in an
Excel Spreadsheet (Microsoft, Version 2020).
monotonically with increasing aerosol size. However, Conclusions
peripheral deposition does show a maximum which is
We report the results of a modeling exercise investigating
controlled by the competing mechanisms of upper airway regional aerosol deposition in term and preterm infants.
“filtering” and exhalation. Peripheral deposition shows The method used combined recently published nasal
a functional similarity to total lung deposition for nasal deposition data, obtained from nasal models, with an
inhalation and peak deposition, of 33%, occurs at a similar established lung deposition model that allowed airway
MMAD. Peripheral deposition is slightly enhanced in the scaling for age based on airway dimensions. While the data
younger age infant. gathered from nasal models is limited, both by age and
© Annals of Translational Medicine. All rights reserved. Ann Transl Med 2021;9(7):594 | http://dx.doi.org/10.21037/atm-20-7265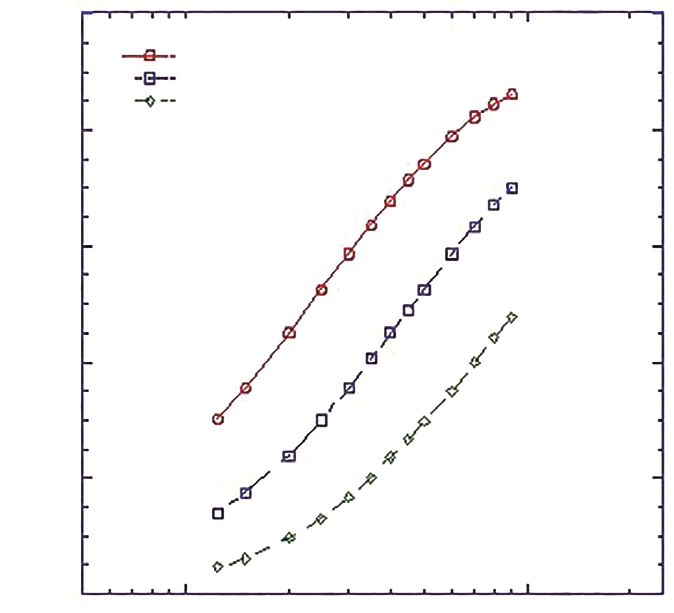
Page 6 of 10 Clark. Aerosol delivery in term and pre-term infants
A Nasal depositon A GSD 1.00
Max mean deposition @ 4 μm =36.8%
100
Max. Nasal deposition Highest/lowest deposition =3.2
Mean Nasal deposition 100
Min. Nasal deposition Max. Nasal deposition
Nasal depositon (% of Inhaled)
80 Mean Nasal deposition
Lung depositicn (% of Inhaled)
Min. Nasal deposition
80
60
60
40
40
20
20
0
1 10 0
1 10
MMAD (μm)
Aerodynamic diameter (μm)
B GSD 1.75
B GSD 1.75
Max mean deposition @ 3 μm =29.3%
Max mean deposition @ 3 μm =29.3%
100 Highest/lowest deposition =2.8
100
Lung depositicn (% of Inhaled)
Lung depositicn (% of Inhaled)
80
80
60
60
40 40
20 20
0 0
1 10 1 10
MMAD (μm) MMAD (μm)
C Exhaled C GSD 2.5
Max mean deposition @ 2.5 μm =23.6%
100 Highest/lowest deposition =2.6
100
80
Lung depositicn (% of Inhaled)
80
Exhaled (% of lnhaled)
60
60
40
40
20
20
0
1 10 0
1 10
MMAD (μm) MMAD (μm)
Figure 3 (A) Nasal deposition, (B) total lung deposition and (C) Figure 4 Total lung deposition as a function of aerodynamic
exhaled percentage in a term infant as a function of Mass Median diameter in a term infant for (A) a monodispersed aerosol (GSD
Aerodynamic Diameter for an aerosol with GSD of 1.75 for nasal 1.0) and Mass Median Aerodynamic Diameter for (B) GSD 1.75
breathing in a newborn infant. Each figure shows the result of the and (C) GSD 2.5. With variance shown as ratio of highest/lowest
minimum, mean and maximum nasal filtering. deposition.
© Annals of Translational Medicine. All rights reserved. Ann Transl Med 2021;9(7):594 | http://dx.doi.org/10.21037/atm-20-7265
Annals of Translational Medicine, Vol 9, No 7 April 2021 Page 7 of 10
100 100
10 mL/s 10 mL/s
20 mL/s 20 mL/s
30 mL/s 80 30 mL/s
80
Lung deposition (% of inhaled)
Lung deposition (% of inhaled)
60 60
40 40
20
20
0
0
1 10
1 10
MMAD (μm)
MMAD (μm)
lnhaled flow rate (Q) 10 mL/s 20 mL/s 30 mL/s lnhaled flow rate (Q) 10 mL/s 20 mL/s 30 mL/s
lnhaled volume (Vt) 9.8 mL 5.85 mL 18 lnhaled volume (Vt) 5.85 mL
Forced residual capacity (FRC) 27.5 mL 37 mL 51 Forced residual capacity (FRC) 37 mL
Extra thoracic volume (Vt) 0.5 mL 0.6 mL 0.9 Extra thoracic volume (Vt) 0.6 mL
Tracheobronchial volume (Vbc) 1 mL 1.25 mL 1.8 Tracheobronchial volume (Vbc) 1.25 mL
Bronchiolar volume (Vbc) 1.75 mL 2.2 mL 3.2 Bronchiolar volume (Vbc) 2.2 mL
Trachea (SFT) 3.61 Trachea (SFT) 3.61
Bronchial (SFB) 1.84 Bronchial (SFB) 1.84
Alveolar (SFA) 2.80 Alveolar (SFA) 2.80
Figure 5 A comparison of total lung deposition for a newborn term infant versus a 30-week gestational age preterm infant for aerosol with a
GSD of 1.75.
number, it shows high variability both across individuals volumes. This is likely due to the lower inhaled flow rates
and within individuals across inhalation parameters. Nasal that are concomitant with lower lung volumes as illustrated
deposition was therefore modelled as maximum, mean and by the relationship between inhaled flow rate for fixed lung
minimum deposition efficiency using a hyperbolic form volumes exemplified in Figure 6B.
utilizing two fitting parameters. Airway dimension, to The data on regional deposition during mechanical
calculate scaling factors, were obtained from autopsy data ventilation shows a monotonic decay in total lung
and inhalation parameters from published sources. Overall, deposition as aerosol size is reduced while exhibiting
even though this combined input data set was limited, it a similar profile in peripheral deposition to total lung
was enough to model and estimate the effects of various deposition in nasal delivery. The reason for this is illustrated
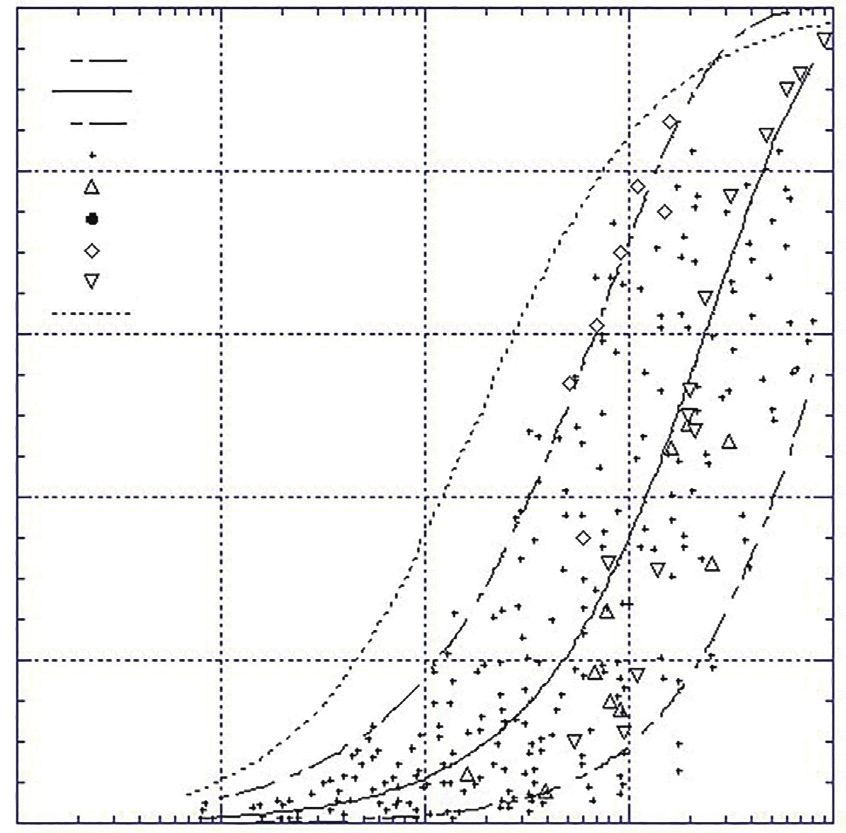
parameters on regional deposition. in Figure 7. There is close similarity between nasal filtering
In the newborn term infant lung deposition ranged from and central airway filtering of the inhaled aerosol which
25% to 35% depending on GSD. Intrasubject variability result in peak peripheral deposition occurring at similar
was minimized with larger GSDs, but lung deposition was sizes to peak lung deposition from nasal breathing. It should
reduced. This illustrates the importance of the width of be noted however, as stated above, that any jetting at the
the aerosol size distribution, too narrow and intrasubject base of an ET tube has been ignored for the purposes of
variability is high to broad on intrasubject variability is modeling. It should also be noted that the ET tube itself
low, but so is total lung deposition. A compromise appears acts as an inertial filter and there are reports that aerosols
to be in the region of GSDs of 1.75. In the 30-week GA with MMADs much large than 2 m are filtered out prior
preterm infant lung deposition was slightly higher than to entering the airways. Liu et al. (18) in an in vitro study
in the term infant despite small airways and lower tidal investigating aerosol delivery via mechanical ventilation
© Annals of Translational Medicine. All rights reserved. Ann Transl Med 2021;9(7):594 | http://dx.doi.org/10.21037/atm-20-7265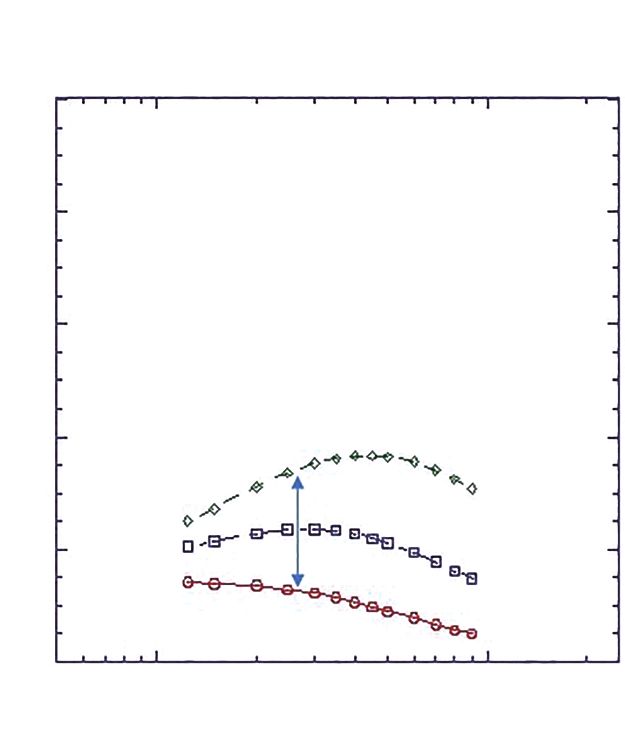
Page 8 of 10                                                                                                                                     Clark. Aerosol delivery in term and pre-term infants

                   A                                  Newborn                                                            B                        30-week GA

                                                      GSD 1.75                                                                                    GSD 1.75
                                                      Max peripheral deposition @ 3.0 μm =24.5%                                                   Max peripheral deposition @ 4.0 μm =33.4%
                                                100                                                                                        100
                                                              Lung deposition               SFt =2.989                                                                                 SFt =3.61
                                                              Exhaled                       SFb =1.674                                                                                 SFb =1.84
                                                              Central deposition            Sfa =2.50                                                                                  Sfa =2.80
    Deposiotn at location (% of inhaled dose)

                                                              Peripheral deposition         Q =65 mL/s                                      80                                         Q =20 mL/s
                                                 80
                                                                                            V =39 mL                                                                                   V =11 mL

                                                                                                                Deposiotn (% of inhaled)
                                                 60                                                                                         60

                                                 40                                                                                         40

                                                 20                                                                                         20

                                                  0                                                                                          0
                                                              1                              10                                                           1                              10
                                                                          MMAD (μm)                                                                                  MMAD (μm)

Figure 6 Regional deposition of aerosol with a GSD of 1.75 in intubated infants. Aerosol is assumed to be delivered directly distal to the
trachea, i.e., bypassing the nasal passages and nasal filtering. (A) Newborn term infant, (B) 30-week gestational age preterm infant.

showed that regardless of the nebulizer used to generate the                                              presents an estimate of the regional deposition as fraction
primary aerosol, or position of the nebulizer, aerosols exiting                                           of the inhaled aerosol. Because of the anatomical dead
the ET tube had MMADs smaller than 2.5 μm. Similarly,                                                     space (extra thoracic volume) in the airways a fraction of
Dugernier and colleagues showed in a study comparing                                                      the aerosol inspired near the end of inspiration will not
aerosol delivery using two ventilation modes (pressure and                                                penetrate beyond the nose and into the lower airway and
volume control) that the aerosols delivered distal to the                                                 will be exhaled. Delivering aerosol early and for a portion
ET tube were 2.1 and 1.9 μm MMAD respectively (19).                                                       of inspiration allow chase air to clear aerosol from the dead
Thus, even though these studies were performed using                                                      space and transport that part of the aerosol deeper into
adult ventilators and ETT sizes, it is unlikely aerosols with                                             the airway enhancing lung deposition beyond the values
MMADs greater than 2 μm are would reach a neonate’s                                                       presented here. In the newborn the extra thoracic volume
lung and the increase in lung deposition seen with larger                                                 is estimated as 4 mL and the tidal volume at 39 mL (8). In
MMADs is not relevant to practical therapy. Coincidently,                                                 preterm infants the volumes are unclear, with estimates of
2 to 2.5 μm MMAD is close to the predicted maximum                                                        nasal volumes of 1.2 mL for the 28-week preterm PrINT
peripheral deposition within the lung as shown in Figure 5.                                               model (12). With tidal volumes as low as 5 to 7 mL/kg
There are less conventional techniques that could take                                                    in preterm infants (21,22) the anatomical dead space can
advantage of increasing lung deposition with increase size.                                               represent 10% to 20% of the tidal volume and for maximum
For example, producing large droplets from a nebulizing                                                   efficiency aerosol delivery should thus be restricted to the
catheter placed though the ET tube and positioned in the                                                  first 80% of each breath. Further inspiratory/expiratory
trachea as proposed by Aramendia and colleagues (20).                                                     ratios can be as high as 1:4 in small infants and obviously
However, while likely enhancing lung deposition this would                                                continuous nebulization would result in a large drop in
result in high central deposition and has several practical                                               overall delivery efficiency as up to 80% of the generated
disadvantages, such as temporarily obstructing the trachea                                                aerosol would be generated during exhalation and would be
and interfering with ventilation.                                                                         wasted.
   Finally, the model used in this investigation assumes                                                     It can be concluded from this modeling that it should
a uniform aerosol concentration during each breath and                                                    be possible to deliver medical aerosols to neonates via

© Annals of Translational Medicine. All rights reserved.                                                 Ann Transl Med 2021;9(7):594 | http://dx.doi.org/10.21037/atm-20-7265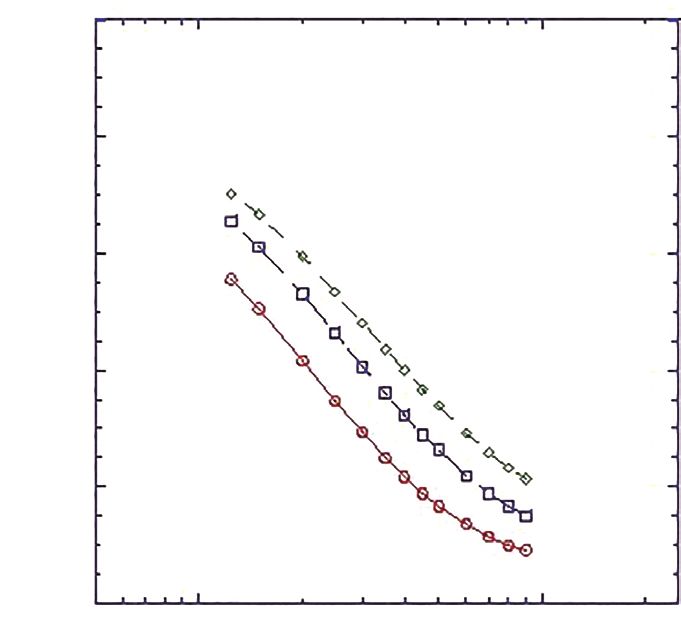
Annals of Translational Medicine, Vol 9, No 7 April 2021                                                                                      Page 9 of 10

                                 1.0                                                   Acute and Critical Care” was commissioned by the editorial
                                           Nasal deposition curve                      office without any funding or sponsorship. The author has
                                           Conducting airway deposition curve
                                                                                       no other conflicts of interest to declare.
                                 0.8

                                                                                       Ethical Statement: The author is accountable for all aspects
 Deposited fraction (fraction)

                                                                                       of the work in ensuring that question related to the accuracy
                                 0.6                                                   or integrity of any part of the work are appropriately
                                                                                       investigated and resolved.

                                 0.4                                                   Open Access Statement: This is an Open Access article
                                                                                       distributed in accordance with the Creative Commons
                                                                                       Attribution-NonCommercial-NoDerivs 4.0 International
                                 0.2                                                   License (CC BY-NC-ND 4.0), which permits the non-
                                                                                       commercial replication and distribution of the article with
                                                                                       the strict proviso that no changes or edits are made and the
                                 0.0                                                   original work is properly cited (including links to both the
                                       1      10           100          1000    104    formal publication through the relevant DOI and the license).
                                                        2     2   3 −1
                                                      d Q (μm cm s )                   See: https://creativecommons.org/licenses/by-nc-nd/4.0/.
Figure 7 A comparison of Nasal filtering (mean curve form
Figure 1) with conducting airway filtering efficiency versus d2Q
                                                                                       References
illustrating the similarity of the two and explaining the peak in
conducting airway deposition seen in Figure 6.                                         1.   MacLoughlin R, Telfer C, Clark A, et al. Aerosol: A Novel
                                                                                            Vehicle for Pharmacotherapy in Neonates. Curr Pharm
                                                                                            Des 2017;23:5928-34.
nasal CPAP or ventilator with reasonable efficiency and                                2.   Finlay WH, Martin AR. Recent advances in predictive
reproducibility provided that; the MMAD is around 2.5 to                                    understanding of respiratory tract deposition. J Aerosol
3 μm, the GSDs of the inspired aerosols are moderate,                                       Med Pulm Drug Deliv 2008;21:189-206.
1.5 to 2.0, delivery is breath synchronized and aerosol                                3.   Hounam RF, Black A, Walsh M. Deposition of aerosol
generation/delivery only takes place in the first 80% of the                                particles in the nasopharyngeal region of the human
breath.                                                                                     respiratory tract. Nature 1969;221:1254-5.
                                                                                       4.   Storey-Bishoff J, Noga M, Finlay WH. Deposition of
                                                                                            micrometer-sized particles in infant nasal airway replicas. J
Acknowledgments
                                                                                            Aerosol Sci 2008;39:1055-65.
The author would like to thank Jim Fink for his support                                5.   Tavernini S, Church TK, Lewis DA, et al. Deposition
and reviewing the manuscript.                                                               of micrometer-sized particles in neonatal nasal airway
Funding: None.                                                                              replicas. Aerosol Science and Tech 2018;52:407-19.
                                                                                       6.   Callahan MJ, MacDougall RD, Bixby SD, et al. Ionizing
                                                                                            radiation from computed tomography versus anesthesia
Footnote
                                                                                            for magnetic resonance imaging in infants and children:
Provenance and Peer Review: This article was commissioned                                   patient safety considerations. Pediatr Radiol 2018;48:21-30.
by the Guest Editors (Dr. James B. Fink and Dr. Zhe Luo)                               7.   Clark A, McKenna C, MacLoughlin R. Aerosol
for the series “Medical Aerosol in Acute and Critical Care”                                 Delivery in Term and Preterm Infants: The final
published in Annals of Translational Medicine. The article has                              Frontier. Available online: https://www.researchgate.net/
undergone external peer review.                                                             publication/324921241_Aerosol_Delivery_in_Term_and_
                                                                                            Preterm_Infants_The_Final_Frontier
Conflicts of Interest: The author has completed the ICMJE                              8.   Rudolf G, Kobirch R, Stahlhofen W. Modeling and
uniform disclosure form (available at http://dx.doi.                                        algebraic formulation of regional deposition in man. J
org/10.21037/atm-20-7265). The series “Medical Aerosol in                                   Aerosol Sci 1990;22:S403-6.

© Annals of Translational Medicine. All rights reserved.                              Ann Transl Med 2021;9(7):594 | http://dx.doi.org/10.21037/atm-20-7265
Page 10 of 10                                                                       Clark. Aerosol delivery in term and pre-term infants

9.    James AC, Stahlhofen W, Rudolf G, et al. The respiratory               breathing pattern and ventilation in newborn infants and
      tract deposition model proposed by the ICRP Task                       adult subjects. Act Paediatr 2000;89:1420-5.
      Group. 3rd Int workshop on respiratory tract dosimetry,          17.   Hislop AA, Haworth SG. Airway size and structure in
      Albuquerque, NM, 1990.                                                 normal fetal and infant lung and the effect of premature
10.   Rudolf G, Gebhart J, Heyder J, et al. An empirical formula             delivery and artificial ventilation. Acta Paediatr
      describing aerosol deposition in man for any particle size. J          2000;89:1420-5.
      Aerosol Sci 1986;17:350-5.                                       18.   Liu CY, Ko HK, Fink JB, et al. Size distribution of colistin
11.   Janssens HM, Jongste JC, Fokkens WJ, et al. The Sophia                 delivery by different type nebulizers and concentration
      anatomical infant nose-throat (SAINT) model: A valuable                during mechanical ventilation. Pharmaceutics 2019;11:459.
      tool to study aerosol deposition in infants. J Aerosol Med       19.   Dugernier J, Reychler G, Wittebole Z, et al. Aerosol
      2001;14:433-41.                                                        delivery with two ventilation modes during mechanical
12.   Minocchieri S, Burren JM, Bachmann MA, et al.                          ventilation: a randomized study. Ann Intensive Care
      Development of the premature infant nose-throat model                  2016;6:73.
      (PrINT-Model) – an upper airway replica of a premature           20.   Aramendia I, Fernandez-Gamiz U, Lopez-Arraiza A, et
      neonate for the study of aerosol delivery. Pediatr Res                 al. Aerosol delivery by inhalation catherer and trachea
      2008;64:141-6.                                                         digitalization. XXXV Congresso annual de la Sociedad
13.   Zhou Y, Guo M, Xi J, et al. Nasal deposition in infants and            Espanola de Ingenieria Biomedica, Bilbao, Nov 2017.
      children. J Aerosol Med Pulm Drug Deliv 2014;27:110-6.           21.   Mian Q, Cheung PY, O’Reilly M, et al. Spontaneously
14.   Swift D. Age-related scaling for aerosol and vapor                     breathing preterm infants change tidal volume to
      deposition in the upper airways of humans. Health Phys                 improve lung aeration immediately after birth. J Pediatr
      1989;57:293-7.                                                         2015;167:274-8.
15.   Latzin P, Roth S, Thamrin C, et al. Lung volume,                 22.   Mian Q, Pichler G, Binder C, et al. Tidal volumes in
      breathing pattern and ventilation inhomogeneity in                     spontaneously breathing preterm infants supported
      preterm and term infants. PLoS One 2009;4:e4635.                       with continuous positive airway pressure. J Pediatr
16.   Al-Hathlol K, Idiong N, Kwiatkoshi K. A study of                       2014;165:702-6.

 Cite this article as: Clark AR. Essentials for aerosol delivery to
 term and pre-term infants. Ann Transl Med 2021;9(7):594. doi:
 10.21037/atm-20-7265

© Annals of Translational Medicine. All rights reserved.              Ann Transl Med 2021;9(7):594 | http://dx.doi.org/10.21037/atm-20-7265
You can also read