Establishment of a Palliative Care Consultation Service (PCCS) in an Acute Hospital Setting - MDPI
←
→
Page content transcription
If your browser does not render page correctly, please read the page content below
International Journal of
           Environmental Research
           and Public Health

Article
Establishment of a Palliative Care Consultation
Service (PCCS) in an Acute Hospital Setting
Peter Tom Engel 1 , Tharshika Thavayogarajah 2 , Dennis Görlich 3                and Philipp Lenz 1, *
 1    Department of Palliative Care, University of Muenster, 48149 Muenster, Germany; peter.tom.engel@gmx.de
 2    Department of Hematology, Oncology, Hemostaseology, and Stem Cell Transplantation, Faculty of Medicine,
      RWTH Aachen University, 52074 Aachen, Germany; tharshika.thavayogarajah@rwth-aachen.de
 3    Institute of Biostatistics and Clinical Research, University of Muenster, 48149 Muenster, Germany;
      Dennis.Goerlich@ukmuenster.de
 *    Correspondence: lenz.philipp@ukmuenster.de

 Received: 28 May 2020; Accepted: 6 July 2020; Published: 10 July 2020

 Abstract: Background and study aims: Acute health service requires focused palliative care (PC).
 This study was performed to provide guidance for the establishment of a palliative care consultation
 service (PCCS). Patients and methods: This study was conceived as a retrospective single-center
 study for observing, analyzing and evaluating the initial setup of a PCCS from 1 May 2015 to
 31 May 2018. Patients from Muenster University Hospital with advanced life-limiting diseases,
 identified to require PC, were included. Results: PCCS was requested from various departments,
 for between 20 and 80 patients per month, corresponding to a total of 2359 for the study period.
 Requests were highest in internal medicine (27.3%), gynecology (18.1%) and radiotherapy (17.6%).
 Time to referral was significantly shorter in departments with special PCCS ward rounds (6 ± 9
 vs. 12 ± 22 days, p < 0.001). The most frequently reported symptoms were fatigue, pain and loss
 of appetite. Pain was frequently localized in the stomach (20.4%), back (17.1%), or in the head and
 neck area (14.9%). After the first PCCS consultation, 254 patients (90%) reported sufficient pain relief
 after 48 h. An introduction/modification of painkiller medication, which was recommended for 142
 inpatients, was implemented in 57.0% of cases by the respective departments. Overall, the direct
 realization of PCCS recommendations reached only 50% on average. Conclusions: Besides an analysis
 of the ability to address the symptoms of the referred patients by the PCCS, this study highlights the
 importance of the interaction between PCCS and other departments. It further elucidates the role and
 possibilities of this service both in regular ward rounds and individual staff contacts.

 Keywords: early integration; palliative care; palliative care consultation service

1. Introduction
     Palliative care (PC) supports patients with life-limiting disease and their relatives by improving
quality of life. “Pain and other problems, physical, psychosocial, and spiritual”, are parts of the
assessment and treatment [1]. The most frequent symptoms of PC patients are pain, lack of energy,
fatigue, weakness and appetite loss [2].
     Strikingly, Becker et al. reported that 9.1% of all patients older than 65 years would require PC [3].
This indicates a considerable demand for PC. Although PC in Germany has improved continuously in
recent years, an increase in the availability of PC services for patients is still required: there are only 15
opportunities for PC service, plus 17 hospice beds, per million inhabitants. About 17–18% of incurable
tumor patients need PC, but the current capacities allow only 3–4% to receive adequate care. Moreover,
there is wide variation in the distribution of PC and hospice beds in Germany [4].

Int. J. Environ. Res. Public Health 2020, 17, 4977; doi:10.3390/ijerph17144977        www.mdpi.com/journal/ijerph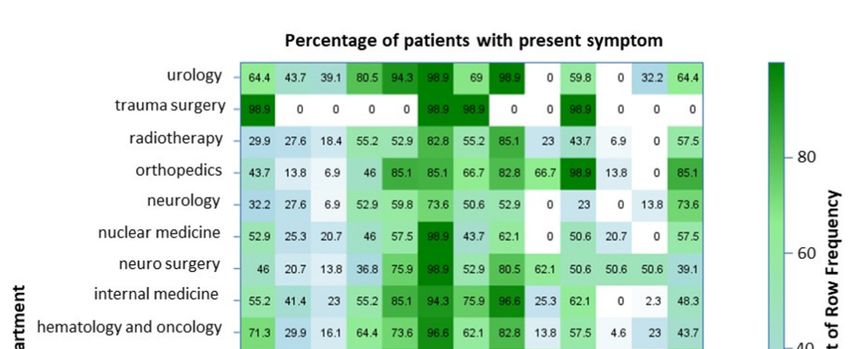
Int. J. Environ. Res. Public Health 2020, 17, 4977                                                     2 of 13

       Several different estimates have been made regarding the demand for PC beds in Europe [5].
Considering cancer patients only, around 50 beds per one million inhabitants are needed [5]. Notably,
non-cancer patients, and the increasing prevalence of chronic diseases due to demographic changes,
are not considered in these data. Considering these two groups of patients, the European Association
for Palliative Care (EAPC) currently estimates an actual necessity of 80–100 PC and hospice beds per
one million inhabitants [5].
       A palliative care consultation service (PCCS) supports physicians and nurses in both in- and
outpatient departments by providing medical recommendations for the respective patients. It must be
noted, though, that it is incumbent upon the physicians and nurses in charge to make the final decision
about a patient’s treatment [6].
       The advantage of a PCCS is the ability to consult a large number of patients within a short period
in the hospital. Particularly, an outpatient setting allows for easy and early access to patients [7].
       Use of a PCCS also improves pain and symptom control, while reducing anxiety and hospital
admissions [8]. Further, communication with the PCCS team enhances patient satisfaction regarding
hospital care [9]. Moreover, contact with the PCCS improves the quality of dying (QOD) as reported
by relatives [10]. In this context, QOD must be a multidimensional concept, e.g., including physical,
psychological, social, and spiritual or existential experiences [11].
       Thus, a PCCS is needed for every hospital in addition to a PC ward, and every hospital should
have access to a PCCS if required [6]. Furthermore, a hospital with 250 beds should have at least one
PCCS team [5].
       Cancer patients facing progressed stages of their disease should be consulted by a member of the
PCCS [12]. PCCS is most efficient when having early contact with patients who are diagnosed with
life-limiting diseases, and for those patients who request PC due to their medical circumstances [12,13].
Early contact with the PCCS may facilitate an outcome associated with a high quality of life, such as
less aggressive medical treatments and fewer inpatient admissions in the last months of life, compared
to standard care [14].
       Palliative care also has a wider dimension: PC treatment involves patients, nurses, doctors and
relatives who all have different perceptions concerning their “own truth” of the situation [15]. In this
context, it is necessary to recognize the most important needs of patients and family members in the
context of end-of-life care, as found in a study: “trust in the treating physician, avoidance of unwanted life
support, effective communication, continuity of care and life completion” [16].
       This study aimed to provide guidance regarding how to structure, establish, and set up a PCCS in
an acute hospital setting. We investigated the type and severity of symptoms presented to the PCCS,
and analyzed the overall characteristics of patients referred to our PCCS, as well as the realization
of our recommendations by the referring department. Furthermore, we hypothesized the existence
of distinct patterns of symptoms in different patient cohorts, so that differences in the presence of
symptoms of referred patients from different departments could be comparatively analyzed. In addition,
we hypothesized that departments with regular PCCS ward rounds would refer patients faster to the
PCCS as compared to departments without established PCCS ward rounds.
       More specifically, each medical department could involve our PCCS if there was a need for PC
treatment. Requests were answered within 24 h. Our PCCS team focused its attention on the anamnesis
of the existence and severity of symptoms and conditions of the referred patients, and subsequently
made recommendations aiming at the control or relief of these symptoms; however, the final decision
regarding further medical treatment was made by the referring department and, thus, the PCCS took
on an advisory role.
Int. J. Environ. Res. Public Health 2020, 17, 4977                                                       3 of 13

2. Patients and Methods

2.1. Study Design
     This study was designed as a retrospective, single-center study at the Muenster University
Hospital, where a PCCS was established in May 2015. For the following study, we analyzed the first
years of building up a PCCS from 1 May 2015 to 31 May 2018. In the subgroup analysis, we include
data from the first 13 months after establishing the PCCS.

2.2. Patients
     Patients with advanced life-limiting and progressive disease were referred to the PCCS by ward
physicians when, together with their team, a need for PC was identified. A specialized palliative care
(SPC) physician or nurse performed the initial PC assessment, including a detailed symptom burden
assessment (symptom distress scale; McCorkle and Young) [17].
     Focusing on the individual needs, the patients were processed according to the algorithm shown
in Figure 1 [18].
     All data were electronically available using the hospital information system Orbis-OpenMed®
(Agfa Healthcare, Mortsel, Belgium).
     The Eastern Cooperative Oncology Group (ECOG) score was used to assess patient performance
regarding activities of daily living [19]. ECOG consists of six grades from 0 to 5 describes an
unrestricted activity; 1 activity restriction, but the ability to work; 2 the inability to work, but the ability
for self-supply; 3 a restricted self-supply with 50% of the time confined to bed or chair; 4 complete
dependence on care; 5 means death [19].
     Symptom burden was assessed in 6 categories: stable (asymptomatic), slightly reduced, reduced,
greatly reduced, unbearable, and no data. These were summarized and color-coded in a heatmap in
the following manner: green (stable), yellow (slightly reduced and reduced), red (greatly reduced and
unbearable) and white (no data).

2.3. Team Structure
    The theme introduced in PC by Dame Cicely Saunders, “Low technology, high personality”,
describes the importance of the team members in PC. Our core team consists of two physicians,
two nurses, two physiotherapists, a half-time weekly psycho-oncologist, a half-time weekly social
worker, and a music therapist. Dieticians, pain therapists and chaplains support the core team.

2.4. Statistics
      Continuous variables are summarized by the mean and standard deviation. Categorical variables
are presented as absolute and relative frequencies.
      Time to referral was defined as the time from hospital admission to first contact with the PCCS.
To test if the time to referral differed between departments with vs. without a PCCS ward round,
the Mann–Whitney U test was used. A two-sided p-value of < 0.05 was considered to indicate
statistical significance.
      Symptom burden presented at first PCCS consultation was visualized on a scale of stable (1;
green), slightly reduced (2; yellow), reduced (3; yellow), greatly reduced (4; red) and unbearable (5;
red), and presented as a symptom heatmap sorted by patient and symptoms.
      A comparison of the realization of recommendations between males and females for the respective
symptom was analyzed using the χ2 test.
      The statistical analysis of the data was performed using the SPSS software (IBM Corp. Released
2012. IBM SPSS Statistics for Windows, Version 21.0. IBM Corp., Armonk, NY, USA) and SAS software
(Version 9.4, SAS Institute Inc., Cary, NC, USA). The symptom heatmap was generated using the ggplot2
package [20] within the statistical software R (Version 3.2.0 for Windows, http://www.R-project.org/).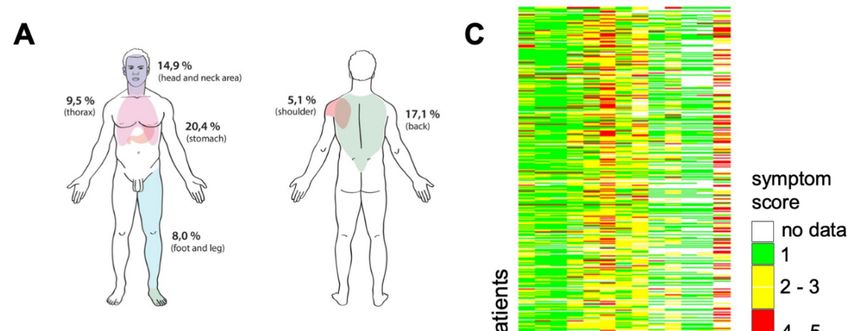
Int. J. Environ. Res. Public Health 2020, 17, 4977                                                 4 of 13

3. Results

3.1. Procedural Characteristics
    We analyzed a total of 2359 patients in the period from May 1, 2015 to May 31, 2018. Of all patients,
1946 (82.5%) were inpatients and 413 (17.5%) outpatients. All were seen by the PCCS, and within
12 months, the number of patients increased from 20 to 60–80 per month at the end of the study period.
The number of patients per year is shown in Figure 1B.

3.2. Time to Referral—Inpatients
     We defined the time from hospital admission to first contact with the PCCS as the time to referral.
The median time to referral in the observation period was 10 ± 19 days, with a minimum of 0 and a
maximum of 332 days. In departments with special PCCS ward rounds, the median time to referral
was significantly shorter compared to the departments without ward rounds (6 ± 9 vs. 12 ± 22 days,
p < 0.001).

3.3. Referring Departments—Inpatients
      All departments with inpatient care (n = 18) requested PCCS support for their treatment. The PCCS
established initial regular weekly ward rounds at the department of radiotherapy and gynecology;
later, rounds were also included for the department of hematology/oncology.
      As a result, the following three departments had the highest requests for PCCS for their patients:
internal medicine (27.3%), gynecology (18.1%) and radiotherapy (17.6%). The data for the other
departments are presented in Figure 1C.

3.4. Subgroup Analysis
     The following subgroup analysis displays the data for 578 patients, covering the period from 1
May 2015 to 31 May 2016; however, the parameter “pain relief within 48 h after PCCS consultation”
was introduced later, and includes the following period: 1 July 2016 to 31 May 2018 (n = 1635).

3.5. Patient Characteristics
     From a total of 578 patients, 490 were inpatients and 88 outpatients. The demographic data of our
inpatients, including their advanced healthcare directive (AHCD) and healthcare proxy, can be found
in Table 1.
     Further, 88% of our patients had cancer and 12% had other diseases (429 patients with cancer vs.
61 with other diseases). The fields with the most common diagnoses in our subgroup analysis were
gastrointestinal (12.9%), gynecological (8.4%), head and neck (8.3%) and genitourinary cancer (7.4%).
     Of the solid cancer patients (excluding brain tumors, n = 350), metastatic disease was observed in
80.3%, and peritoneal carcinosis in 11.7%. Interestingly, the majority of the evaluated patients were
found to be ECOG 3, which means a restricted self-supply with 50% of the time confined to bed or
chair (Figure 2B).

3.6. Symptom Burden
     We generated a heatmap to create a first impression of our patient’s symptom burden (Figure 2C).
The most commonly presented symptoms were fatigue (82.7%), depression (68.6%) and loss of appetite
(64.7%). Moreover, some patients reported constipation (62.7%), pain (56.7%; for detail, see below) and
insomnia (54.9%).
     Less frequently, symptoms like dyspnea (43.2%), nausea (30.4%), edemata (28.7%), vomiting
(20.8%) and wounds (19.2%) were presented. Most of our patients could not be assessed regarding
neurologic symptoms (56.9%) or bleeding risk (56.2%).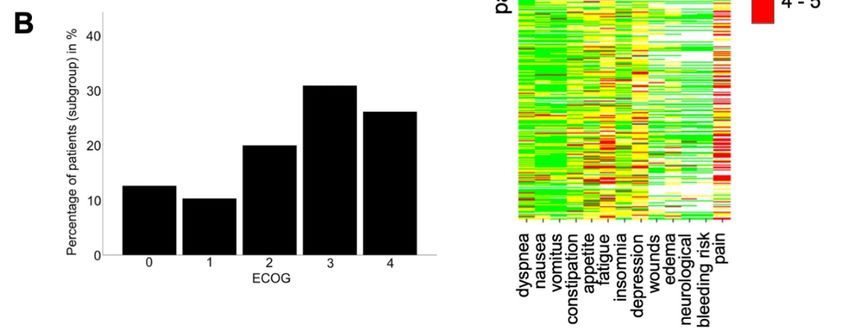
Int. J. Environ. Res. Public Health 2020, 17, 4977 5 of 13
Table 1. Inpatient characteristics, main diagnoses, and Eastern Cooperative Oncology Group (ECOG)
performance status of our subgroup analysis (for the first 13 months) (n = 490).
Median Age in Years (Range) 62 (17–95)
Sex
Male 272 (55%)
Female 218 (45%)
Social Status
Married (and living with wife/husband) 273 (55.7%)
Living alone 95 (19.4%)
Living with family 57 (11.6%)
Living with life partner 34 (6.9%)
Other 15 (3.1%)
No declaration 15 (3.1%)
Advanced Healthcare Directive
(AHCD)
Yes 215 (43.9%)
No 212 (43.3%)
No declaration 62 (12.7%)
Healthcare Proxy
Yes 226 (46.1%)
No 200 (40.8%)
No declaration 63 (12.9%)
Main Diagnoses
Cancer 429 (88%)
No cancer 61 (12%)
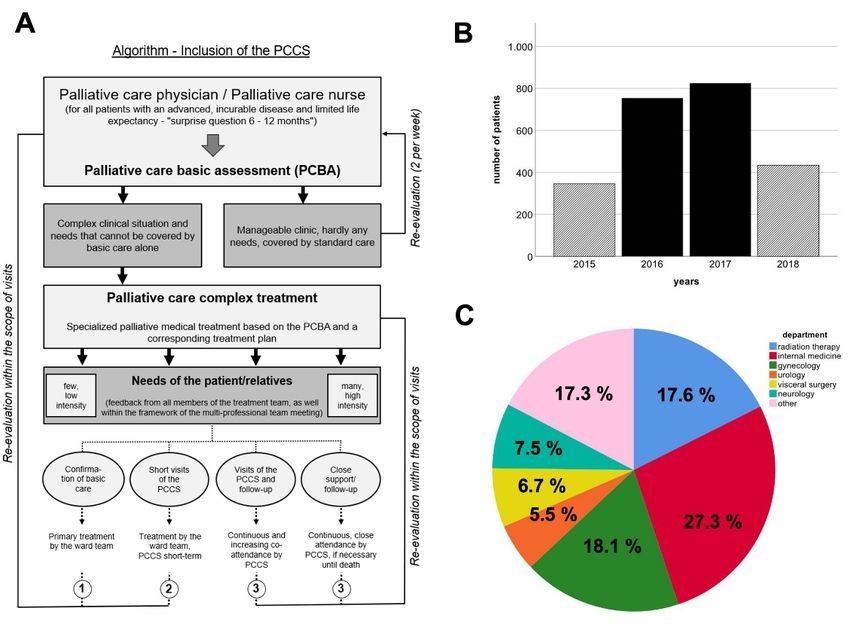
3.7. Symptom Burden in Different Departments
Figure 3 shows that some symptoms are more frequent in specific departments. For example,
in hematology and oncology, fatigue (96.6%), depression (82.8%) and loss of appetite (73.6%) were the
three most frequent symptoms, similar to the symptom burden of all our patients; however, dyspnea
(71.3%), constipation (64.4%), insomnia (62.1%) and edemata (57.5%) were more frequent in hematology
and oncology patients than in the group of all analyzed patients.
Int. J. Environ. Res. Public Health 2020, 17, x 6 of 15
Figure 1.of
Figure 1. Algorithm Algorithm
palliativeof palliative care consultation service
care consultation service(PCCS) inclusion
(PCCS) and analysis
inclusion of patient
and analysis of patient
number development as well as departmental allocation. Algorithm detailing how to match PCCS
number development as well
and a patient‘s as departmental
situative need for palliative allocation.
care (A). PatientAlgorithm detailing
number dynamics over the how to match PCCS and
entire period
a patient‘s situative need
of study forchart
(B). Pie palliative
comparingcare (A). Patient
the amounts number
of patients referreddynamics
to the PCCS over the entire period of
by respective
departments (C). “Other” includes nuclear medicine, cardiac surgery, neurosurgery, ophthalmology,
study (B). Pie chart comparing the amounts of patients referred to the PCCS by respective departments
vascular surgery, orthopedics, psychiatry, trauma surgery, dermatology, head and neck surgery,
(C). “Other” includes nuclear
anesthesiology andmedicine,
ear, nose and cardiac surgery, neurosurgery, ophthalmology, vascular surgery,
throat medicine.
orthopedics, psychiatry, trauma surgery, dermatology, head and neck surgery, anesthesiology and ear,
3.8. Pain
nose and throat medicine.
Moreover, we used the visual analog scale (VAS), from 0 (no pain) to 10 (strongest imaginable
pain), to assess patient pain levels. As a result, 278 (56.7%) of our patients suffered pain, with 28.0%
of them in low (1–3), 42.0% in middle (4–7), and 23.9% in high (8–10) pain (no data in 6.1%; mean 5.1
± 2.7; median 5.0).
Of our patients who suffered pain (n = 278), the pain was mostly located in the stomach (20.4%),
back (17.1%), or in the head and neck area (14.9%) (Figure 2A).Int. J. Environ. Res. Public Health 2020, 17, 4977 6 of 13
3.8. Pain
Moreover, we used the visual analog scale (VAS), from 0 (no pain) to 10 (strongest imaginable
pain), to assess patient pain levels. As a result, 278 (56.7%) of our patients suffered pain, with 28.0% of
them in low (1–3), 42.0% in middle (4–7), and 23.9% in high (8–10) pain (no data in 6.1%; mean 5.1 ± 2.7;
median 5.0).
Of our patients who suffered pain (n = 278), the pain was mostly located in the stomach (20.4%),
back (17.1%), or in the head and neck area (14.9%) (Figure 2A).
Int. J. Environ. Res. Public Health 2020, 17, x 7 of 15
Figure 2.
Figure 2. Evaluation
Evaluation of of pain
pain location,
location,thetheburden
burdenof ofpresented
presentedsymptoms,
symptoms,and andthe
theECOG
ECOGperformance
performance
status of referred patients at the first consultation with PCCS. Schematic overview ofof
status of referred patients at the first consultation with PCCS. Schematic overview frequencies
frequencies forfor
the
the different
different pain pain locations
locations of referred
of referred patientspatients (A). ECOG
(A). ECOG statusof(0–4)
status (0–4) of referred
referred patients patients (B).
(B). Heatmap
Heatmapthe
showing showing
burdentheof burden
symptoms of symptoms
presentedpresented
at the firstatPCCS
the first PCCS consultation
consultation on a scaleonofa stable
scale of
(1),
stable (1), slightly reduced (2), reduced (3), greatly reduced (4) and
slightly reduced (2), reduced (3), greatly reduced (4) and unbearable (5) (C). unbearable (5) (C).
3.8.1. Premedication
3.8.1. Premedication and Changes Due
Due to
to PC
PC Consultation
Consultation
Pain
Pain
In
In our
our analysis,
analysis, 414 (84.5%) of our
(84.5%) of our patients
patients took
tookone
oneorormore
morepainkillers,
painkillers,and
andofofthese
thesepatients,
patients,
102
102(24.6%)
(24.6%)were
were in
in step I (non-opioid) of the
the WHO
WHOpain painladder,
ladder,2626(6.3%)
(6.3%)were
wereininstep
stepIIII(weak
(weakopioid
opioid
±± non-opioid), and 286 (69.1%)
(69.1%) were
were in
in step
step III
III(strong opioid±±non-opioid).
(strongopioid non-opioid).
For
For 142
142 inpatients
inpatients (28.9% of all inpatients),
inpatients), thethe PCCS
PCCS recommended
recommendedaadrug drugconversion
conversionfor for
painkillers,and
painkillers, andfor
for328
328 patients
patients (66.9%),
(66.9%), no change
no change was was recommended.
recommended. Further,
Further, for 81 for 81 patients
patients (57.0%),
(57.0%),
the PCCS the PCCS recommendations
recommendations were directly
were performed performed directly
(within (within
48 h of 48 h of recommendation).
recommendation). When analyzed
When analyzed
according to sex,according to sex,experienced
females (59.1%) females (59.1%) experienced
slightly slightlythough
more frequent, more frequent, thoughreceipt
non-significant, non-
significant,
of recommended receipt of recommended
pain care comparedpain care compared
to males (55.3%). to males (55.3%).
There were four possibilities for optimizing the pain medication: (1) the pain medication could
be increased by taking a step in the WHO pain ladder (20 patients, 25% of the patients with performed
recommendations); (2) the opioid could be changed (15 patients, 18.8%); (3) a WHO pain ladder step
could be completed, such as through adding a non-steroidal anti-inflammatory drug (NSAID) to the
regimen (14 patients, 17.5%); or (4) the dose could be escalated (13 patients, 16.3%).Int. J. Environ. Res. Public Health 2020, 17, 4977 7 of 13
There were four possibilities for optimizing the pain medication: (1) the pain medication could be
increased by taking a step in the WHO pain ladder (20 patients, 25% of the patients with performed
recommendations); (2) the opioid could be changed (15 patients, 18.8%); (3) a WHO pain ladder step
could be completed, such as through adding a non-steroidal anti-inflammatory drug (NSAID) to the
regimen (14 patients, 17.5%); or (4) the dose could be escalated (13 patients, 16.3%).
If a new opioid was added or there was a conversion in the opioid medication, we documented
the recommended opioid via the PCCS. We obtained data from 74 patients, and the main opioids
were hydromorphone (25 patients, 33.8% of the 74 patients), morphine (13 patients, 17.6%), tilidine
(9 patients, 12.2%), oxycodone (8 patients, 10.8%) and fentanyl (8 patients, 10.8%).
Pain relief 48 h after consultation is a hallmark of PC quality [12]. Hence, we evaluated all patients
within the period from July 1, 2016 to May 32, 2018 (n = 1635), and whether they met this criterion.
There were 372 patients who reported pain, out of which 282 suffered moderate to severe pain. Of the
latter group, 254 (90%) patients described reduced pain levels, and 28 (10%) described the same or
worse pain levels 48 h after consultation.
Other Symptoms
We scheduled our inpatients’ premedication with respect to other symptoms. We detected that
many of our patients took drugs for nausea (56.5%), excretion problems (45.5%), depression (36.5%),
edemata (30.8%) and insomnia (28.8%). In addition, some patients took medication for neurological
symptoms (16.3%) or dyspnea (11.6%). After our PC assessment, we recommended drug conversion
because of excretion problems (19.8%), nausea (15.3%), insomnia (15.9%), dyspnea (6.5%) or depression
(6.5%). In some cases, changes in drugs for the treatment of neurological issues (1.4%) were suggested.
We evaluated whether or not the physicians on the wards implemented our recommendations
within 48 h. For the first 13 months, changes in the medication were implemented for excretion problems
(49.5%), nausea (45.3%), insomnia (32.1%), dyspnea (46.9%), depression (59.4%) and neurological
symptoms (57.1%). Moreover, we found that for male patients (41.2%), the recommended insomnia
treatment was significantly more often realized when compared to female patients (14.8%, p < 0.01)
(Table 2).
Other Care Services
We offered further care services besides our medical care. Many of our patients needed
physiotherapy (81.2%), consultation for social issues (70%) and counseling about AHCD, healthcare
proxies and/or further (outpatient) PC (55.9%). Furthermore, many patients received psychotherapy
(43.3%) and spiritual care (36.9%). Other services that were offered included nutritional guidance
(26.1%), dietary counseling (23.1%), music therapy (12.9%) and wound/stoma care (2.7%).Int. J. Environ. Res. Public Health 2020, 17, 4977 8 of 13
Table 2. Analysis of recommendations and the realized implementation of drug conversions for inpatients (subgroup analysis, n = 490 *). Comparison of realization of
recommendations between males and females for the respective symptom expressed by p-value of χ2 test.
Total Female Male
Symptom p-Value
Realized Recommended Proportion Realized Recommended Proportion Realized Recommended Proportion
Pain 81 142 57.0% 39 66 59.1% 42 76 55.3% 0.422
Excretion
48 97 49.5% 18 40 40% 30 57 52.6% 0.434
problems
Insomnia 25 78 32.1% 4 27 14.8% 21 51 41.2% 0.007
Nausea 34 75 45.3% 17 38 44.7% 17 37 45.9% 0.660
Depression 19 32 59.4% 8 13 61.5% 11 19 57.9% 0.727
Dyspnea 15 32 46.9% 3 8 37.5% 12 24 50.0% 0.112
Neurologic
4 7 57.1% 3 3 100% 1 4 25.0% 0.350
symptoms
* Patients with and without recommended drug conversion.Int. J. Environ. Res. Public Health 2020, 17, 4977 9 of 13
4. Discussion
In the period from May 1, 2015 to May 31, 2018, the number of patients referred to the PCCS
increased continuously. This trend has also been previously reported by other groups setting up a
PCCS [21–23].
Furthermore, at the University Hospital in Munich, it was shown that only 30.3% of terminally ill
cancer patients had been in contact with the PCCS before they died; in 54% of cases, the consultation
was requested in the last week of the patient’s life [24]. This led to the question of why physicians still
hesitate to request SPC. Interviews performed in a study were analyzed to facilitate the understanding
of PCCS providers and requesting physicians [25]. The providers and requesting physicians agreed
on what a PCCS should provide: handling and management of difficult symptoms, and support for
complex psychosocial issues. Furthermore, access to the PCCS was relevant, including the possibility of
communicating with the PC specialist in an informal way, and a fast response from the PCCS [25]. In our
department, the PCCS was requested online, and within 24 h, the patient was consulted by a doctor or
nurse, and responses to the requesting physician were given immediately. Furthermore, the PCCS was
introduced officially by the head physician/nurses to every member of the different departments.
Another study reported the views of two different groups: the first group consisted of physicians
with previous PCCS contact, and the second of those without any experience with PCCS [26].
Both groups agreed to manage many symptoms of patients with advanced disease, but at the same
time, they felt less comfortable handling delirium, psychosocial issues and existential needs. As a result,
70% of the participants expressed that the most important barrier to PCCS access were the unrealistic
expectations of patients and/or their families regarding prognosis [26]. In this study conducted at
the Muenster University Hospital, the standard recommendations were implemented for most of
the symptoms. Furthermore, both psychological and social issues were addressed by the PC team.
To increase the prognostic awareness, diagnostic findings were discussed with the patient together with
the physician in charge. The importance of this was underlined in a systematic review, which found
that less than half of advanced cancer patients were aware of their prognosis [27].
Many oncologists tended to request SPC in cases of advanced disease, when the control of
symptoms could no longer be managed [28]. This finding is explained as “persisting definitional issues”
regarding SPC [28]. Further, a lack of information regarding end-of-life care and reasons for referral to
PC, patient/family resistance, cultural differences and the present lack of service were described as
perceived barriers to PCCS [29]. Offering PC education (didactic presentation and educational visits)
and pocket-sized cards with referral criteria to the inpatient oncology team could be a way to increase
the number of PCCS consultations, and to change referral reasons [30]. To address the abovementioned
obstacles, we developed a flyer and prepared a lecture about the duties and responsibilities of a PCCS.
With dedicated outreach activities, information about PCCS and its care possibilities was spread within
the whole hospital.
Moreover, to set up a PCCS, it is important to know which patients to expect, and to be aware of
the required core competencies of the designated PCCS team. In a study by Dhillon et al. at the M.D.
Anderson Cancer Center of the University of Texas, the most common diagnoses were of thoracic/head
and neck, gastrointestinal, genitourinary and gynecologic cancer [31]. Those are similar to the ones in
our study, but they were ranked differently. This can be explained by the fact that Dhillon et al. grouped
thoracic with head and neck cancer, while we considered them as two different tumor locations. As a
consequence, team members ought to know how to operate for the various cancer entities, especially
gastrointestinal, gynecological, head and neck (thoracic) and genitourinary cancer.
Additionally, many of our patients suffered from fatigue (82.7%), depression (68.6%), loss of
appetite (64.7%), constipation (62.7%), pain (56.7%) and insomnia (54.9%). It is an important core
competence to know how to treat these common symptoms. Within our service, the head physician
is a gastroenterologist and could easily address gastrointestinal symptoms. Strong cooperation with
our department of psycho-oncology, physical therapy and anesthesiology was established from the
beginning. In the data provided by Delgado-Guay et al., reduced wellbeing (93%), fatigue (92%),Int. J. Environ. Res. Public Health 2020, 17, 4977 10 of 13
pain (91%), loss of appetite (84%), insomnia (76%) and anxiety (70%) were common symptoms [32].
To conclude, the presentation of symptoms was similar to what we observed in our study; however,
the representation differed, which could be explained by the different patient populations (only
advanced cancer patients in the data of Delgado-Guay et al. vs. our wider patient population, with
metastatic and non-metastatic cancer or non-cancer diagnosis). Taking the diversity of symptoms and
problems into consideration, PCCS should provide inter- and multidisciplinary support for patients.
However, we demonstrated that the symptom burden varies depending on the departments you are
cooperating with (Figure 3). Ostgathe et al. showed that the burden of symptoms differs between
cancer and non-cancer patients [33]. Dyspnea, weakness and fatigue occur more frequently in patients
without tumor disease, whereas nausea, vomiting and loss of appetite are more frequent in cancer
patients [33]; however, in that study, the analysis of the symptoms of palliative care patients was sorted
according to a dichotomy, lacking differentiation into various entities or medical fields for a large group
of non-cancer patients. Our study could, by contrast, not only provide insight into the qualitative
burdens of the symptoms of referred patients (Figure 2C), but also decipher the frequency of symptoms
presented, concerning the respective referring department (Figure 3). To our best knowledge, this is the
first study to provide a comprehensive overview enabling both PCCS and the respective departments
to quantify, and possibly anticipate or even be prepared for, the distinct and most frequent symptoms
of palliative care patients in their medical field. These data may help to realize the competencies
that PCCS team members need. The depiction of the frequency of department consultations, and the
abovementioned PCCS algorithm (Figure 1), may provide helpful tools for the existing PCCS, as well
Int. J. Environ. Res. Public Health 2020, 17, x 12 of 15
as those yet to be established at other institutions.
Figure 3. Correlation of the frequency of symptoms presented by patients referred to the PCCS and the
Figure 3. Correlation
respective departments.of the frequency of symptoms presented by patients referred to the PCCS and
the respective departments.
In our study, admissions to internal medicine, gynecology and radiotherapy departments
accounted for the highest numbers of referred patients. The regular ward rounds were performed once
a week in those departments. This underlines the importance of the regular ward rounds for
establishing an awareness of PC. Internal marketing was recognized as an important factor for raising
the awareness of departments with regard to getting in contact with PC services [34]. The three mainInt. J. Environ. Res. Public Health 2020, 17, 4977 11 of 13
In our study, admissions to internal medicine, gynecology and radiotherapy departments
accounted for the highest numbers of referred patients. The regular ward rounds were performed
once a week in those departments. This underlines the importance of the regular ward rounds for
establishing an awareness of PC. Internal marketing was recognized as an important factor for raising
the awareness of departments with regard to getting in contact with PC services [34]. The three main
barriers to oncologists using PC services can be described as (1) the idea that PC is incompatible
with cancer therapy; (2) the perception that PC has to be provided by oncologists; and (3) insufficient
information about local PC services [35]. Implementing regular ward rounds once a week with the
PCCS team, as well as supporting internal marketing, can break down these barriers; therefore, another
important core competence is the ability to explain the role and possibilities of PC in regular ward
rounds. Further, contact with the staff of different departments can help increase PC service awareness.
We were able to show that 90% of our patients reported pain reduction 48 h after the first PCCS
consultation. These patient-dependent evaluations are important for analysis of the quality of care in PC
situations [36]. Ciemins et al. reported an improvement (reduction) in pain levels of 86% at discharge
in a cohort of 282 patients [37]. Further, Hanks et al. demonstrated a significant improvement with
respect to the most unbearable symptoms in the first week after consultation through the PCCS [38].
At the beginning of the PCCS, however, we could see that our recommendations for drug
conversion were not always directly realized. There might be different reasons for this gap between
recommendation and realization, e.g., the electronic recommendation was not seen by the physician
in charge of the patient, or he/she has a different view concerning the symptoms or the need for PC.
We recommend adopting an active approach, in which the implementation of the recommendation is
evaluated the following day.
In conclusion, palliative care aims at a better quality of life and control of symptoms for
patients with life-limiting diseases. To implement a PCCS, you need to establish a multidisciplinary
team [9,39,40]. with nurses trained in PC and physicians from different specialties, such as internal
medicine, anesthesiology, neurology, oncology and physical therapy, as well as trained psychologists.
Additionally, regular personal contact with the requesting physicians and nurses concerning patients
from different departments can enhance the trust in and meaning of PCCS. Education is the key to
creating an awareness of PC in the hospital, and to enabling access for patients.
Author Contributions: Conceptualization, P.L. and P.T.E.; methodology, D.G.; software, P.L.; validation, P.L. and
P.T.E.; formal analysis, D.G.; investigation, P.L. and P.T.E.; resources, P.L.; data curation, D.G. and P.T.E.;
writing—original draft preparation, P.L. and P.T.E.; writing—review and editing, T.T. and D.G.; visualization,
P.L. and D.G.; supervision, P.L. All authors read and approved the final manuscript.
Funding: This research received no external funding.
Acknowledgments: We gratefully thank Miriam Günther and Glenn Geidel for proofreading and language
editing the manuscript.
Conflicts of Interest: The authors declare no conflict of interest.
References
1. Definition of Palliative Care. Available online: http://www.who.int/cancer/palliative/definition/en/ (accessed
on 16 November 2017).
2. Teunissen, S.C.; Wesker, W.; Kruitwagen, C.; de Haes, H.C.; Voest, E.E.; de Graeff, A. Symptom prevalence in
patients with incurable cancer: A systematic review. J. Pain Symptom Manag. 2007, 34, 94–104. [CrossRef]
[PubMed]
3. Becker, G.; Hatami, I.; Xander, C.; Dworschak-Flach, B.; Olschewski, M.; Momm, F.; Deibert, P.; Higginson, I.J.;
Blum, H.E. Palliative cancer care: An epidemiologic study. J. Clin. Oncol. 2011, 29, 646–650. [CrossRef]
4. Husebø, S.; Klaschik, E. Palliativmedizin—Grundlagen und Praxis; Auflage; Springer: Heidelberg, Germany,
2009; Volume 5.Int. J. Environ. Res. Public Health 2020, 17, 4977 12 of 13
5. Radbruch L, P.S. Standards und Richtlinien für Hospiz- und Palliativversorgung. Europa: Teil 2. Available
online: https://www.thieme-connect.com/products/ejournals/html/10.1055/s-0031-1276957 (accessed on 28
May 2020).
6. Nemeth, C.R.I. Abgestufte Hospiz- und Palliativversorgung in Österreich; Wien, Austria, 2004.
Available online: https://www.sozialministerium.at/dam/jcr:5a7fd621-74c9-44cb-9f2b-d1a946135f36/bericht_
abgestufte_hospiz-_und_palliativversorgung.pdf (accessed on 16 November 2017).
7. Dalal, S.; Palla, S.; Hui, D.; Nguyen, L.; Chacko, R.; Li, Z.; Fadul, N.; Scott, C.; Thornton, V.; Coldman, B.; et al.
Association between a name change from palliative to supportive care and the timing of patient referrals at a
comprehensive cancer center. Oncologist 2011, 16, 105–111. [CrossRef] [PubMed]
8. Higginson, I.J.; Evans, C.J. What is the evidence that palliative care teams improve outcomes for cancer
patients and their families? Cancer J. 2010, 16, 423–435. [CrossRef] [PubMed]
9. Gade, G.; Venohr, I.; Conner, D.; McGrady, K.; Beane, J.; Richardson, R.H.; Williams, M.P.; Liberson, M.;
Blum, M.; Della Penna, R. Impact of an inpatient palliative care team: A randomized control trial. J. Palliat.
Med. 2008, 11, 180–190. [CrossRef]
10. Brinkman-Stoppelenburg, A.; Witkamp, F.E.; van Zuylen, L.; van der Rijt, C.C.D.; van der Heide, A. Palliative
care team consultation and quality of death and dying in a university hospital: A secondary analysis of a
prospective study. PLoS ONE 2018, 13, e0201191. [CrossRef]
11. Hales, S.; Zimmermann, C.; Rodin, G. The quality of dying and death. Arch. Intern. Med. 2008, 168, 912–918.
[CrossRef]
12. Bausewein, C.; Simon, S.T.; Pralong, A.; Radbruch, L.; Nauck, F.; Voltz, R. Palliative Care of Adult Patients
With Cancer. Dtsch. Arztebl. Int. 2015, 112, 863–870. [CrossRef]
13. Temel, J.S.; Greer, J.A.; Muzikansky, A.; Gallagher, E.R.; Admane, S.; Jackson, V.A.; Dahlin, C.M.;
Blinderman, C.D.; Jacobsen, J.; Pirl, W.F.; et al. Early palliative care for patients with metastatic non-small-cell
lung cancer. N. Engl. J. Med. 2010, 363, 733–742. [CrossRef]
14. Scibetta, C.; Kerr, K.; McGuire, J.; Rabow, M.W. The Costs of Waiting: Implications of the Timing of Palliative
Care Consultation among a Cohort of Decedents at a Comprehensive Cancer Center. J. Palliat. Med. 2016, 19,
69–75. [CrossRef]
15. Witkamp, F.E.; van Zuylen, L.; Vergouwe, Y.; van der Rijt, C.C.D.; van der Heide, A. Concordance between
Experiences of Bereaved Relatives, Physicians, and Nurses with Hospital End-of-Life Care: Everyone Has
Their “Own Truth”. Int. J. Palliat. Care 2015, 2015, 623890. [CrossRef]
16. Heyland, D.K.; Dodek, P.; Rocker, G.; Groll, D.; Gafni, A.; Pichora, D.; Shortt, S.; Tranmer, J.; Lazar, N.;
Kutsogiannis, J.; et al. What matters most in end-of-life care: Perceptions of seriously ill patients and their
family members. CMAJ 2006, 174, 627–633. [CrossRef] [PubMed]
17. McCorkle, R.; Young, K. Development of a symptom distress scale. Cancer Nurs. 1978, 1, 373–378. [CrossRef]
[PubMed]
18. Girgis, A.J.C.; Currow, D.; Waller, A.; Kristjanson, L.; Mitchell, G.; Yates, P.; Neil, A.; Kelly, B.;
Tattersall, M.; Bowman., D. Palliative Care Needs Assessment Guidelines. Available online:
https://www.caresearch.com.au/caresearch/Portals/0/Documents/PROFESSIONAL-GROUPS/General-
Practitioners/PalliativeCareNeedsAssessmentGde-CHeRP.pdf (accessed on 28 May 2020).
19. Oken, M.M.; Creech, R.H.; Tormey, D.C.; Horton, J.; Davis, T.E.; McFadden, E.T.; Carbone, P.P. Toxicity and
response criteria of the Eastern Cooperative Oncology Group. Am. J. Clin. Oncol. 1982, 5, 649–655. [CrossRef]
20. Wickham, H. ggplot2: Elegant Graphics for Data Analysis; Springer: Berlin/Heidelberg, Germany, 2009.
21. Dalal, S.; Bruera, S.; Hui, D.; Yennu, S.; Dev, R.; Williams, J.; Masoni, C.; Ihenacho, I.; Obasi, E.; Bruera, E. Use
of Palliative Care Services in a Tertiary Cancer Center. Oncologist 2016, 21, 110–118. [CrossRef]
22. Dev, R.; Del Fabbro, E.; Miles, M.; Vala, A.; Hui, D.; Bruera, E. Growth of an academic palliative medicine
program: Patient encounters and clinical burden. J. Pain Symptom Manag. 2013, 45, 261–271. [CrossRef]
23. Norton, S.A.; Powers, B.A.; Schmitt, M.H.; Metzger, M.; Fairbanks, E.; Deluca, J.; Quill, T.E. Navigating
tensions: Integrating palliative care consultation services into an academic medical center setting. J. Pain
Symptom Manag. 2011, 42, 680–690. [CrossRef]
24. Dasch, B.; Kalies, H.; Feddersen, B.; Ruderer, C.; Hiddemann, W.; Bausewein, C. Care of cancer patients at
the end of life in a German university hospital: A retrospective observational study from 2014. PLoS ONE
2017, 12, e0175124. [CrossRef]Int. J. Environ. Res. Public Health 2020, 17, 4977 13 of 13
25. Ewing, G.; Farquhar, M.; Booth, S. Delivering palliative care in an acute hospital setting: Views of referrers
and specialist providers. J. Pain Symptom Manag. 2009, 38, 327–340. [CrossRef]
26. Snow, C.E.; Varela, B.R.; Pardi, D.A.; Adelman, R.D.; Said, S.; Reid, M.C. Identifying factors affecting
utilization of an inpatient palliative care service: A physician survey. J. Palliat. Med. 2009, 12, 231–237.
[CrossRef]
27. Chen, C.H.; Kuo, S.C.; Tang, S.T. Current status of accurate prognostic awareness in advanced/terminally ill
cancer patients: Systematic review and meta-regression analysis. Palliat. Med. 2017, 31, 406–418. [CrossRef]
[PubMed]
28. Wentlandt, K.; Krzyzanowska, M.K.; Swami, N.; Rodin, G.M.; Le, L.W.; Zimmermann, C. Referral practices
of oncologists to specialized palliative care. J. Clin. Oncol. 2012, 30, 4380–4386. [CrossRef] [PubMed]
29. Enguidanos, S.; Housen, P.; Goldstein, R.; Vesper, E.; Allen, J.; Braun, W. Physician and nurse perceptions of
a new inpatient palliative care consultation project: Implications for education and training. J. Palliat. Med.
2009, 12, 1137–1142. [CrossRef]
30. Reville, B.; Reifsnyder, J.; McGuire, D.B.; Kaiser, K.; Santana, A.J. Education and referral criteria: Impact on
oncology referrals to palliative care. J. Palliat. Med. 2013, 16, 786–789. [CrossRef] [PubMed]
31. Dhillon, N.; Kopetz, S.; Pei, B.L.; Fabbro, E.D.; Zhang, T.; Bruera, E. Clinical findings of a palliative care
consultation team at a comprehensive cancer center. J. Palliat. Med. 2008, 11, 191–197. [CrossRef]
32. Delgado-Guay, M.O.; Rodriguez-Nunez, A.; Shin, S.H.; Chisholm, G.; Williams, J.; Frisbee-Hume, S.; Bruera, E.
Characteristics and outcomes of patients with advanced cancer evaluated by a palliative care team at an
emergency center. A retrospective study. Support Care Cancer 2016, 24, 2287–2295. [CrossRef] [PubMed]
33. Ostgathe, C.; Alt-Epping, B.; Golla, H.; Gaertner, J.; Lindena, G.; Radbruch, L.; Voltz, R.; Hospice and
Palliative Care Evaluation (HOPE) Working Group. Non-cancer patients in specialized palliative care in
Germany: What are the problems? Palliat. Med. 2011, 25, 148–152. [CrossRef]
34. Liu, O.Y.; Malmstrom, T.; Burhanna, P.; Rodin, M.B. The Evolution of an Inpatient Palliative Care Consultation
Service in an Urban Teaching Hospital. Am. J. Hosp. Palliat. Care 2017, 34, 47–52. [CrossRef]
35. Schenker, Y.; Crowley-Matoka, M.; Dohan, D.; Rabow, M.W.; Smith, C.B.; White, D.B.; Chu, E.; Tiver, G.A.;
Einhorn, S.; Arnold, R.M. Oncologist factors that influence referrals to subspecialty palliative care clinics. J.
Oncol. Pract. 2014, 10, e37–e44. [CrossRef]
36. S-Leitlinie Palliativmedizin 05/2015, 2015. Available online: https://www.dgpalliativmedizin.de/images/stories/
LL_Palliativmedizin_Langversion_1_1.pdf (accessed on 16 November 2017).
37. Ciemins, E.L.; Blum, L.; Nunley, M.; Lasher, A.; Newman, J.M. The economic and clinical impact of an
inpatient palliative care consultation service: A multifaceted approach. J. Palliat. Med. 2007, 10, 1347–1355.
[CrossRef]
38. Hanks, G.W.; Robbins, M.; Sharp, D.; Forbes, K.; Done, K.; Peters, T.J.; Morgan, H.; Sykes, J.; Baxter, K.;
Corfe, F.; et al. The imPaCT study: A randomised controlled trial to evaluate a hospital palliative care team.
Br. J. Cancer 2002, 87, 733–739. [CrossRef] [PubMed]
39. Lu, C.Y.; Shen, W.C.; Kao, C.Y.; Wang, H.M.; Tang, S.C.; Chin, T.L.; Chi, C.C.; Yang, J.M.; Chang, C.W.;
Lai, Y.F.; et al. Impact of Palliative Care Consultation Service on Terminally Ill Cancer Patients: A 9-Year
Observational Cohort Study in Taiwan. Medicine (Baltimore) 2016, 95, e2981. [CrossRef] [PubMed]
40. Radwany, S.; Mason, H.; Clarke, J.S.; Clough, L.; Sims, L.; Albanese, T. Optimizing the success of a palliative
care consult service: How to average over 110 consults per month. J. Pain Symptom Manag. 2009, 37, 873–883.
[CrossRef] [PubMed]
© 2020 by the authors. Licensee MDPI, Basel, Switzerland. This article is an open access
article distributed under the terms and conditions of the Creative Commons Attribution
(CC BY) license (http://creativecommons.org/licenses/by/4.0/).You can also read