Estimating the multi-decadal carbon deficit of burned Amazonian forests - IOPscience
←
→
Page content transcription
If your browser does not render page correctly, please read the page content below
LETTER • OPEN ACCESS

Estimating the multi-decadal carbon deficit of burned Amazonian forests
To cite this article: Camila V J Silva et al 2020 Environ. Res. Lett. 15 114023

View the article online for updates and enhancements.

                                This content was downloaded from IP address 46.4.80.155 on 14/11/2020 at 21:33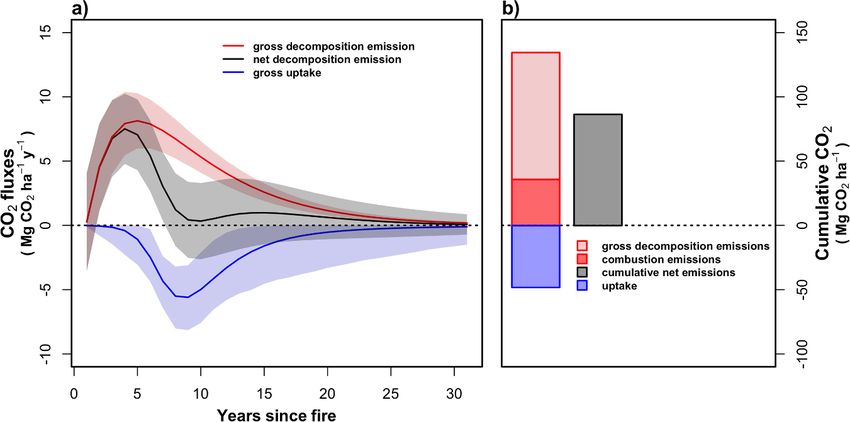
Environ. Res. Lett. 15 (2020) 114023 https://doi.org/10.1088/1748-9326/abb62c
Environmental Research Letters
LETTER
Estimating the multi-decadal carbon deficit of burned Amazonian
OPEN ACCESS
forests
RECEIVED
31 March 2020 Camila V J Silva1, Luiz E O C Aragão2,3, Paul J Young1,4, Fernando Espirito-Santo5, Erika Berenguer1,6,
REVISED Liana O Anderson7, Izaias Brasil8, Aline Pontes-Lopes2, Joice Ferreira9, Kieran Withey1, Filipe França1,
22 July 2020
Paulo M L A Graça10, Leticia Kirsten10, Haron Xaud11, Cleber Salimon12, Marcos A Scaranello13,
ACCEPTED FOR PUBLICATION
8 September 2020
Bruno Castro14, Marina Seixas9, Renato Farias15 and Jos Barlow1,16
1
PUBLISHED Lancaster Environment Centre (LEC), Lancaster University, United Kingdom
2
26 October 2020 National Institute for Space Research (INPE), São José dos Campos, Brazil
3
College of Life and Environmental Sciences, University of Exeter, United Kingdom
4
Centre of Excellence for Environmental Data Science (CEEDS), Lancaster University, United Kingdom
Original Content from 5
this work may be used Leicester Institute of Space and Earth Observation (LISEO), University of Leicester, United Kingdom
6
under the terms of the Environmental Change Institute, University of Oxford, United Kingdom
Creative Commons 7
National Centre for Monitoring and Early Warning of Natural Disaster (CEMADEN), São José dos Campos, Brazil
Attribution 4.0 licence. 8
Rede de Biodiversidade e Biotecnologia da Amazônia Legal (BIONORTE), Universidade Estadual do Maranhão, São Luiz, Brazil
Any further distribution 9
Brazilian Agricultural Research Corporation, Embrapa Amazônia Oriental, Belém, Brazil
of this work must 10
National Institute for Research in Amazonia (INPA), Manaus, Brazil
maintain attribution to 11
the author(s) and the title Brazilian Agricultural Research Corporation, Embrapa Roraima, Brazil
12
of the work, journal Universidade Estadual da Paraíba, Centro de Ciências Biológicas e Sociais Aplicadas (CCBSA), João Pessoa, Brazil
citation and DOI. 13
EMBRAPA Informática Agropecuária, Campinas, Brazil
14
Instituto de Manejo e Certificação Florestal e Agrícola (IMAFLORA), Piracicaba, Brazil
15
Instituto Centro de Vida, Alta Floresta, Brazil
16
Federal University of Lavras, Minas Gerais, Brazil
E-mail: camilaflorestal@gmail.com
Keywords: wildfires, tropical forests, stem mortality, necromass decomposition, combustion, CO2 uptake, net emissions
Supplementary material for this article is available online
Abstract
Wildfires in humid tropical forests have become more common in recent years, increasing the rates
of tree mortality in forests that have not co-evolved with fire. Estimating carbon emissions from
these wildfires is complex. Current approaches rely on estimates of committed emissions based on
static emission factors through time and space, yet these emissions cannot be assigned to specific
years, and thus are not comparable with other temporally-explicit emission sources. Moreover,
committed emissions are gross estimates, whereas the long-term consequences of wildfires require
an understanding of net emissions that accounts for post-fire uptake of CO2 . Here, using a 30 year
wildfire chronosequence from across the Brazilian Amazon, we calculate net CO2 emissions from
Amazon wildfires by developing statistical models comparing post-fire changes in stem mortality,
necromass decomposition and vegetation growth with unburned forest plots sampled at the same
time. Over the 30 yr time period, gross emissions from combustion during the fire and subsequent
tree mortality and decomposition were equivalent to 126.1 Mg CO2 ha−1 of which 73%
(92.4 Mg CO2 ha−1 ) resulted from mortality and decomposition. These emissions were only
partially offset by forest growth, with an estimated CO2 uptake of 45.0 Mg ha−1 over the same time
period. Our analysis allowed us to assign emissions and growth across years, revealing that net
annual emissions peak 4 yr after forest fires. At present, Brazil’s National Determined Contribution
(NDC) for emissions fails to consider forest fires as a significant source, even though these are
likely to make a substantial and long-term impact on the net carbon balance of Amazonia.
Considering long-term post-fire necromass decomposition and vegetation regrowth is crucial for
improving global carbon budget estimates and national greenhouse gases (GHG) inventories for
tropical forest countries.
© 2020 The Author(s). Published by IOP Publishing Ltd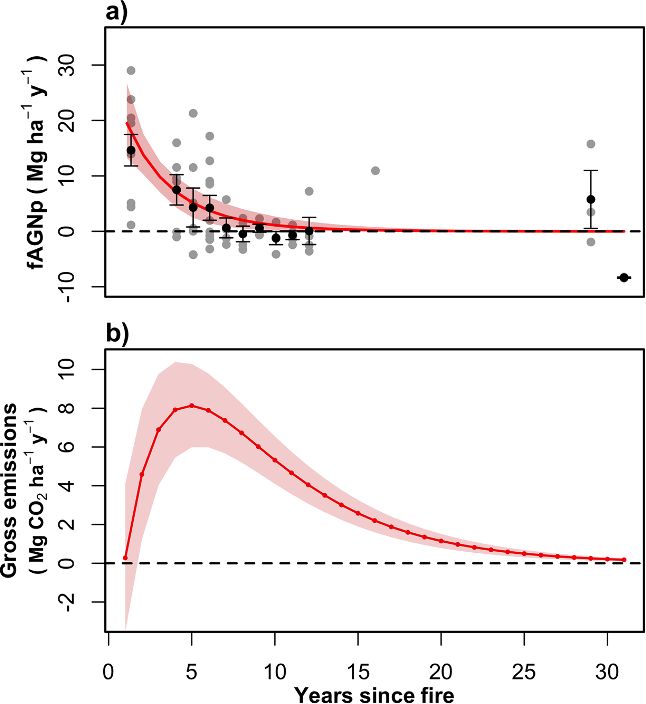
Environ. Res. Lett. 15 (2020) 114023                                                                  C V J Silva et al

1. Introduction                                            woody debris are likely to be dwarfed by the com-
                                                           mitted emissions resulting from tree mortality and
Wildfires, defined here as uncontrolled understory         subsequent decomposition. Tree mortality remains
fires affecting forested areas (Barlow et al 2020), were   above-baseline levels for at least 7 yr after the fires
once absent or incredibly rare in humid tropical           (Silva et al 2018). The subsequent decomposition of
forests (Cochrane 2003, Mcmichael et al 2012). How-        these dead trees will lead to CO2 being emitted over
ever, since the 1980s they have been growing in pre-       decades later (Chambers et al 2000). These longer-
valence due to increases in deforestation, forest frag-    term emissions could be partially or completely offset
mentation, and widespread use of fire in land man-         throughout a largely unquantified phase of post-fire
agement (Goldammer and Seibert 1990, Cochrane et           regeneration, which is initially dominated by pioneers
al 1999, Mouillot and Field 2005). These factors com-      (Barlow and Peres 2008, Berenguer et al 2018), but
bined with changes in climate, including increased         later by slow growth higher wood density tree spe-
temperatures and drought frequency, heighten fire          cies (Silva et al 2018). Without quantifying these pro-
probability (Fernandes et al 2017, Silva Junior et al      cesses, it is not possible to assign CO2 emissions from
2019). It is predicted that by 2050, the southern          wildfires to specific years, limiting our ability to com-
Brazilian Amazon will have 16% of its extent affected      pare emissions resulting from wildfires to those res-
by wildfires (Brando et al 2020). Wildfires can lead to    ulting from other sources, such as deforestation. This
large changes in species composition and forest struc-     lack of temporal detail also hinders effective track-
ture (Van Nieuwstadt and Sheil 2005, Barlow and            ing of country-level emissions targets under the Paris
Peres 2008, Balch et al 2011, Oliveras et al 2018), with   commitments. Furthermore, a better understand-
up to 50% of all trees dying when a forest burns for       ing of the temporal progression of wildfire-related
the first time (Barlow et al 2003). This is particularly   emissions would allow us to estimate their influ-
worrying, as in years of extreme drought, emissions        ence on the airborne fraction of CO2 in the atmo-
resulting from wildfires can be greater than those         sphere, elucidating previously unknown sources and
from deforestation (Alencar et al 2006, Anderson et al     sinks.
2015, Aragão et al 2018). Given the recent magnitude           Here, we provide the first evidence-based assess-
of tropical wildfires, refined temporal estimates of       ment of the temporal basis of gross and net CO2 emis-
their associated emissions are crucial for improving       sions resulting from Amazonian wildfires. We use a
national and global carbon budgets.                        unique field-based dataset of trees, palms and lianas
     Although it is recognized that tropical wildfires     in four different regions in the Brazilian Amazon,
can significantly contribute to global climate change      where stem mortality, growth and recruitment have
(Page et al 2002, Nepstad et al 2008, Brando et al         been assessed since 2009. We focused on CO2 fluxes
2020), their carbon emissions remain absent from           resulting from growth and decomposition of woody
most national and global-level accounting systems.         components, which store the largest Carbon con-
For example, the official Brazilian System for Regis-      tent with the longest residence time in the forest. We
tering National greenhouse gases (GHG) Emissions           develop a novel statistical approach to estimate year-
(SIRENE, in Portuguese) and the Brazilian System           to-year net CO2 emissions from burned forests. For
for Estimating Emissions of GHG (SEEG, in Por-             all four regions, nearby undisturbed forests were con-
tuguese) do not account for wildfire-related emis-         sidered as our baseline for forest dynamics, allowing
sions (MCTIC 2017, Azevedo et al 2018). There are          us to separate the marginal influence of fires from
two key knowledge gaps. The first is spatial; despite      confounding drought effects, and other variation
recent advances in remote sensing techniques (e.g.         across sites. We address the following questions: (i)
Anderson et al 2015, Hawbaker et al 2017, Chuvieco         What is the temporal pattern of gross CO2 emis-
et al 2018, Reiche et al 2018) fire-emission datasets      sions resulting from fire-induced stem mortality and
such as the Global Fire Emission Database (GFED)           decomposition? (ii) What is the contribution of post-
(van der Werf et al 2010), still rely on burned area       fire stem recruitment and growth to long-term CO2
products that can underestimate low-intensity under-       uptake? (iii) What is the multi-decadal net CO2 fluxes
storey wildfires in closed-canopy forests by up to 11      of burned forests given the relative contribution of
times (e.g. see Withey et al 2018). The second is tem-     combustion and decomposition-related CO2 emis-
poral; most estimates of emissions focus on imme-          sions and post-fire CO2 uptake? To answer question
diate emissions from combustion (e.g. Withey et al         (i), we have used empirical models (Silva et al 2018)
2018) or estimates of committed emissions from mor-        to describe post-fire stem mortality rates, incor-
tality (Barlow et al 2003, Alencar et al 2006, Ander-      porating a decomposition constant rate previously
son et al 2015), but no studies have yet attempted to      estimated for the central Amazon (Chambers et al
quantify the dynamics of post-fire forest carbon fluxes    2000). For question (ii), we have used the Chapman-
in humid tropical forests. This study addresses this       Richard function to model post-fire tree growth and
second knowledge gap.                                      estimate how much CO2 is taken up by vegetation
     In Amazonia, during wildfire events, the imme-        over time. For question (iii), we have used data
diate emissions from combustion of leaf litter and         from questions (i) and (ii) to model the net CO2

                                              2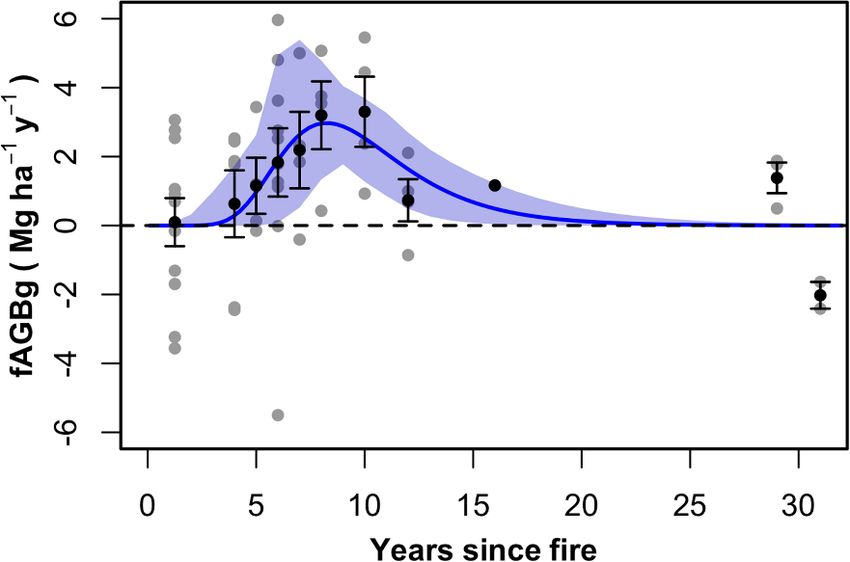
Environ. Res. Lett. 15 (2020) 114023                                                                                        C V J Silva et al

   Figure 1. Location of our four regions: Amazonas state where wildfires occurred during the 2015/2016 El Niño and forest
   censuses started by the same time (2015), Pará state where the latest wildfires occurred in 1998 and the earliest in 1985, and forest
   censuses started in 2010, Mato Grosso state where wildfires occurred during the 2005 drought and forests censuses started in
   2009, and Acre state where wildfires occurred during the 2005 drought and censuses started in 2009. Forest censuses data are
   archived in ForesPlots.net (Lopez-Gonzalez et al 2009).

fluxes following Amazonian wildfires over a 30 yr                       with the AGB gain of live stems within censuses.
period and evaluate the model by conducting                             The plot-level AGB losses due to stem mortality were
an uncertainty analysis. Finally, we compare our                        quantified by adding the AGB of all dead stems
estimates of decomposition-derived emissions                            (downed and standing) within censuses. The number
with previous estimates of combustion-related                           of times each plot was revisited varied (2–6 times), as
emissions                                                               well as the time interval between censuses (1–4 yr).
                                                                        Corrections at the plot level were applied in order
                                                                        to account for stems recruitment and mortality not
2. Methodology                                                          measured between censuses, as well as for stem-
                                                                        level growth prior to mortality, following Talbot et al
2.1. Study region and field measurements                                (2014).
Our dataset was collected in four different regions
across the Brazilian Amazonia (figure 1), with per-                     2.2. Estimating gross CO2 emissions
manent plots (0.25 ha) located in both burned (BF,                      2.2.1. Fire-induced aboveground necromass
n = 27) and unburned (UF, n = 24) terra firme                           production.
primary forests (table S.M. 1). Burned forests were                     Aboveground necromass production (AGNp,
only affected by fire once, between 1 and 30 yr prior                   Mg ha−1 y−1 ) is defined as being the same as the
to sampling. Plots in unburned forests were loc-                        annual AGB loss due to stem mortality, from all
ated near burned ones (1.3–34.6 km) and sampled                         causes, including downed and standing dead stems.
at the same time. In all plots, we measured all live                    The fire-induced AGNp (fAGNp) is determined by
stems (trees, palms and lianas; 7527) ≥10 cm of                         subtracting the AGNp of the control, unburned plots
diameter at 1.3 m height. Aboveground biomass                           from AGNp of each burned plot after the fires,
(AGB) were estimated according to Silva et al (2018),
using specific allometric equations for trees (Chave
et al 2014), palms (Goodman et al 2013) and lianas                                 fAGNp(i) = AGNpBF(i) − AGNpUF                        (1)
(Gerwing and Farias 2000). The AGB was estimated
for all live stems in the plots, with the use of spe-                   where AGNpBF(i) refers to annual AGNp of the ith
cific wood density and diameter for trees and only                      plot of burned forest and AGNpUF refers to the aver-
diameter for palms and lianas. We quantified plots                      age annual AGNp of all unburned forest plots meas-
AGB growth by adding the AGB of stems recruited                         ured in the same region at the same time of BF plots.

                                                        3
Environ. Res. Lett. 15 (2020) 114023 C V J Silva et al
This allows us to exclude the influence from spa- with all symbols defined as above. fAGNd was then
tial (e.g. soil fertility) and temporal (e.g. droughts) converted into gross CO2 emissions, using 0.5 as the
drivers on fAGNp. biomass to carbon conversion factor (Penman et al
We used a non-linear least squares regression 2003) and then by multiplying the value obtained
and a standard exponential decay function to model by 3.67 (the ratio between C and CO2 molecular
fAGNp, weights) as the CO2 conversion factor.
fAGNp(t) = fAGNp(t=0) · e(−kt) (2) 2.3. Estimating CO2 uptake by stem growth and
recruitment
where t is years since fire, and k is the rate at which Aboveground biomass growth (AGBg) is defined as
fAGNp reduces over time. The regression analysis was the annual increment in AGB due to stem growth plus
done using the nls function from the stats R package the AGB of recruited stems. Here, to estimate the fire-
(R CoreTeam 2019), S.M.2. induced changes to growth rates (fAGBg) we used a
similar relationship as equation (1),
2.2.2. Aboveground necromass decomposition.
2.2.2.1. Removing combusted necromass from fAGBg(i) = AGBgBF(i) − AGBgUF (5)
subsequent decomposition emissions in burned forests.
where AGBgBF(i) is the annual AGBg of every ith plot
Combustion during understory wildfires removes c.
of burned forest and AGBgUF is the average annual
73% of forest necromass stocks (Withey et al 2018).
AGBg of all unburned forest plots measured in the
The vast majority of this necromass would have
same region at the same time of BF plots. To model
been emitted at a later date during decomposition.
the process of post-fire forest growth according to the
To avoid accounting for this loss twice (as both
pattern observed in fAGBg over the years since fire, we
combustion and decomposition), we estimated the
fitted a Chapman-Richard growth function (Richards
decomposition that would have occurred at each year
1959), which is widely used in forestry to model
over the 30 yr (figure S.M.3) (available online at
tree population growth (Pommerening and Muszta
stacks.iop.org/ERL/15/114023/mmedia). This estim-
2016). We used a non-linear least squares regression
ate was based on published estimates of the combus-
to estimate the function parameters (S.M.2) as per
tion completeness of coarse woody debris (CWD),
fAGNp. We used the first derivative of this function
fine woody debris (FWD) and leaf litter stocks in cent-
to model the annual AGB growth rates of forests after
ral Amazonia (Withey et al 2018). The decomposition
the fire,
of the AGN stocks that were combusted was done by
the following equation: ( )(c−1) ( )
fAGBg(t) = gmax · 1 − e (−gt) · c · g · e(−gt)
cAGNd(t) = b.cAGN. e(−b.t) (3) (6)
where gmax is the maximum growth the forest could
where b is a constant decomposition rate estimated reach corresponding to the inflection point of the
for unburned forests in central Amazonia (Chambers cumulative function, g is the mean growth rate, c is
et al 2000), cAGN is combusted necromass stock that a nondimensional parameter controlling the curve
would have been emitted by decomposition, and t shape and the location of the inflection point, and
years since fire. The removal of cAGNd from total other symbols defined as above. fAGBg is converted
decomposition emissions is demonstrated in next to CO2 uptake as per fAGNd. We used CO2 uptake
section equation (4). instead of sequestration as the longevity of this sink
remains uncertain.
2.2.2.2. Decomposition of annual necromass inputs.
Over a decadal-time scale, changes in stem mortal- 2.4. Net CO2 emissions and the relative
ity mean there is a decreasing amount of above- contribution of combustion
ground necromass being produced in burned forests Net CO2 emissions were calculated by subtracting the
(fAGNp). After the first year, the fraction of AGN that modelled CO2 uptake from the modelled CO2 gross
decomposed at each year is added with the fractions emissions. We compared the relative contributions of
decomposed in the previous years. Therefore, relative our estimates of net and gross CO2 emissions (derived
to unburned forests, the total losses by decomposi- just from necromass decomposition) with published
tion fAGNd (Mg CO2 ha−1 y−1 ), occurring in burned estimates of immediate CO2 emissions deriving from
forests at a given time t is the sum of all decomposed the combustion of CWD, FWD and leaf litter in cent-
fractions (present and previous) minus the cAGNd at ral Amazonia (Withey et al 2018). We used the cumu-
a given time t (see equation (3)), lative values of each emission component to estimate
( t ) their relative contribution over the 30 yr.
∑( )
fAGNd(t) = b . fAGNp(t) . e (−b.t)
−cAGNd(t) For all analysis, we quantified and propagated
t=1 uncertainties throughout the model outputs (see sup-
(4) plementary material S.M.4).
4Environ. Res. Lett. 15 (2020) 114023 C V J Silva et al
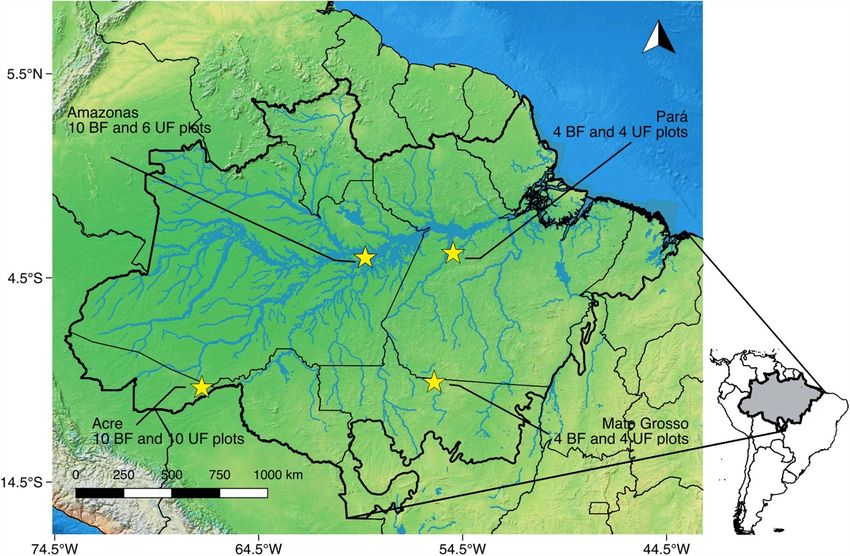
3.2. Temporal pattern of gross CO2 uptake due to
post-fire recruitment and growth
AGB growth in burned forests increased above
baseline levels accumulating the maximum of
22.5 ± 7.41 Mg ha−1 in 30 yr. AGBg slowly declined
and reached baseline levels between 20 and 25 yr
after the fire (figure 3). When burned forests AGBg
peaked, CO2 was taken up at the maximum rate of
5.59 ± 1.33 Mg ha−1 y−1 (figure 4(a)).
The nonlinear model fit the fAGBg data well
(RSE = 2.21 Mg ha−1 y−1 ; df = 50). However, the
nondimensional parameter related to the time and
size of the growth peak (‘c’ in equation (6)) had the
greatest variation (17.9 ± 18.4; tables S.M.6 and 7).
All the three parameters in the Chapman-Richard
function (gmax, k, c in equation (6)) controlling the
forest growth had similar contributions (S.M.9) at the
maximum growth (inflection point).
Figure 2. (a) Fitted model for predicting fire-induced
necromass production (fAGNp). The grey dots are 3.3. Multi-decadal net CO2 flux from burned
estimated fAGNp from field observations (n = 61) derived forests: comparing the contribution of combustion
from the comparison between burned forest plots and and decomposition-related CO2 emissions with
locally measured unburned forest plots (equation (1)),
black dots with bars are the mean ± standard error, and the post-fire CO2 uptake
red shaded area represents the 95% CI of the model. The The balance between gross emissions and uptake res-
dashed black line represents the necromass baseline in
undisturbed primary forests. (b) Total CO2 gross emissions ults in net CO2 emissions that peaked 4 yr after the
(solid line) resulting from the sum of previous and present fire, with the release of 7.51 ± 1.39 Mg CO2 ha−1 y−1
emissions per year and the subtraction of cAGN. to the atmosphere (figure 4(a)). After that, the net
CO2 emissions decline sharply due to increases in
CO2 removals. Net CO2 emissions converged with
baseline levels towards the end of the 30 yr period.
However, when we combined our estimates of CO2
3. Results emissions resulting from dead-wood decomposition
with those from the combustion of woody debris
3.1. Temporal pattern of gross CO2 emissions from and leaf litter (33.64 Mg CO2 ha−1 , see Withey et
fire-induced stem mortality and decomposition al 2018), both cumulative gross and net CO2 emis-
Immediately after fires, necromass production rates sions remained above baseline levels (figure 4(b)).
increased by 22.4 ± 4.5 Mg ha−1 y−1 above the levels We, therefore, estimate a cumulative gross emission
of unburned forests (>4-fold the UF plots’ necro- of c. 126.1 Mg CO2 ha−1 for 30 yr after a fire event.
mass), and then declined over time at a constant rate Cumulative CO2 uptake only offsets 35% of these
of 0.32 ± 0.08 yr−1 (figure 2(a); tables S.M.6 and emissions (45.0 Mg CO2 ha−1 ) within the same time-
7). Overall, the nonlinear regressions fit the fAGNp frame. Decomposition-related emissions account for
field data well (RSE = 6.63 Mg ha−1 y−1 ; df = 61). approximately 58% (47.4 Mg CO2 ha−1 ) of total
The initial necromass stock was the most import- net emissions. The inclusion of net decomposition-
ant parameter for short-term changes in fAGNp, related emissions doubles the emission estimates
while the contribution from reduction rates (‘k’ from combustion 7 yr after the fire.
in equation (2)) increased over time and was the
most important parameter for the long-term changes 4. Discussion
(figure S.M.8).
One year after fires, the CO2 emissions from 4.1. Improving emission estimates from
necromass decomposition occurred at the rate of Amazonian wildfires
0.27 ± 1.95 Mg ha−1 y−1 , as a result of low Our approach provides a calibrated method for integ-
necromass stocks. New necromass stocks are pro- rating Amazonian wildfires into national and global
duced in subsequent years as a result of delayed emission databases. At present, in humid tropical
stem mortality, triggering new decomposition pro- forests, GFED focuses on emissions from deforesta-
cesses that will emit CO2 (figure S.M.5). Gross tion fires and assumes that wildfires are carbon neut-
CO2 emissions reached their peak 5 yr after fire ral in the long term, with regrowth offsetting res-
(8.13 ± 1.1 Mg CO2 ha−1 y−1 ), and then decreased piration of woody debris and leaf litter (Landry and
over time, approaching the baseline levels 30 yr after Matthews 2016). Also, the currently omitted CO2
the fire event (figure 2(b)). emissions and removals, from post-fire stem
5Environ. Res. Lett. 15 (2020) 114023 C V J Silva et al
Figure 3. Fitted model (Chapman-Richard) for predicting fire-induced biomass growth (fAGBg). The grey dots are estimated
fAGBg from field observations (n = 50), derived from the comparison between burned forest plots and locally measured
unburned forest plots (equation (5)), black dots and bars are the mean ± standard error, and blue shaded area represent the 95%
CI of the model. The dashed black line represents the baseline growth in undisturbed primary forests.
Figure 4. (a) CO2 fluxes (Mg ha−1 y−1 ) from wildfires. Gross emissions (red line) are the total emissions derived from necromass
decomposition each year after the burn, CO2 uptake (blue line) is the CO2 taken up through above-ground biomass growth, and
net CO2 (black line) is the balance between gross CO2 emissions and uptake. (b) Cumulative CO2 (Mg ha−1 ) emissions and
uptake over 30 yr. Emissions from combustion (dark red) represent a single emission during the burn while gross decomposition
emissions (light red) are the cumulative decomposition from all necromass stocks produced in 30 yr, accounting for 73% of total
gross emissions. Uptake (blue) offsets part (35%) of total emissions resulting in above baseline values (81 Mg CO2 ha−1 ) of net
emissions (grey).
mortality, growth and recruitment, in SIRENE and contribution in 2030 (i.e. 0.9 Pg of CO2 , see UNFCCC
SEEG could be resolved by employing the approach 2016) under the Paris agreement. Following these
proposed here. The omission of wildfire-related emis- estimates, the CO2 emissions resulting from 2010
sions is important: for example, while the emis- and 2015–2016 wildfires, if properly accounted for,
sions from the 2.6 million hectares of Amazonian would have direct implications for Brazil’s abil-
forests affected by the 1998 wildfires (Alencar et al ity to meet its National Determined Contribution
2006) would have been ignored by GFED, SEEG and (NDC). Furthermore, as these emissions databases
SIRENE, our analysis suggests that this single event can be used for fire representation in dynamic global
would have emitted 0.17–0.25 Pg of CO2 to the atmo- vegetation models, the omissions shown here may
sphere by 2030, even without considering subsequent significantly impact the carbon budget of tropical
recurrent wildfires or deforestation. These are countries, if complemented by accurate wildfire
equivalent to 18%–27% of Brazil’s intended mapping.
6Environ. Res. Lett. 15 (2020) 114023 C V J Silva et al
4.2. The importance of avoiding further uncertainty: post-disturbance growth is a com-
degradation in burned forests plex process, and post-disturbance growth rates are
Across the 30 yr period, burned forests acted as net known to vary significantly by species (Berenguer
CO2 source, and cumulative net emissions were far et al 2018), across regions (e.g. Poorter et al 2016),
higher than uptake. The average net annual emis- and can be affected by environmental factors includ-
sions of burned forests over a 30 yr period were ing fire intensity and canopy openness (Balch et al
1.52 Mg CO2 ha−1 y−1 , which is approximately 36% 2013, Brando et al 2019), or even climate change
of the estimated annual sink of old-growth secondary or climate anomalies (Phillips et al 2009, Elias et al
forests across tropical American rainforests (Suarez 2020). Although we tracked mortality over time in
et al 2019). These long-term positive emissions are our burned plots, additional variability could have
supported by the non-recovery of biomass stocks to stemmed from the lack of samples in forests before
pre-disturbance levels shown in Silva et al (2018). they burned (e.g. França et al 2016). However, these
However, despite these emissions, burned forests also pre-fire samples are only achievable by chance or
remain an important part of any strategy to mitig- through experimental fires, and the data-spread (fig-
ate carbon losses from degradation. Allowing burned ures 2 and 3) suggests our field observations are rep-
forests to regrow offsets 35% of all decomposition- resentative of some of the main environmental gradi-
and combustion-related emissions over the 30 year ents within Amazonian forests (Johnson et al 2016).
period, and, unlike secondary forest, does not require Finally, temporal limitations in the dataset represent
expensive tree planting or incur opportunity costs a further source of uncertainty and our estimates of
from the abandonment of agricultural land. The pro- emission and regrowth are highly uncertain beyond
tection of burned forests from further disturbances 15 yr since fire. Narrowing this uncertainty remains
and/or clearance may also offer other important eco- challenging, as many of the sites impacted by 1980s
system services, such as maintenance of hydrological and 1998 El Nino events have either been defores-
cycling (Brando et al 2019), as well as providing hab- ted, selectively logged, and/or burned again (e.g. see
itat for biodiversity—albeit at a lower level than in Bullock et al 2020).
undisturbed primary forests (Berenguer et al 2014, Decomposition rates are also a source of uncer-
Barlow et al 2016, Ferreira & Lennox et al 2018, França tainty. We propagated the decomposition rate uncer-
et al 2020). Yet, protecting these forests from clear- tainty measured in undisturbed forests, as decom-
ance has recently become more challenging—since position rates in burned forests are unknown. Yet,
2012, deforestation rates have risen 16% on average the decomposition rates in burned forests may dif-
(PRODES 2020) and burned forests are often loc- fer due to (1) drier microclimate brought on by
ated at the agricultural frontier where they may be changes in forest structure and canopy openness (Uhl
more susceptible to clearance. Likewise, protecting and Kauffman 1990, Barlow and Peres 2008); (2)
burned forests from further disturbances is far from changes in decomposer community structure, includ-
straightforward, since burned forests are more vul- ing invertebrates (Ashton et al 2019) and microbes,
nerable to windstorms (Silvério et al 2019) and are relating to changes in pH and microclimate (Carvalho
increasingly susceptible to repeated fires (Cochrane et al 2016); (3) changes in the litter quality, espe-
et al 1999, Alencar et al 2011, Morton et al 2013, Da cially as wood density negatively affects decompos-
Silva et al 2018), which is likely to be exacerbated ition rates in undisturbed forests (Chambers et al
by climate change (Fonseca et al 2019). If burned 2000, Chao et al 2009), and at least part of the
forests burn again, the consequences for CO2 emis- mortality is related to short-lived lower wood dens-
sions are likely to be far worse. These recurrent fires ity species that colonise rapidly after fires (Silva
are often much more intense, leading to much higher et al 2018); and (4) stem mode of death, which
levels of tree mortality (Cochrane et al 1999, Barlow impacts wood decomposition rates because dead
and Peres 2004), a high turnover of species composi- stems standing and suspended from the ground have
tion towards pioneer species (Barlow and Peres 2008), much slower decomposition rates than downed stems
and slower rates of post-fire carbon uptake through (Gora et al 2019). None of these potential drivers of
regrowth (Balch et al 2013). change in decomposition rates has been previously
investigated or quantified in burned humid tropical
4.3. Quantifiable uncertainties forests.
While we present the first temporal estimate of emis- Although vegetation is the most disturbance sens-
sions from Amazonian wildfires, we also recognise itive carbon pool in the forest (Berenguer et al
that many uncertainties remain. These include par- 2014), uncertainties could also be reduced by eval-
ticularly the uncertainties associated with the growth uating other components of forest carbon cycle. For
parameters, especially relating to the phase when example, FWD and leaf litter, which corresponds to
burned forests reach their peak of CO2 uptake rel- 34% of total NPP in undisturbed forests (Malhi et
ative to unburned forests, where the confidence al 2009), is assumed to decompose at the rate of
intervals were especially high (‘c’ in equation (6); CWD. This makes the decay time of FWD and lit-
table S.M.7). There are many reasons for such high ter in our model longer (5 yr) than that expected
7Environ. Res. Lett. 15 (2020) 114023 C V J Silva et al
(6 months–2 yr; Malhi et al 2011), causing a delay emissions resulting from wildfires across the Amazon
in the emissions. Moreover, not all carbon from basin, providing a way of incorporating them into
woody debris and leaf litter is released as CO2 to both national and global carbon budgets and data-
the atmosphere; part of it is biologically transformed bases. This, however, depends on the enhancement of
and locked up in the soil or leached to groundwa- forest fire detection and mapping.
ter. The net dissolved organic carbon (DOC) export
from forest soil is, however, a very small compon-
ent of the forest carbon cycle (0.003%–1.9% of total Acknowledgments
NPP; Malhi et al 2009). While burned forests soil car-
bon pool does not differ from unburned forests (Ber- We thank P. Brando, L. Paolucci and A. Alencar
enguer et al 2014), increases in DOC may be expected for the constructive discussions which helped to
for burned forests. Further carbon release can be also improve the manuscript. C.V.J.S acknowledges the
expected through CH4 emissions from termite’s activ- Ph.D. scholarship granted from Lancaster University
ity and anaerobic decay of wood and litter. However, Faculty of Science and the grant from Quality-Related
anaerobic activity increase is unlikely in free-draining Strategic Priorities Funding (Research England). The
terra-firme forests where oxygen is not limited, and authors thank multiple funding agencies for fin-
the production of CH4 in terra-firme forests repres- ancial support that made the fieldwork possible:
ents a small component of carbon cycle (0.005%– CNPq 574008/2008-0, 458022/2013-6, 305054/2016-
0.06%; Malhi et al 2009), and the sources have not 3, 400640/2012-0, 309247/2016-0, CNPq-CAPES
been identified (Do Carmo et al 2006). While changes 441659/2016-0 [PELD-RAS], CNPq-PrevFogo-
in CH4 emission due to termites is a possibility, this IBAMA 441949/2018-5 [SEM-FLAMA], and
has not been investigated in burned humid tropical 442650/2018-3 [ACREQUEIMADAS], MCIC-CNPq
forests. 420254/2018-8 [RESFLORA]; FAPESP 2015/50392-8,
Another important set of uncertainties go beyond 2018/15001-6, 2016/21043-8 [ARBOLES]; Embrapa
our approach and relate to the spatiotemporal scal- SEG:02.08.06.005.00; The Nature Conservancy—
ing of our results. For example, wildfires are mostly Brasil; CAPES scholarships, the UK Darwin Initiat-
missed by active fire counts and estimates of burned ive 17-023; NERC NE/F01614X/1; NE/G000816/1;
area derived from satellite measures (Anderson et al NE/F015356/2; NE/l018123/1; NE/K016431/1;
2015), meaning that we lack a reliable large-scale NE/P004512/1; NE/N012542/1, H2020-MSCA-
and historical mapping of fire scar coverage across RISE (691053-ODYSSEA); the Climate and Biod-
Amazonia. Furthermore, even if fires are mapped iversity Initiative of BNP Paribas Foundation (pro-
with the use of improved techniques (Morton et al ject BIOCLIMATE); and the Inter-American Insti-
2011, Anderson et al 2015, Withey et al 2018), pre- tute for Global Change Research (IAI) SGP-HW0016
fire forest conditions will play an important role in [MAP-FIRES]. We are grateful to all field collab-
determining fire intensity and mortality (Barlow et orators, assistants, property owners who contrib-
al 2012, Brando et al 2016). Forests that have experi- uted to field logistic and data collection. Finally, we
enced disturbances from logging or fires prior to the thank the Brazilian Research Institutes (INPE, INPA,
satellite era may harbour large fuel loads, resulting EMBRAPA, LBA Santarém, ICV) for providing logist-
in more intense fires, albeit with lower initial car- ical support during the data collection and analysis.
bon stocks. However, this source of uncertainty may
remain unresolved due to the lack of both, on-the- Data availability statement
ground and remote sensing data. Mortality is also
likely to be higher near forest edges (Brando et al The data that support the findings of this study are
2019), where necromass accumulation is higher. available upon reasonable request from the authors.
5. Conclusion ORCID iDs
Most estimates of wildfire-related CO2 emissions Camila V J Silva
account for committed emissions without consider- https://orcid.org/0000-0002-4867-9871
ing the temporal evolution of stem mortality, the Kieran Withey
time taken for the subsequent decomposition of dead https://orcid.org/0000-0002-9550-4249
biomass, and the amount taken up by regrowth. By
References
incorporating long-term field-data on biomass gains
and losses, we developed an approach that addresses Alencar A, Asner G P, Knapp D and Zarin D 2011 Temporal
these knowledge gaps, showing that decomposition- variability of forest fires in eastern Amazonia Ecol. Appl. 21
related emissions make a significant contribution to 2397–412
Alencar A, Nepstad D and Diaz M C V 2006 Forest understory fire
the total CO2 emitted and are only partially off-
in the brazilian amazon in ENSO and Non-ENSO years: area
set (~35%) by post-fire forest regrowth in 30 yr. burned and committed carbon emissions Earth Interact. 10
Our approach allows the scaling-up of the net CO2 1–17
8Environ. Res. Lett. 15 (2020) 114023 C V J Silva et al
Anderson L O et al 2015 Disentangling the contribution of Chambers J Q, Higuchi N, Schimel J P, Ferreira L V and
multiple land covers to fire-mediated carbon emissions in Melack J M 2000 Decomposition and carbon cycling of dead
Amazonia during the 2010 drought Glob. Biogeochem. Cycles trees in tropical forests of the central Amazon Oecologia 122
29 1739–53 380–8
Aragão L E O C et al 2018 21st Century drought-related fires Chao K-J, Phillips O L, Baker T R, Peacock J, Lopez-Gonzalez G,
counteract the decline of Amazon deforestation carbon Vásquez Martínez R, Monteagudo A and Torres-Lezama A
emissions Nat. Commun. 9 1–12 2009 After trees die: quantities and determinants of
Ashton L A, Griffiths H G M, Parr C L, Evans T A, Didham R K, necromass across Amazonia Biogeosciences 6 1615–26
Hasan F, Teh Y A, Tin H S, Vairappan C S and Eggleton P Chave J et al 2014 Improved allometric models to estimate the
2019 Termites mitigate the effects of drought in tropical aboveground biomass of tropical trees Glob. Change Biol. 20
rainforest Science 177 174–7 3177–90
Azevedo T R et al 2018 SEEG initiative estimates of Brazilian Chuvieco E et al 2018 Generation and analysis of a new global
greenhouse gas emissions from 1970 to 2015 Sci. Data 5 burned area product based on MODIS 250m reflectance
1–43 bands and thermal anomalies Earth Syst. Sci. Data 10
Balch J K, Massad T J, Brando P M, Nepstad D C and Curran L M 2015–31
2013 Effects of high-frequency understorey fires on woody Cochrane M A, Alencar A, Schulze M D, Souza C M,
plant regeneration in southeastern Amazonian forests Phil. Nepstad D C, Lefebvre P and Davidson E A 1999 Positive
Trans. R. Soc. B 368 1-10 feedbacks in the fire dynamic of closed canopy tropical
Balch J K, Nepstad D C, Curran L M, Brando P M, Portela O, forests Science 284 1832–5
Guilherme P, Reuning-Scherer J D and de Carvalho O 2011 Cochrane M A 2003 Fire science for rainforests Nature 421 913–9
Size, species, and fire behavior predict tree and liana Da Silva S S, Fearnside P M, de Alencastro Graça P M L, Brown I
mortality from experimental burns in the Brazilian Amazon F, Alencar A and de Melo A W F 2018 Dynamics of forest
For. Ecol. Manage. 261 68–77 fires in the southwestern Amazon For. Ecol. Manage.
Barlow J et al 2016 Anthropogenic disturbance in tropical forests 424 312–22
can double biodiversity loss from deforestation Nature 535 Do Carmo J B, Keller M, Dias J D, de Camargo P B and Crill P
144–7 2006 A source of methane from upland forests in the
Barlow J, Berenguer E, Carmenta R and França F 2020 Clarifying Brazilian Amazon Geophys. Res. Lett. 33 2–5
Amazonia’s burning crisis Glob. Change Biol. 26 319–21 Elias F et al 2020 Assessing the growth and climate sensitivity of
Barlow J and Peres C A 2004 Ecological responses to El secondary forests in highly deforested Amazonian
Niño–induced surface fires in central Brazilian Amazonia: landscapes Ecology 101 e02954
management implications for flammable tropical forests Fernandes K, Verchot L, Baethgen W, Gutierrez-Velez V,
ed Y Malhi and O L Phillips Phil. Trans. R. Soc. B Pinedo-Vasquez M and Martius C 2017 Heightened fire
359 367–80 probability in Indonesia in non-drought conditions: the
Barlow J and Peres C A 2008 Fire-mediated dieback and effect of increasing temperatures Environ. Res. Lett. 12
compositional cascade in an Amazonian forest Phil. Trans. 054002
R. Soc. B 363 1787–94 Ferreira J et al 2018 Carbon-focused conservation may fail to
Barlow J, Peres C A, Lagan B O and Haugaasen T 2003 Large tree protect the most biodiverse tropical forests Nat. Clim.
mortality and the decline of forest biomass following Change 8 744–9
Amazonian wildfires Ecol. Lett. 6 6–8 Fonseca M G, Alves L M, Aguiar A P D, Arai E, Anderson L O,
Barlow J, Silveira J M, Mestre L A M, Andrade R B, Camacho Rosan T M, Shimabukuro Y E and Aragão L E O E C 2019
D’Andrea G, Louzada J, Vaz-de-mello F Z, Numata I, Lacau Effects of climate and land-use change scenarios on fire
S and Cochrane M A 2012 Wildfires in bamboo-dominated probability during the 21st century in the Brazilian Amazon
Amazonian forest: impacts on above-ground biomass and Glob. Change Biol. 25 2931–46
biodiversity PLoS One 7 e33373 França F M et al 2020 El Niño impacts on human-modified
Berenguer E, Ferreira J, Gardner T A, Aragão L E O C, De tropical forests: consequences for dung beetle diversity and
Camargo P B, Cerri C E, Durigan M, Oliveira R C D, Vieira I associated ecological processes Biotropica 52 252–62
C G and Barlow J 2014 A large-scale field assessment of França F, Louzada J, Korasaki V, Griffiths H, Silveira J M and
carbon stocks in human-modified tropical forests Glob. Barlow J 2016 Do space-for-time assessments underestimate
Change Biol. 2005 1–14 the impacts of logging on tropical biodiversity? An
Berenguer E, Malhi Y, Brando P, Cordeiro A, Ferreira J, França F, Amazonian case study using dung beetles ed R Mac Nally J.
Chesini Rossi L, Seixas M and Barlow J, 2018 Tree growth Appl. Ecol. 53 1098–105
and stem carbon accumulation in human-modified Gerwing J J and Farias D L 2000 Integrating liana abundance
Amazonian Forests Phil. Trans. R. Soc. B 373 20170308 and forest stature into an estimate of total aboveground
Brando P M, Oliveria-Santos C, Rocha W, Cury R and Coe M T biomass for an eastern Amazonian forest J. Trop. Ecol. 16
2016 Effects of experimental fuel additions on fire intensity 327–35
and severity: unexpected carbon resilience of a neotropical Goldammer J G and Seibert B 1990 The impact of droughts and
forest Glob. Change Biol. 22 2516–25 forest fires on tropical lowland rain forest of east kalimantan
Brando P M et al 2019 Prolonged tropical forest degradation due Fire in the Tropical Biota. Ecological Studies (Analysis and
to compounding disturbances: implications for CO2 and Synthesis) (Berlin: Springer) pp 11–31
H2O fluxes Glob. Change Biol. 25 2855–68 Goodman R C, Phillips O L, Del Castillo Torres D, Freitas L,
Brando P M, Soares-Filho B, Rodrigues L, Assunção A, Morton D, Cortese S T, Monteagudo A and Baker T R 2013 Amazon
Tuchschneider D, Fernandes E C M, Macedo M N, palm biomass and allometry For. Ecol. Manage. 310
Oliveira U and Coe M T 2020 The gathering firestorm in 994–1004
southern Amazonia Sci. Adv. 6 eaay1632 Gora E M, Kneale R C, Larjavaara M and Muller-Landau H C
Bullock E L, Woodcock C E, Souza C and Olofsson P 2020 2019 Dead wood necromass in a moist tropical forest:
Satellite-based estimates reveal widespread forest stocks, fluxes, and spatiotemporal variability Ecosystems 22
degradation in the Amazon Glob. Change Biol. 1189–205
26 2956–69 Hawbaker T J et al 2017 Mapping burned areas using dense
Carvalho T S, Jesus E D C, Barlow J, Gardner T A, Soares I C, time-series of Landsat data Remote Sens. Environ. 198
Tiedje J M and Moreira F M D S 2016 Land use 504–22
intensification in the humid tropics increased both alpha Johnson M O et al 2016 Variation in stem mortality rates
and beta diversity of soil bacteria Ecology 97 2760–71 determines patterns of above-ground biomass in
9Environ. Res. Lett. 15 (2020) 114023 C V J Silva et al
Amazonian forests: implications for dynamic global Pommerening A and Muszta A 2016 Relative plant growth
vegetation models Glob. Change Biol. 22 3996–4013 revisited: towards a mathematical standardisation of
Landry J-S and Matthews H D 2016 Non-deforestation fire vs. separate approaches Ecol. Modell. 320 383–92
fossil fuel combustion: the source of CO2 emissions affects Poorter L et al 2016 Biomass resilience of Neotropical secondary
the global carbon cycle and climate responses Biogeosciences forests Nature 530 211–4
13 2137–49 PRODES 2020 Instituto nacional de pesquisas espaciais
Lopez-Gonzalez G, Lewis S L, Burkitt M, Baker T R and Phillips O http://terrabrasilis.dpi.inpe.br/
L 2011 ForestPlots.net: a web application and research tool Reiche J, Verhoeven R, Verbesselt J, Hamunyela E, Wielaard N and
to manage and analyse tropical forest plot data J. Vegetation Herold M 2018 Characterizing tropical forest cover loss
Sci. 22 610-613 using dense sentinel-1 data and active fire alerts Remote
Malhi Y et al 2009 Comprehensive assessment of carbon Sens. 10 777
productivity, allocation and storage in three Amazonian Richards F J 1959 Growth function for empirical use J. Exp. Bot.
forests Glob. Change Biol. 15 1255–74 10 290–300
Malhi Y, Doughty C and Galbraith D 2011 The allocation of R CoreTeam 2019 R: the R project for statistical computing
ecosystem net primary productivity in tropical forests Phil. (Vienna: R Foundation for Statistical Computing)
Trans. R. Soc. B 366 3225–45 Silva C V J et al 2018 Drought-induced Amazonian wildfires
Mcmichael C H, Piperno D R, Bush M B, Silman M R, instigate a decadal-scale disruption of forest carbon
Zimmerman A R, Raczka M F and Lobato L C 2012 Sparse dynamics Phil. Trans. R. Soc. B 373 20180043
pre-Columbian human habitation in Western Amazonia Silva Junior C H L, Anderson L O, Silva A L, Almeida C T,
Science 336 1429–31 Dalagnol R, Pletsch M A J S, Penha T V, Paloschi R A and
MCTIC 2017 Estimativas Anuais De Emissões De Gases De Efeito Aragão L E O C 2019 Fire responses to the 2010 and
Estufa No Brasil Brazilian National Report (Brasilia, DF: 2015/2016 Amazonian droughts Front. Earth Sci. 7 97
MCTIC) Silvério D V, Brando P M, Bustamante M M C, Putz F E,
Morton D C, Defries R S, Nagol J, Souza C M, Kasischke E S, Marra D M, Levick S R and Trumbore S E 2019 Fire,
Hurtt G C and Dubayah R 2011 Mapping canopy damage fragmentation, and windstorms: A recipe for tropical forest
from understory fires in Amazon forests using annual time degradation ed D Edwards J. Ecol. 107 656–67
series of Landsat and MODIS data Remote Sens. Environ. Suarez D R et al 2019 Estimating aboveground net biomass
115 1706–20 change for tropical and subtropical forests: refinement of
Morton D C, Le Page Y, Defries R, Collatz G J and Hurtt G C 2013 IPCC default rates using forest plot data Glob. Change Biol.
Understorey fire frequency and the fate of burned forests in 25 3609–24
southern Amazonia Phil. Trans. R. Soc. B 368 20120163 Talbot J et al 2014 Methods to estimate aboveground wood
Mouillot F and Field C B 2005 Fire history and the global carbon productivity from long-term forest inventory plots For. Ecol.
budget: a 1ox 1o fire history reconstruction for the 20th Manage. 320 30–38
century Glob. Change Biol. 11 398–420 Uhl C and Kauffman J B 1990 Deforestation, fire susceptibility,
Nepstad D C, Stickler C M, Soares-Filho B and Merry F 2008 and potential tree responses to fire in the eastern Amazon
Interactions among Amazon land use, forests and climate: Ecology 71 437–49
prospects for a near-term forest tipping point Phil. Trans. R. UNFCCC Brazil intended nationally determined contribution
Soc. B 363 1737–46 2016 www4.unfccc.int/sites/NDCStaging/Pages/Home.aspx
Oliveras I et al 2018 Fire effects and ecological recovery pathways Van Nieuwstadt M G L and Sheil D 2005 Drought, fire and tree
of tropical montane cloud forests along a time survival in a Borneo rain forest, East Kalimantan, Indonesia
chronosequence Glob. Change Biol. 24 758–72 J. Ecol. 93 191–201
Page S E, Siegert F, Rieley J O, Boehm H D V, Jaya A and Limin S van der Werf G R, Randerson J T, Giglio L, Collatz G J, Mu M,
2002 The amount of carbon released from peat and forest Kasibhatla P S, Morton D C, Defries R S, Jin Y and van
fires in Indonesia during 1997 Nature 420 61–65 Leeuwen T T 2010 Global fire emissions and the
Penman J et al 2003 Good Practice Guidance for Land Use, contribution of deforestation, savanna, forest, agricultural,
Land-use Change and Forestry ed F Penman (Hayama: and peat fires (1997–2009) Atmos. Chem. Phys. 10 11707–35
Institute for Global Environmental Strategies) Withey K et al 2018 Quantifying immediate carbon emissions
Phillips O L et al 2009 Drought Sensitivity of the Amazon from El Niño-mediated wildfires in humid tropical forests
Rainforest Science 323 1344–7 Phil. Trans. R. Soc. B 373 20170312
10You can also read