Estimating the predictive power of silent mutations on cancer classification and prognosis
←
→
Page content transcription
If your browser does not render page correctly, please read the page content below
www.nature.com/npjgenmed

                  ARTICLE                  OPEN

                  Estimating the predictive power of silent mutations on cancer
                  classification and prognosis
                                                                                               1✉
                  Tal Gutman1, Guy Goren2, Omri Efroni2 and Tamir Tuller

                      In recent years it has been shown that silent mutations, in and out of the coding region, can affect gene expression and may be
                      related to tumorigenesis and cancer cell fitness. However, the predictive ability of these mutations for cancer type diagnosis and
                      prognosis has not been evaluated yet. In the current study, based on the analysis of 9,915 cancer genomes and approximately three
                      million mutations, we provide a comprehensive quantitative evaluation of the predictive power of various types of silent and non-
                      silent mutations over cancer classification and prognosis. The results indicate that silent-mutation models outperform the
                      equivalent null models in classifying all examined cancer types and in estimating the probability of survival 10 years after the initial
                      diagnosis. Additionally, combining both non-silent and silent mutations achieved the best classification results for 68% of the
                      cancer types and the best survival estimation results for up to nine years after the diagnosis. Thus, silent mutations hold
                      considerable predictive power over both cancer classification and prognosis, most likely due to their effect on gene expression. It is
                      highly advised that silent mutations are integrated in cancer research in order to unravel the full genomic landscape of cancer and
                      its ramifications on cancer fitness.
1234567890():,;

                      npj Genomic Medicine (2021)6:67 ; https://doi.org/10.1038/s41525-021-00229-1

                  INTRODUCTION                                                                              translation rates26,27, protein-folding28, transcription29–31, mRNA
                  The rapid developments of New Generation Sequencing (NGS)                                 stability32, and splicing33,34. Overall, silent mutations could modify
                  technologies and acceleration of computational abilities over the                         all phases of the gene expression process, causing amplification or
                  past few years have led to the availability of extensive genomic                          reduction in protein quantities. Hence, even though most silent
                  information1–5. Multiple research utilizing these high-dimensional                        mutations do not cause a change in protein functionality, they
                  data establish cancer as a group of highly heterogeneous genomic                          could dramatically change protein abundance and could therefore
                  diseases, characterized by large inter-tumor and intra-tumor                              influence cancer fitness.
                  diversities6–8. Moreover, common genetic features were repeat-                               We believe that including these mutations in cancer research is
                  edly identified among patients of different cancer types and                               imperative for acquiring a broader understanding of the genomic
                  significant diversities were found among patients diagnosed with                           landscape profoundly linked with cancer development and
                  the same cancer type9,10. These findings highlight the need for                            progression. Specifically, we believe that silent mutations should
                  personalized, gene-targeted cancer treatments.                                            be incorporated when building predictive models.
                     By now, hundreds of genes had been recognized as cancer                                   The incredible heterogeneity of cancerous genomes, even for
                  drivers11 and many more are currently researched. Some, like                              patients who presumably possess the same cancer type, highly
                  TP5312, BRAF13, EGFR14, or IDH115 have already been targeted for                          complicates predictive tasks. When examining only non-silent
                  gene therapy. Nonetheless, there are still numerous obstacles to                          mutations we miss a large part of the complex mutational patterns
                  overcome in order to fully unravel the cancer genomic landscape.                          of these cancerous genomes; considering the full patterns could
                  Currently, most contemporary research is based on data derived                            improve predictions. Additionally, silent driver mutations, even
                  by Whole Exome Sequencing (WES)2. In addition, most studies                               though considered today as infrequent compared to non-silent
                  focus exclusively or predominantly on non-silent mutations;                               drivers, could be highly influential35 and thus also beneficial for
                  alterations in the coding regions that cause a change in the                              predictive models. Indeed, there are previous studies that have
                  amino-acid sequence of the produced protein. Silent mutations,                            demonstrated that silent mutations or non-silent mutations that
                  such as modifications in the introns, the untranslated regions                             modulate gene expression can significantly affect the phenotype
                  (UTR’5 and UTR’3), or even synonymous mutations in the coding                             of the cancer cell and its survival33,36–42. Additionally, some
                  region itself are by and large excluded from the analyses16.                              contemporary studies identified silent mutations that are recur-
                     Yet, cancerous silent mutations could have detrimental effects                         rent for specific cancer types and are possible drivers of
                  on gene expression16–19, which in some cases could even lead to                           cancer20,23,35. However, to the best of our knowledge, no previous
                  consequences more significant than non-silent mutations. Muta-                             study has performed a broad, quantitative comparison between
                  tions in regulatory regions, such as promoters or enhancers, can                          the predictive abilities of various mutation types on cancer
                  destruct or form new transcription-factor binding sites and cause                         classification and progression. In this study, we explore silent and
                  changes in transcription regulation20–23. Mutations in the untrans-                       non-silent mutations, aiming to quantify the predictive ability of
                  lated regions can affect translation regulation or modify microRNA                        various types of silent mutations to perform cancer diagnosis and
                  binding sites and thus impact mRNA stability24. Synonymous                                to estimate patients’ survival probabilities over time, while
                  mutations can alter all aspects of gene expression25, impacting                           comparing it to the performance of non-silent mutations.

                  1
                   Department of Biomedical Engineering, the Engineering Faculty, Tel Aviv University, Tel-Aviv, Israel. 2Department of Electrical Engineering, the Engineering Faculty, Tel Aviv
                  University, Tel-Aviv, Israel. ✉email: tamirtul@tauex.tau.ac.il

                  Published in partnership with CEGMR, King Abdulaziz University
T. Gutman et al.
                  2
1234567890():,;

                      Fig. 1 TCGA data characteristics. Description of the data retrieved from TCGA after initial preprocessing (discarding patients with missing
                      genomic or clinical data and patients with multiple genomic samples). Overall, 9915 patients across 33 cancer types are included in the study.
                      a Patient distribution across cancer types. b Sorting TCGA mutations to five categories for the study. The x-axis depicts the mutation
                      classification according to TCGA*. The y-axis depicts the number of mutations in the TCGA mutation categories. The legend depicts the five
                      categories to which the mutations are sorted for this study. *Note: In TCGA, Synonymous mutations are referred to as “Silent”. As the terms are
                      in fact not interchangeable (synonymous mutations are a subcategory of silent mutations) we replace the term “Silent” with “Synonymous”
                      where needed. c Mutation type distribution. The distribution includes all mutations of the 9915 patients. d Polymorphism type distribution.
                      Mutations could be either Single Nucleotide Polymorphisms (SNP), Deletions (DEL) or Insertions (INS). The distribution includes all mutations
                      of the 9915 patients, e Names and abbreviations of the 33 cancer types.

                      RESULTS                                                                  considered mutated for a patient only if its nucleic acid content
                      Data processing and feature engineering                                  differs between the patient’s cancerous and healthy tissue
                      Genomic and clinical data of 9915 patients across 33 cancer types        samples.
                      were obtained from The Cancer Genome Atlas (TCGA)43. Data                   In the next preprocessing step, for each category, the initial data
                      characteristics are described in Fig. 1. The genomic data consisted      were used to create three kinds of features (Fig. 3), representing
                      of detailed information about the patients’ DNA mutations while          different resolutions:
                      the clinical data held personal information such as patients’ vital
                                                                                                  1. Low-resolution features—indicating the number of muta-
                      status. These data were used to perform two tasks- patients’
                                                                                                     tions each patient had in an entire gene.
                      cancer type classification and survival estimation. The full flow
                                                                                                  2. Medium-resolution features—indicating the number of
                      chart of the study is depicted in Fig. 2.
                                                                                                     mutations each patient had in a 50-nucleotide-long gene
                         As Fig. 2 indicates, the genomic data was split into five
                                                                                                     segment.
                      categories. One category holds all non-silent mutations (amino-
                                                                                                  3. High-resolution features—binary features indicating
                      acid-altering exonic mutations). The other four categories consist
                                                                                                     whether a specific mutation occurred or not, for each
                      of silent mutations from different regions within and adjacent to
                                                                                                     patient.
                      the genes; synonymous mutations (exonic mutations that do not
                      directly affect the amino acids), mutations in introns, UTRs or           Analyzing features from multiple resolution levels improves the
                      flanking regions. It is important to note that a genomic position is      models’ results (Fig. 4a, Supplementary Table 1) and could also

                      npj Genomic Medicine (2021) 67                                                    Published in partnership with CEGMR, King Abdulaziz University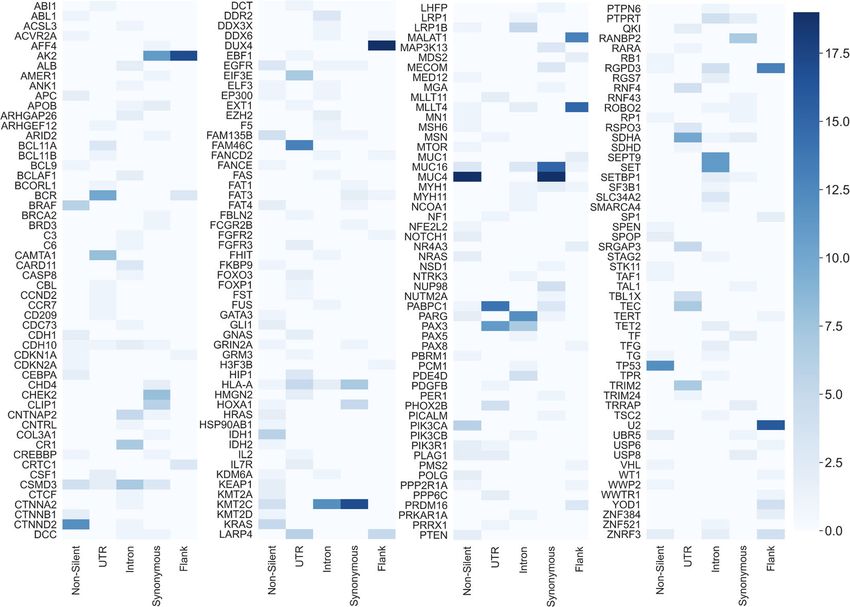
T. Gutman et al.
                                                                                                                                               3

Fig. 2 The flow chart of the study. Yellow boxes denote preprocessing steps performed for both tasks. Blue boxes denote steps performed
for the cancer type classification task and green boxes denote steps performed for the survival probability estimation task.

identify specific mutations, regulatory regions, and entire genes        Breast Invasive Carcinoma (BRCA), Liver Hepatocellular Carcinoma
that are related to cancer fitness.                                      (LIHC) and OV the performance difference between the non-silent
  The features created for each of the five categories were used as      model and the intron model was less than 10%. For Sarcoma
five separate datasets (referred to as single-mutation-type              (SARC) diagnosis, the non-silent model outperformed the UTR
datasets). A sixth dataset that combines features of all mutation       model by a mere 2%, and the flank model was exceeded by only
types (referred to as all features dataset) was also created. The six   12%. In addition, the all features models, which used both silent
datasets were used to perform cancer type diagnosis and patient         and non-silent features, obtained higher F1 scores than the non-
survival estimation. Evaluating the performance of models trained       silent models for 13 out of the 19 cancer types (denoted in red in
on the six datasets enables us to compare the predictive ability of     Fig. 4b) and for the other cancer types, the performances were
features derived from silent and non-silent mutations (referred to      very similar.
as silent features and non-silent features).                               To control for the number of features, the same analysis was
                                                                        conducted using balanced datasets as well (see Methods) and the
For all cancer types, the silent features improved cancer               results, shown in Supplementary Figure 1, accentuate the high
classification in comparison to the null model                           diagnostic ability of silent mutations; In the balanced version, the
In the cancer type classification task, only cancer types with more      Intron model outperformed the non-silent model for six cancer
than 200 patients were included (a total of 19 types). A one-vs-all     types and the UTR and flank models were superior to the non-
(OVA), supervised learning model was created for every pair of          silent model for two cancer types. Quite similarly to the
cancer type and dataset (see Methods). Specifically, each model          unbalanced datasets, combining silent and non-silent mutations
deployed the features in the dataset in order to predict whether        rather than solely using the latter improved classification results
patients suffered from the specific cancer type (classified as            for 12 out of 19 cancer types (keeping in mind that the all features
“Positive”) or suffered from any of the other types (classified as       dataset had the same number of features as the non-silent dataset
“Negative”, since the model predicts only the existence of the          in this analysis). All these findings support the hypothesis that
specific cancer). This section presents the results of this analysis.    silent mutations do affect cancer mechanisms and hold additional
   As mentioned above, combining features from three levels of          predictive information that could not be obtained from non-silent
resolutions led to the best performance of cancer type classifica-       mutations alone. Another confounder that could have influenced
tion. Figure 4b depicts the F1 scores (see Eq. (1) for the definition    the classification results is the total mutational burden. To ensure
of the F1 score) obtained by the OVA models by using features           that the improvement gained from adding silent features to non-
from all levels of resolutions. The worst performing model, which       silent features is not mainly due to the increase in the total
used flanking-region features in order to diagnose Glioblastoma          mutational burden that occurs because of the addition, we
(GBM), was 1.9 folds better than the comparable null model (see         examined how the increase in total mutational burden is
Methods for details about the null models). The best performing         correlated with the improvement in the F1 scores of the different
model that used silent features was the intron model for                cancer types (Supplementary Fig. 2). Results demonstrate a
diagnosing Ovarian Serous Cystadenocarcinoma (OV), and its              Pearson correlation of R = 0.38 (p = 0.1), indicating that only
F1 score was 20 folds higher than the comparable null model.            14% of the change in the F1 score could be explained by the
Even though the non-silent models generally achieved better             increase in mutational burden. So, even though the mutational
results than silent models, for several cancer types the perfor-        burden does impact the results of classification, it is not the
mances were substantially similar. For example, for detection of        leading factor.

Published in partnership with CEGMR, King Abdulaziz University                                           npj Genomic Medicine (2021) 67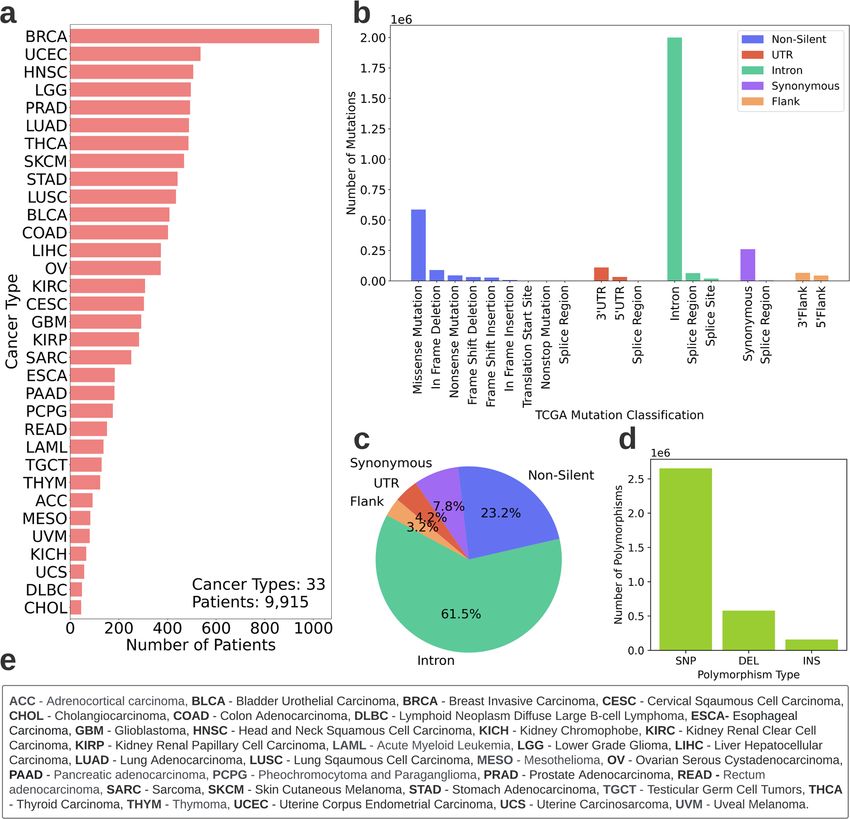
T. Gutman et al.
4

    Fig. 3 A simplified illustration of the feature extraction process. a A representation of the initial genomic information. The X’s denote
    mutations that two patients have in the same gene. The red rectangular frames represent the 50-nucleotide-long segments used for the
    medium-resolution features. b An example of the features that would have been extracted for the intron dataset and the UTR dataset
    according to the initial information shown in a.

       Another interesting phenomenon demonstrated in Fig. 4b is the        their prevalence in the initial datasets (varying between the
    considerable differences in the models’ ability to diagnose             different models). The presence of SNPs and insertions in the
    different cancer types. While the majority of the BRCA, LGG             highly ranked features was lower than their presence in the initial
    (Lower Grade Glioma) or COAD (Colon Adenocarcinoma) patients            datasets, with the exception of the UTR dataset, for which the
    were correctly diagnosed (by at least one model), KIRP (Kidney          insertions were 1.3 folds more common in the top 10 features lists
    Renal Papillary Cell Carcinoma) and STAD (Stomach Adenocarci-           than in the initial datasets, on average across cancer types.
    noma) patients were often poorly diagnosed. To explore the origin
    of this difference, we examined the similarity between genetic          A gene’s predictive power for cancer type classification varies
    profiles of the different cancer types and assessed whether              drastically when mutated by different types of mutations
    cancers with higher genetic similarity have higher misclassification
                                                                            Table 1 lists the 10 most predictive features of three of the 19
    rates: For every pair of cancer types, the correlation between their
                                                                            cancer types, as chosen by the all features models (Supplementary
    Jaccard similarity score and their misclassification rate was
    inspected (see Methods). The results (Supplementary Fig. 3)             Data 1 holds the full feature importance rankings for classifying all
    indicate a Spearman correlation coefficient of 0.72 (p-value             cancer types). As seen in Table 1, some genes appeared in the top
T. Gutman et al.
                                                                                                                                                    5

Fig. 4 Classification task results. a The F1 scores achieved in the cancer type classification task when using only high-resolution features,
high and medium-resolution features and all resolutions combined. The scores shown are the average F1 scores achieved by all features
models across all cancer types. b The F1 scores achieved by the OVA models per cancer type, using features from all levels of resolution. The x-
axis depicts the cancer types, the y-axis depicts the F1 scores achieved by the models. Each bar color denotes a different dataset. Cancer types
for which the all features model outperformed the non-silent model are denoted in red. See Fig. 1e for the unabbreviated names of the cancer
types. c Feature-type distribution of the all features dataset and of the top ranked features chosen in the classification task. Feature-type
distribution of the all features dataset* (top row), top ranked 100 features (middle row) and top ranked 10 features (bottom row). The feature
rankings were obtained from all features models classifying the 19 cancer types and were averaged across them. The legend (below the
image) indicates the enrichment in the amount of each feature-type in the top 10 features compared to its original amount in the all features
dataset (ratio between bottom and top row). *Note: The distribution depicted in the top row is the distribution of the all features dataset after
it underwent preprocessing relevant for the classification task.

has been established that not all mutations cause the same effect,         intron models and a correlation of 0.3 between the lists of the
perhaps some lead to more similar consequences than others.                synonymous and intron models. These three correlations obtained
                                                                           a p-value smaller than 8.5×10⁻⁹. Correlations between all other
Synonymous, non-silent and intronic mutations affect a                     pairs of models were neither high nor significant. A possible
gene’s predictive power on cancer type classification in a                  reason for these results is a common mechanism shared by the
positively correlated manner                                               different mutation types. For example, both synonymous and non-
To assess whether some mutation types lead to similar                      silent mutations may affect co-translational folding, and both
consequences, every cancer type was separately examined. It                synonymous and intronic mutations may influence splicing. Thus,
was assumed that if two different mutation types have similar              it is conceivable that these mutations could have similar
effects on a gene, then the predictive power of that gene for a            consequences over the gene’s expression or functionality.
specific cancer type would be similar when mutated by either one
of them. Therefore, the gene’s importance in both models should            Combining both silent and non-silent features enables the
be similar as well. Inferring to all genes, the gene importance            detection of Gene Ontology terms that are not detected by
ranking of both models should be correlated.                               non-silent features alone
   For every cancer type, a Spearman correlation was performed             Enrichment analysis was performed in order to examine whether
between every pair of gene ranking lists obtained from the five             genes that were considered important by the models are related
single-mutation-type models (see “Methods”). The correlation               to specific biological functions and processes. The affiliation of
coefficients were then averaged across all cancer types (Supple-            these genes to biological pathways could illuminate their
mentary Fig. 6 depicts the correlations obtained for each cancer           contribution to the development and progression of the disease.
type). The results (Fig. 6) indicate a significant 0.4 correlation          The GOrilla44,45 and REVIGO46 tools were used to find non-
between the gene ranking lists of the non-silent and synonymous            redundant Gene Ontology terms (GO terms) that are enriched for
models, a 0.32 correlation between the lists of the non-silent and         any of the 19 cancer types. To find the terms, a gene ranking list

Published in partnership with CEGMR, King Abdulaziz University                                               npj Genomic Medicine (2021) 67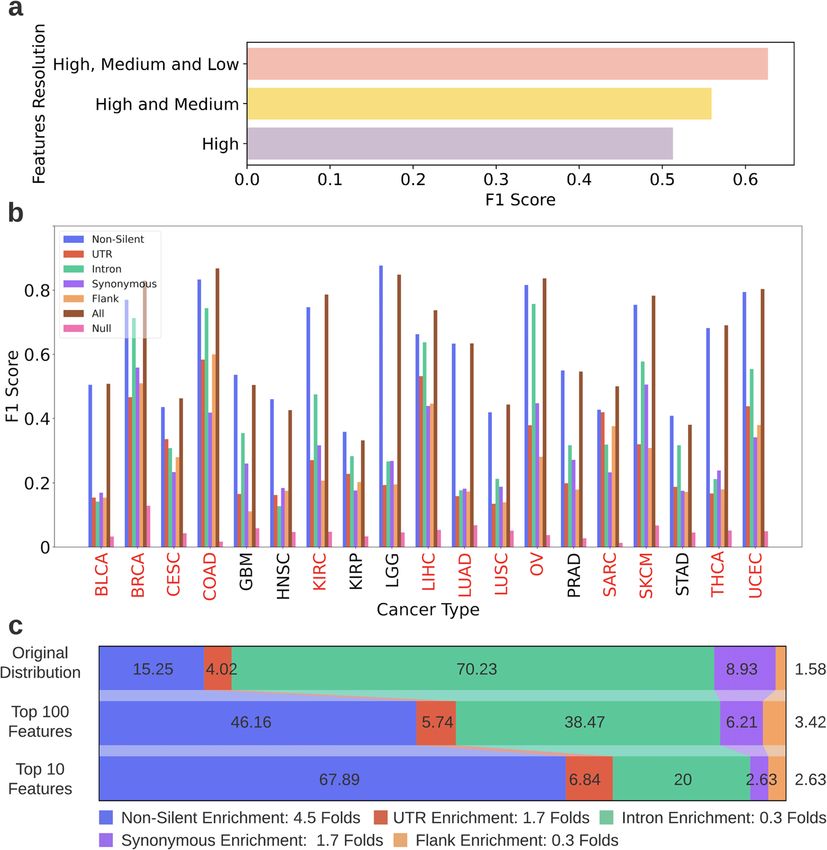
T. Gutman et al.
6
Table 1. Examples of the top 10 ranked features for classifying various cancer types.
Cancer Type Rank Feature Feature Type Importance Gene
CESC 0 MUC4 Non_Silent Non-Silent 0.16 MUC4
1 TP53 Non_Silent Non-Silent 0.06 TP53
2 PABPC1 UTR UTR 0.04 PABPC1
3 BCR UTR UTR 0.03 BCR
4 NF1 5602.0 UTR UTR 0.01 NF1
5 RGPD3 0.0 Flank Flank 0.01 RGPD3
6 CSF1 UTR UTR 0.01 CSF1
7 MUC4 Synonymous Synonymous 0.01 MUC4
8 SRGAP3 UTR UTR 0.01 SRGAP3
9 CARD11 793.0 Intron Intron 0.01 CARD11
LIHC 0 MUC4 Non_Silent Non-Silent 0.25 MUC4
1 SET 210.0 Intron Intron 0.08 SET
2 PIK3CA Non_Silent Non-Silent 0.03 PIK3CA
3 ALB Intron Intron 0.02 ALB
4 240343-240343-chr5-Intron-DEL-T-T– Intron 0.02 SDHA
5 APC Non_Silent Non-Silent 0.01 APC
6 FAM46C UTR UTR 0.01 FAM46C
7 SRGAP3 UTR UTR 0.01 SRGAP3
8 MUC4 Synonymous Synonymous 0.01 MUC4
9 SEPT9 3283.0 Intron Intron 0.01 SEPT1
THCA 0 140753336-140753336-chr7-Missense_Mutation-SNP-A-A-T Non-Silent 0.18 BRAF
1 BRAF 378.0 Non_Silent Non-Silent 0.13 BRAF
2 TP53 Non_Silent Non-Silent 0.07 TP53
3 MUC4 Non_Silent Non-Silent 0.06 MUC4
4 NRAS 189.0 Non_Silent Non-Silent 0.02 NRAS
5 MUC4 Silent Synonymous 0.02 MUC4
6 533874-533874-chr11-Missense_Mutation-SNP-T-T-C Non-Silent 0.01 HRAS
7 BRAF Non_Silent Non-Silent 0.01 BRAF
8 TP53 26.0 Non_Silent Non-Silent 0.01 TP53
9 LRP1B Intron Intron 0.01 LRP1B
The top 10 feature rankings for CESC, LIHC, and THCA are shown. For each feature, the table holds its name, mutation type, its importance for classifying the
specific cancer type and the gene to which it is related. The rankings were obtained from all features models.
was used as input for the GOrilla tool (see Methods). As silent features to non-silent features caused the gene ranking to
demonstrated in Figs. 5, 6, different mutation types dramatically encompass a broader biological significance and thus led to a
change the predictive power of genes and thus inputting gene more comprehensive detection of GO terms. Nonetheless,
rankings of the different models could illuminate different widening our prism involves a trade-off; 10 GO terms that were
biological pathways. found significant by the non-silent model were missed by the all
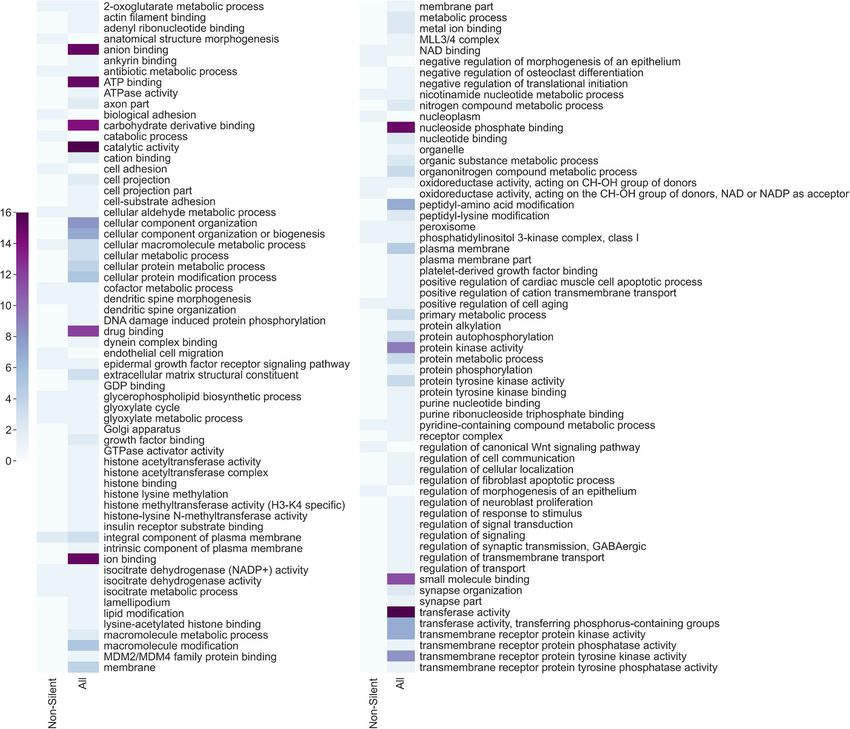
Figure 7 lists the GO terms that were enriched for the 19 cancer features model (in fact, eight of them were missed by all other
types when using the gene rankings from all features models. models, making them unique to the non-silent model. See
Examining these results, it can be seen that most GO terms that Supplementary Data 2). Among these terms are “endothelial cell
are repeatedly enriched across cancer types are related to DNA- migration” which is related to angiogenesis47 (a known cancer
protein bindings, to protein–protein bindings and to phosphor- hallmark48), “negative regulation of morphogenesis of an epithe-
ylation. As expected, these terms are associated with various lium” which is indeed effected in carcinoma development49 and
regulation mechanisms of the gene expression process, such as “regulation of canonical Wnt signaling pathway” which is known
transcription (interactions between transcription factors and RNA to be profoundly related to cell tumorigenesis50. These terms were
Polymerase, histone phosphorylation) or translation (attachment found significant only by the non-silent model and neither they
of ribosomes to the DNA sequence). nor semantically similar terms were detected by any other model.
As most research today encompasses mainly non-silent Even though the all features model missed these 10 terms, it did
mutations, it is interesting to test whether the GO terms that detect the other 21 terms that were found significant by the non-
were detected with the all features gene rankings are also silent model, meaning that the majority of the information was
detected with gene rankings obtained from non-silent models. preserved. Additionally, it detected 90 other significant GO terms
Figure 8 depicts the number of cancer types for which a GO term that were not detected by the non-silent model. These include
was found significantly enriched when using the gene rankings terms related to histone modifications (“histone binding”, “histone
from both models. It can be seen that most GO terms detected by methyltransferase activity”, “histone acetyltransferase activity”),
the all features models across various cancer types are consider- terms related to phosphorylation (“transmembrane receptor
ably less detected by the non-silent models. That is to say, adding protein phosphatase activity”, “transmembrane receptor protein
npj Genomic Medicine (2021) 67 Published in partnership with CEGMR, King Abdulaziz University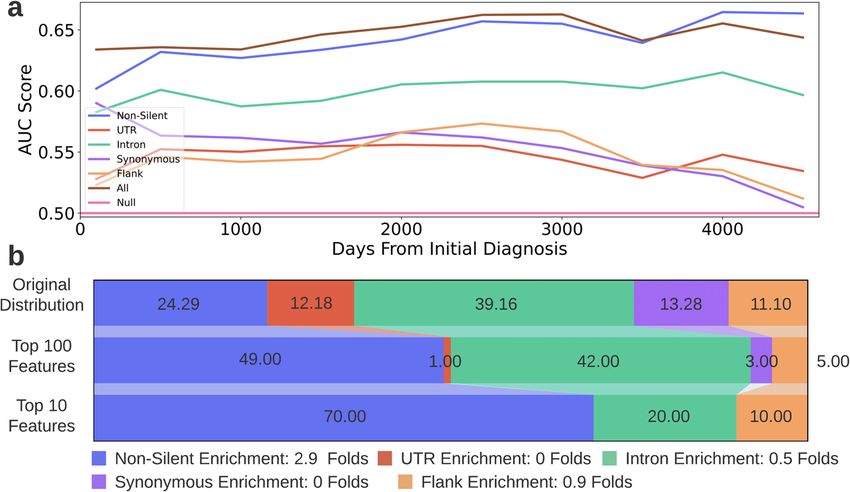
T. Gutman et al.
                                                                                                                                                      7

Fig. 5 The number of top 10 ranked genes lists a gene had appeared in when it was mutated by a specific mutation type. The figure is
constructed of four panels for readability purposes and is equivalent to a single long panel. Each row in a panel refers to a gene and every
column in a panel refers to a mutation type. The results depicted in this figure were obtained from the five single-mutation-type models. Every
gene in TCGA that is ranked in the top 10 genes list for at least one cancer type is presented in the figure (the figure includes a total of 216
genes). A lighter shade indicates that the gene was in the top 10 lists of a few cancer types and a darker shade indicates that the gene was in the
top 10 lists of many cancer types. The minimum value possible is zero (the gene is not included in the top 10 genes list of any cancer type for
that particular model) and the maximum is 19 (the gene is included in the top 10 genes lists for all examined cancers for that particular model).

                                                                            with similar semantic meanings) were detected by the non-silent
                                                                            model. We also performed pathway enrichment analysis using
                                                                            REACTOME55 (see Methods) and the results indicate that all
                                                                            features highly ranked genes are associated with multiple
                                                                            pathways related to the regulation of DNA damage. Pathways
                                                                            such as “Cell cycle checkpoints” (and specifically “G1/S DNA
                                                                            Damage Checkpoints”, “G2/M DNA damage checkpoint” and “p53-
                                                                            Dependent G1 DNA Damage Response”), “DNA double-strand
                                                                            break repair”, “SUMOylation of DNA damage response and repair
                                                                            proteins” and “TP53 Regulates Transcription of DNA Repair Genes”
                                                                            were enriched. These pathways, or any semantically similar
                                                                            pathways were not found enriched in the highly ranked genes
                                                                            of the non-silent models and are known to be profoundly related
                                                                            to tumorigenesis56,57. This further demonstrates the contribution
                                                                            of silent mutations to tumorigenesis and highlights the need to
                                                                            combine them in cancer research.
                                                                               Examining the single-feature-type silent models (Supplemen-
                                                                            tary Data 2), we can detect more GO terms that were unique to a
                                                                            specific model. For example, the term “poly(A) binding” was found
                                                                            significant only by the UTR model. This may suggest that poly(A)
Fig. 6 The average Spearman correlation of every pair of gene               binding genes tend to undergo regulation and thus also cancer
ranking lists of two models. For every cancer type, the correlation         evolution through mutations in their 3’UTR which affect regulation
between the gene ranking lists of every pair of models was
calculated. The average value across cancer types is shown. The
                                                                            via the changes in the poly(A) tail. The poly(A) tail is related to
respective average p-values are denoted in parentheses. The colors          mRNA stability and translation regulation58 and alternative
represent the correlation coefficient. A darker color indicates a            polyadenylation processes are known to be related to tumorigen-
higher correlation.                                                         esis59. Another example for a term that is unique for a specific
                                                                            model only is “O-glycan processing” which was found significant
kinase activity”) and terms related to the binding of nucleic acids         only by the synonymous model. The O-glycans are oligosacchar-
(“ATP binding”, “GDP binding”, “GTPase activator activity”). These          ides that are a major component of mucins. The mucins function
biological functions and processes are known to have implications           as a protective layer of the epithelium and changes in their
on tumorigenesis in various ways51–54 and none of them (or terms            O-glycans are related to tumorigenesis60,61.

Published in partnership with CEGMR, King Abdulaziz University                                                npj Genomic Medicine (2021) 67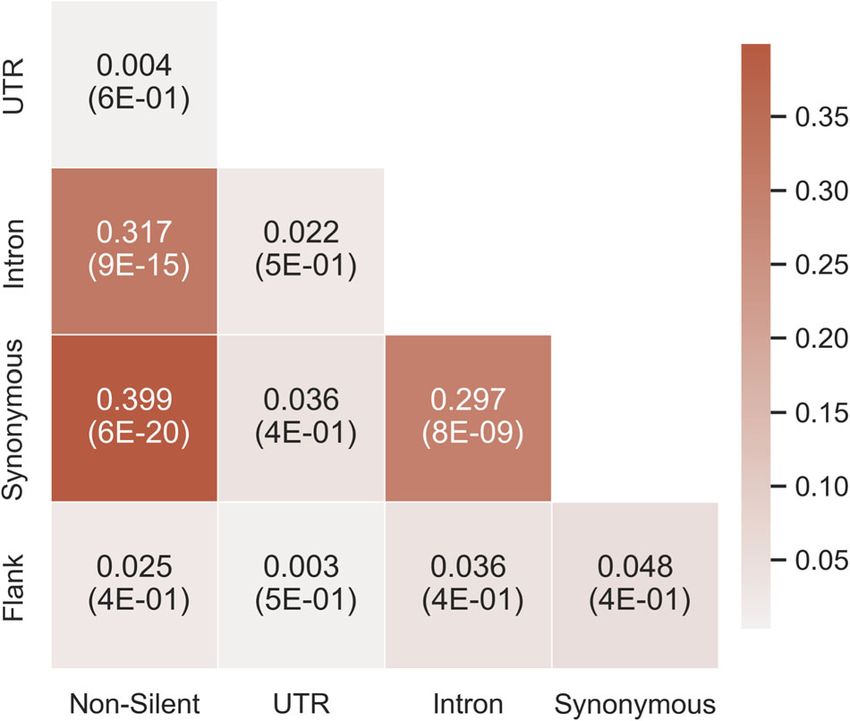
T. Gutman et al.
8

    Fig. 7 GO terms enrichment for the 19 cancer types. Received by using the gene rankings of all features models. The figure is constructed of
    two panels for readability purposes and is equivalent to a single long panel with 113 GO terms. Each row in a panel refers to a GO term and
    every column in a panel refers to a cancer type. Yellow positions indicate non-redundant enriched GO terms with a p-value smaller than 0.001
    and a q-value (FDR correction) smaller than 0.05. Blue positions indicate GO terms that are not enriched under these requirements.

       The intron model also detected many significant GO terms for          All silent features models outperformed the null model in
    the various cancer types (80), only three of which (“cell adhesion”,    predicting survival probabilities for more than 10 years after
    “biological adhesion” and “integral component of plasma mem-            an initial cancer diagnosis
    brane”) are common with the non-silent model. Exactly half of the       The purpose of this analysis was to assess whether the survival
    terms (40) were also detected by the all features model. To             probabilities of patients could be estimated solely based on their
    conclude, there is a trade-off in examining gene rankings obtained      silent mutations, and to compare the estimations of the silent
    from single-feature-type models and models that combine several         features models to the estimations of the non-silent and all
    feature types. The all features model allows for a broader view of      features models. Similarly to the cancer type classification task, no
    biological pathways but also misses terms that are highly specific       additional information, such as patient’s age, sex, race, or
    of a certain mutation type. However, this analysis strongly             treatment history was used. In this analysis, patients across all
    indicates that searching for biological significance by only
                                                                            33 cancer types were included and a Random Survival Forest
    analyzing non-silent mutations is insufficient.
                                                                            (RSF)62 algorithm was utilized (see Methods). Due to the high
       When examining the results depicted in Fig. 8, one must
    consider the uneven number of features in both models; all              computational requirements of the algorithm, only a subset of the
    features models have almost seven times as many features as the         features was chosen from each of the six initial datasets. The
    non-silent models. Because the gene ranking is derived from the         models were trained to predict patients’ survival probability at any
    feature ranking it is bound to have some effect over the                time after an initial cancer diagnosis. Then, the models were used
    enrichment results. However, it is not the only determinant; if         to estimate the survival probabilities of patients at 10 different
    the silent features were unimportant for the model, adding them         time points. The estimations were evaluated using the Area Under
    (even many of them) would not cause such a difference in the            the Curve (AUC)63 score and the results are presented in the
    enrichment results. As the rank of a gene is derived from the rank      following section.
    of its most important feature (see Methods), unimportant silent            All the silent features models outperformed the null model for
    features would have made a small impact on the gene ranking,            more than 10 years after the initial diagnosis (Fig. 9a). Additionally,
    leading to similar gene rankings of all features and non-silent         the all features model achieved the highest AUC score for more
    models and thus to similar enrichment results. The fact that many       than nine years (3500 days) after the diagnosis. This demonstrates
    more GO terms were found enriched by all features models                that the addition of silent features to non-silent features is
    demonstrates once again the importance of the silent features           superior to the use of non-silent features alone for survivability
    and the importance of examining the whole picture.                      prediction.

    npj Genomic Medicine (2021) 67                                                   Published in partnership with CEGMR, King Abdulaziz University
T. Gutman et al.
                                                                                                                                                9

Fig. 8 The number of cancer types for which a GO term was enriched using gene rankings from the non-silent models and all features
models. The figure is constructed of two panels for readability purposes and is equivalent to a single long panel with 123 GO terms. Each row
in a panel refers to a GO term and every column in a panel refers to a model from which the gene ranking list was used as input for the
GOrilla tool.

Silent features comprise 30% of the 10 most predictive                  DISCUSSION
features for survival estimation                                        It has been suggested that silent mutations could affect
Reviewing the feature importance ranking produced by the all            tumorigenesis and cancer cell fitness through changes in gene
features model for survival estimation, silent features comprised       expression regulation33,36–42. However, to the best of our knowl-
more than half of the top ranked 100 features and a third of the        edge, this study provides the first quantitative assessment of the
top ranked 10 features (Fig. 9a). Table 2 holds the 10 most             predictive power of silent mutations over cancer classification and
predictive features for survival estimation (and the full feature       prognosis in comparison to non-silent mutations.
importance list is available at Supplementary Data 3). Note that           The results demonstrate the predictive ability of silent muta-
due to technical reasons (see “Methods”) all patients are treated as    tions to perform both the classification and survival estimation
a single cohort for the survival estimation (the cancer type of each    tasks; we specifically show that for some cancer types, it is
patient is not considered by the model, only the patients’ genomic      comparable to the performances of non-silent mutations. More-
                                                                        over, combining both non-silent and silent mutations achieved
features and vital status at the last examination). If we were to
                                                                        the best classification results for 68% of the cancer types. When
perform a separate survival analysis for each cancer type as we did
                                                                        using the same number of features, a combination of silent and
in the classification task, it is probable that the number of highly     non-silent features was still superior to using only non-silent
ranked silent mutations would vary significantly among the cancer        features for 63% of cancer types. Even though the survival
types as seen in the previous task (Supplementary Tables 2,3).          estimation was not as comprehensive and precise as the
However, the fact that three of the 10 features that are most           classification task (as the patients were treated as a single cohort),
predictive of the survivability of the entire cohort are silent (even   the same conclusions are drawn from it; all silent feature models
though thousands of non-silent features were available for the          surpassed the null model for over ten years after an initial
model’s usage), is another indicator of the strong predictive ability   diagnosis and combining both silent and non-silent features led to
of silent mutations.                                                    the best survival estimations for more than 9 years. Additionally,

Published in partnership with CEGMR, King Abdulaziz University                                           npj Genomic Medicine (2021) 67
T. Gutman et al.
10
Fig. 9 Survival estimation results. a AUC scores achieved by the six RSF models for various times after the initial cancer diagnosis. The x-axis
depicts the days passed since the diagnosis and the y-axis depicts the AUC score achieved by the models. Each colored curve denotes a
different dataset. The horizontal line depicts the AUC score of a null model. b Feature-type distribution of the all features dataset and of the
top ranked features chosen in the survival probability estimation task. Feature-type distribution of the all features dataset* (top row), top
ranked 100 features (middle row) and top ranked 10 features (bottom row). The feature rankings were obtained from the all features model.
The legend indicates the enrichment in the amount of each feature-type in the top 10 features compared to its original amount in the all
features dataset (ratio between bottom and top row). *Note: The distribution depicted in the top row is the distribution of the all features
dataset after it underwent preprocessing relevant for the survival estimation task.
Table 2. The top 10 ranked features for estimating patients’ survival probability.
Rank Feature Feature type Importance Gene
0 TP53 Non_Silent Non_Silent 0.0142 TP53
1 MUC4 Non_Silent Non_Silent 0.0050 MUC4
2 57466291-57466292-chr12-Frame_Shift_Ins-INS—G Non_Silent 0.0049 GLI1
3 143147221-143147222-chr5-Intron-INS—C Intron 0.0035 ARHGAP26
4 140753336-140753336-chr7-Missense_Mutation-SNP-A-A-T Non_Silent 0.0032 BRAF
5 NKX2-1 Flank Flank 0.0031 NKX2-1
6 25743660-25743660-chr2-Missense_Mutation-SNP-T-T-G Non_Silent 0.0027 ASXL2
7 EGFR Non_Silent Non_Silent 0.0026 EGFR
8 92956452-92956452-chr15-Splice_Region-SNP-A-A-T Intron 0.0026 CHD2
9 35457937-35457938-chr6-Frame_Shift_Ins-INS—C Non_Silent 0.0026 FANCE
For each feature, the table holds its name, mutation type, its importance ranking, the gene to which it is related to and the gene’s product description. The
ranking was obtained from the all features model.
silent features were highly ranked in both tasks, surpassing functionality or regulation in a way that is optimal for the fitness of
thousands of non-silent features. In fact, considering that the cancer.
numerous silent mutations (which affect gene expression regula- Observing the feature rankings obtained by the different
tion) were found highly predictive by the models and since models, it can be seen that low-resolution features are generally
protein functionality is quite robust to point mutations64, it is ranked higher than high-resolution features (Supplementary Table
probable that some of the highly predictive non-silent mutations 4), meaning that the number of mutations in an entire functional
are such due to their impact on gene expression regulation rather region of a gene was usually a better predictor than a single
than their impact on protein functionality. A recent study that has specific mutation. This phenomenon is noticed for both silent and
found similarities between the recurrency and distribution of non-silent features. A comprehensive understanding of the
synonymous and missense mutations also supports this claim65. specific effect of all these mutations is a topic for future studies.
As shown in Fig. 4b, the predictive power of silent mutations However, here we provide few initial clues (see “Methods” for
varies significantly between cancer types. This could suggest that technical details regarding the analysis):
some cancers are more affected by changes in genes’ functionality When examining the few silent high-resolution features that
caused mostly by non-silent mutations, while others are more were highly ranked, we did not find that they significantly impact
affected by changes in gene expression levels, caused by both mRNA expression levels, splicing, or have other regulatory effects.
silent and non-silent mutations. The importance of different However, when examining the low-resolution silent features that
mutation types also varies when examining specific genes and were highly ranked, we found that some contain genomic
pathways; the predictive power of a gene changes dramatically positions that are assumed to cause a disruption of regulation if
when it is mutated by different types of mutations. This suggests mutated (Supplementary Table 5). For example, the amount of
that a mutation that causes high predictivity changes the gene’s intronic mutations in the TP53 gene was the second most
npj Genomic Medicine (2021) 67 Published in partnership with CEGMR, King Abdulaziz UniversityT. Gutman et al.
11
important feature in the all features model for detection of LUSC. Nonetheless, even though this correlation is high and significant, it
We found an SNP mutation in the intronic region, 17: 7673610: T also indicates that 52% of the variation in gene ranking could not
-> C, which annuls a splice site; this mutation was not highly be explained by the amount of mutations per gene in TCGA. In
ranked by itself, possibly due to its infrequency (present in only fact, some genes, such as HRAS, YOD1, VHL, and CEBPA, were
0.7% of LUSC patients). A recent study showed that possible driver among the most important genes for several cancer types even
mutations could be missed if they are uncommon, even if they though their number of mutations in TCGA is very small compared
have a significant effect35. The TP53 gene is maybe the most to other genes (ranging from the 4th to 16th percentile). We expect
known tumor suppressor66 and annulling of one of its splice sites that without these biases the significance of silent mutations in
could affect tumorigenesis. The number of mutations in the 3′UTR cancer diagnosis and survival prediction will be even higher than
of the SRGAP3 gene was the fourth most important feature in the the results reported here.
all features model for diagnosing SARC. We found two deletions, 3: Finally, this study provides a broad, statistical analysis of the
8985094–8985095: AT and 3: 8985094–8985097: ATAT, that both predictive abilities of silent and non-silent mutations of various
cause the formation of a new miRNA binding site. The first kinds. The results suggest that models based on silent mutations
mutation is considerably more common than the second (present could be very useful in practice. For example, for analyzing liquid
in 23.1% and 1.2% of SARC patients respectively) and was in fact biopsy samples75,76 in order to perform cancer diagnosis or track
the most important mutation in the entire SRGAP3 gene cancer prognosis. Nevertheless, extensive work is required in order
according to the model. The second mutation alone is ranked to expand and deepen our understanding of silent mutations and
appreciably lower, unsurprisingly given its low prevalence. The their ramifications on cancer development. For example, specific
SRGAP3 gene was also reported as a tumor suppressor gene67 and silent mutations that were chosen predictive by the models
an addition of a new miRNA binding site could be related to should be further investigated in order to ascertain which
tumorigenesis. The number of intronic mutations in the EGFR regulatory regions and mechanisms they impact. Novel databases
gene was ranked the fourth most important feature by the all containing information of silent mutations such as PCAWG and
features model diagnosing GBM. We found an insertion in the SynMICdb65 should be used to validate the conclusions of this
intronic region, 7: 55020559–55020560: ACACACAC, which causes study. Driver silent mutations should be distinguished from
a small but significant decrease of mRNA expression levels (0.7%). passenger silent mutations by assessing their impact on protein
This mutation is also uncommon as it is present in only 0.7% of expression and estimating their time of occurrence. Classification
GBM patients. The mutations presented above affect different should be performed on both healthy individuals and cancer
aspects of the regulation process of known tumor suppressors patients to understand the full diagnostic ability of silent
(TP53, SRGAP3) and oncogenes (EGFR), and could thus influence mutations. Classification should also be performed using genomic
tumorigenesis. Generally, it seems like there could be many information obtained from blood samples to see whether the
uncommon silent mutations with regulatory affects that are diagnostic ability is similar under these circumstances. Once
missed for lack of statistical power. With the accumulation of sufficient amounts of data are available, the survival analysis
genomic data and improvement in computational methods, we should be performed again, separately for each cancer type. This is
expect that more uncommon, silent mutations that affect
expected to improve the survival estimations and to provide
regulation and function will be identified. For the non-silent
greater comprehension of the silent and non-silent mutations that
highly ranked features, we also did not find high-resolution
affect survivability. Finally, it will make sense to validate some of
features that directly affect gene expression regulation. We found
the mutations experimentally. All these research suggestions form
only two mutations in highly ranked low-resolution features that
the tip of the iceberg in an understudied field, full of clinical
form and revoke splice sites in the KRAS and the IDH1 genes
potential that is yet to be revealed.
(Supplementary Table 6).
When examining the results of this study, one should keep in
mind some inherent biases of the data. For example, non-silent METHODS
mutations are naturally about 20 times more frequent than
Data extraction
synonymous mutations. Thus, even if the effect of a single
mutation is similar for both types, non-silent mutations are The genomic and clinical data of patients across 33 cancer types were
obtained from The Cancer Genome Atlas (TCGA)43. Patients with multiple
expected to make a larger impact. Another bias originates from genomic samples and patients with no genomic samples or clinical records
the source of the data; the genomic data in this study is derived were excluded, leaving a total of 9915 patients. The genomic data consists
using WES, which is highly biased towards exonic mutations. WES of the patients’ mutation information. A genomic position is considered
sequences the genome’s coding regions, ignoring most non- mutated for a patient only if its nucleic acid content differs between the
coding regions internal and external to genes68. In fact, an patient’s cancerous and healthy tissue samples.
astonishing 98% of the genome is overlooked when performing
WES, resulting in a narrow prism, heavily biased in favor of exonic Feature engineering
mutations. Great efforts are made these days in order to provide
Five categories of mutations were established:
data of whole genomes; The International Cancer Genome
Consortium (ICGC) and The Cancer Genome Atlas (TCGA) has 1. Non-silent mutations (coding sequence mutations that cause a
collaborated in the creation of the Pan-Cancer Analysis of Whole change in the protein’s amino-acid sequence).
Genomes (PCAWG) and offer the ability to perform meta-analyses 2. Synonymous mutations (coding sequence mutations that do not
that includes silent mutations35,69–74. While it currently contains cause a direct change in the protein’s amino-acid sequence).
significantly smaller amounts of data and therefore a weaker 3. Intronic mutations.
4. UTR mutations.
statistical power compared to WES databases, it will undoubtably 5. Flank mutations.
become a significant milestone in deciphering the contribution of
silent mutations to cancer. An additional source of bias in our For each category, the genomic data obtained from TCGA was used to
create three kinds of features, representing three levels of resolution (Fig.
analyses is the varying quantity of mutations in different genes: 3): low-resolution features, medium-resolution features, and high-
The importance of a gene for the models is greatly influenced by resolution features. Low-resolution features count the number of mutations
the number of mutations it has in TCGA. Specifically, there is an that appear in an entire gene. Medium-resolution features count the
average 0.72 Spearman correlation between the number of number of mutations that appear in a specific segment of a gene. Each
mutations that genes have in TCGA and the gene rankings gene is assembled from the 5′UTR, introns, exons and the 3′UTR. The
obtained for the 19 cancer types (Supplementary Figure 7). flanking regions are adjacent to the gene from both ends. A gene is split to
Published in partnership with CEGMR, King Abdulaziz University npj Genomic Medicine (2021) 67T. Gutman et al.
12
50-nucleotide long segments and the medium-resolution features count Gene Ontology enrichment
the number of mutations in each segment. Two additional features count Enriched GO terms (molecular functions, biological processes and cellular
the number of mutations in the 5′ flanking regions (upstream to the gene) components) were detected for the 19 cancer types using the gene
and in the 3′ flanking region (downstream to the gene). High-resolution rankings obtained from the different models. For every combination of
features indicate whether a specific mutation occurred in a specific location cancer type and model:
in the gene (For example, an A to G SNP would be considered a different
mutation than an A to C SNP, even if it had occurred in the same position). 1. The gene ranking list was created as described above.
If the specific mutation occurred only for a single patient in the TCGA 2. The gene ranking list was used as input to the GOrilla tool44,45. The
database, its respective feature was discarded. The features of each tool used maximum Hyper Geometric (mHG) statistics in order to
category were used as a separate dataset and they were also combined in report GO terms that are enriched in the top of the list compared to
order to create the sixth dataset- the all features dataset. the rest of the list. The threshold for splitting the genes list to “top”
and “rest” is dynamic and was chosen for each GO term individually
by the tool.
One vs. all classifiers 3. The yielded terms are enriched with a p-value smaller than 0.001
One vs. all classifiers were chosen to perform the classification task. As our and have passed an FDR correction of 0.05.
aim was to conduct a broad, quantitative comparison between various 4. The yielded terms were used as input to the REVIGO46 tool, which
types of mutations, we chose a classic, robust, measurable, and removed terms with a semantic similarity score higher than 0.7. The
interpretable supervised model, to lay the grounds for a fair comparison. similarity measure used was “SimRel”.
Choosing multiple OVA classifiers, as opposed to a single multiclass The enriched GO terms detected for the 19 cancer types when using the
classifier, enables us to easily explore which features are more closely all features gene ranking are detailed in Fig. 7. A comparison between the
related to which cancer type. Additionally, OVA classifiers are expected to GO terms that are detected when using the all features gene ranking or
perform better than a single multiclass classifier (as predicting a positive or the non-silent gene ranking is seen in Fig. 8.
negative verdict for a single cancer type is an easier task than predicting
one cancer type out of 19 possibilities). Thus, if a doctor already suspects a
Pathway enrichment
certain cancer type, the suspicions could be validated by the relevant
model with greater certainty. Enriched pathways were detected for the 19 cancer types using the gene
To ensure enough training examples, only cancer types with more than rankings obtained from the different models. For every combination of
200 patients were included in the analysis, resulting in 8,364 patients cancer type and model:
spanning 19 cancer types. 114 OVA classifiers were generated and trained, 1. The gene ranking list was created as described above.
one for each possible combination of cancer type (19) and dataset (6). The 2. The highest ranked 50 genes in the list were used as input to the
objective of each classifier was to distinguish a single cancer type from the REACTOME pathway enrichment analysis tool55. The number of
rest. Specifically, predicting a “Positive” or “Negative” label for a particular genes was chosen considering both statistical power and the total
cancer type. The OVA classifiers were constructed using the LightGBM77 length of the gene list.
python package. For each classifier, the patients were randomly split into 3. The REACTOME yielded enriched pathways. An enriched pathway is
stratified training and testing sets (0.7/0.3 respectively) for 10 times. A null a pathway for which the number of genes in the provided list that is
classifier was also generated using scikit-learn’s Dummy Classifier78 for associated to it is larger than expected by chance, considering both
each cancer type; the null classifier randomly assigned labels to the test-set the total amount of genes known to be associated with the pathway
patients, only considering the label distribution of the training-set patients. and the number of gene in our list. The yielded pathways obtained
The classifiers’ performance was evaluated with Accuracy, Recall, Precision, an FDR value that is smaller than 0.01.
and F1 scores (Fig. 4b, Supplementary Table 7). Performances were
averaged across the 10 splits. Precision is the fraction of correctly identified
positive patients out of all patients that were identified as positive by the Mutational burden
model. The recall is the fraction of correctly identified positive patients out The analysis presented in Supplementary Figure 2 was conducted to
of all the patients that are truly positive for the disease. The F1 score is a evaluate whether the improvement in classification that was gained from
harmonic mean of precision and recall, taking both measures into account: adding silent features to non-silent features was obtained because of the
additional mutational burden. For each cancer type:
PR
F1 ¼ 2 (1) 1. The percent of improvement gained from adding silent features was
PþR
calculated as shown in Eq. (2):
where P is Precision and R is Recall. The F1 score ranges from zero to one, F1allfeatures F1nonsilent
one indicating perfect Precision and Recall scores and zero indicating that F1improvement ¼ 100 (2)
F1nonsilent
either the Precision or Recall are also zero.
where F1allfeatures is the F1 score of the all features model of the
current cancer type.
Gene ranking 2. The percent of mutational burden gained from adding silent
Each classifier provides a feature ranking. First, features with zero features (an average across patients) was calculated as shown in Eq.
importance were discarded. Then, a gene ranking was obtained by (3): P
n MBi;allfeatures MBi;nonsilent
assigning the features (that can be mutations, segments, or entire genes) i¼1 100
to the gene they are related to while keeping the original order. Finally, MBincrease ¼
MBi;nonsilent (3)
only the highest rank of each gene was kept. The most important gene is n
ranked “0” and as the numbers increase the importance decreases. Where MBi;allfeatures is the mutational burden (number of mutations) that
the i th patient in the all features dataset has and n is the number of
patients of the current cancer type.
Spearman correlation between gene rankings We then examined the correlation between F1improvement and MBincrease
Spearman correlations were conducted between gene rankings of pairs of among the cancer types.
classifiers detecting the same cancer type (Fig. 6). For every cancer type:
1. The all features classifier was excluded. Spearman correlation between Jaccard similarity scores and
2. For each of the single-mutation-type classifiers, a gene ranking list misclassification rates
was created as described above. A Spearman correlation was conducted in order to evaluate the influence
3. Every combination of two classifiers was examined; genes that were of genetic profile similarity on misclassification rates among pairs of cancer
not in the intersection of both gene ranking lists were discarded. types. For this analysis binary versions of the features were used, meaning
Spearman correlation was calculated between the revised gene that rather than indicating how many mutations occur in genes and
ranking lists. segments the features indicate whether any mutations had occurred or not
The results were averaged across the 19 cancer types. (high-resolution features were originally binary and thus do not change).
npj Genomic Medicine (2021) 67 Published in partnership with CEGMR, King Abdulaziz UniversityT. Gutman et al.
13
Calculating the Jaccard similarity scores for every pair of cancer types was performed. The mutation-types distribution among the top 10 and top 100
performed in the following manner: features chosen by the classifiers were averaged across cancer types.
1. 100 patients were randomly selected from each type, forming two
equally sized groups of patients (groups A and B). Random survival forest models
2. A Jaccard score was calculated for every patient in the group A with A random survival forest model is an adaptation of the random forest
every patient in group B. The average score was considered the model, modified to perform survival estimations62. Its performance is
Jaccard score between the groups. The calculation was performed comparable and sometimes better than classic survival models such as Cox
as shown in Eq. (4): regression79–82. The RSF is a non-parametric data-driven approach that is
P100 P100 jFa \Fb j independent of model assumptions. It was chosen for our survival
a¼1 b¼1 jFa j þ jFb j jFa \F j (4) estimation task because it is known to perform well specifically with high-
JA;B ¼ b
dimensional datasets, compared to traditional approaches (for example,
100 100
Cox regression relies on several assumptions that are usually violated in
Where Fa is the binary feature set of patient a from group A and Fb is
high-dimensional datasets)83.
the binary feature set of patient b from group B. jFa j is the number
Patients spanning all 33 cancer types were included in this analysis (as
of features equal to “1” for patient a from group A (indicating all
positions, segments and entire genes that were mutated). JA;B is the this is not a classification task and there was no need to remove small
average Jaccard similarity score between group A and group B. cohorts). Patients with no available information after the date of diagnosis
3. The random sampling process was repeated 5 times. The final and patients who passed away less than 20 days after their diagnosis were
Jaccard score for a pair of cancer types was the average of the five not included. Overall, 9,551 patients were incorporated in the analysis. The
repetitions. patients are treated as a single cohort and the model is oblivious of their
Calculating the mistake rate for every pair of cancer types was cancer type. Unlike the classification task, this analysis is not performed
performed in the following manner: separately for each cancer type because it requires more data (e.g. while
the OVA model that diagnose BRCA trains on both BRCA-positive and
1. 250 patients were randomly selected from each type (groups A BRCA-negative patients, the RSF model that estimates the survival of BRCA
and B). patients only trains on BRCA-positive patients while aiming at estimating
2. The patients were stratified split to train and test sets (the training- an entire survival curve, and thus has a much smaller patient cohort to
set contained 70% of patients from each cancer types). train on). The vital status (alive or deceased) and appropriate time stamp
3. An OVA model was fit on the training-set patients. were extracted from the clinical data and used as labels. A subset of
4. The model was used to classify the test-set patients to one of the features was chosen for each mutation category- all low-resolution
two cancer types. features and 5,000 high-resolution features. The high-resolution features
5. The misclassification rate between the groups was calculated as
were selected based on mutation prevalence in TCGA; the features
shown in Eq. (5):
corresponding to the 5,000 most prevalent mutations were selected.
jABj þ jBAj A model was generated and trained for each one of the six datasets
MA;B ¼ (5) (non-silent, UTR, intron, synonymous, flank and all features). The objective
jAAj þ jBBj þ jABj þ jBAj
of a model was to predict the probability of a patient to survive on a given
Where jABj is the number of group-A-patients that were classified as time after its initial cancer diagnosis. The models were constructed using
group-B-patients. MA,B is the misclassification rate between groups the Pysurvival84 Python package. 60 trees were grown with a maximal
A and B.
depth of 32 splits. At each split, Kaplan–Meier estimators and the log-rank
6. The random sampling process was repeated 10 times. The
test were used to find the feature that is the best separator. For each
misclassification rate between the pair of cancer types was the
average of the 10 repetitions. model, the patients were randomly split into training and testing sets (0.7/
0.3 respectively). The model was trained using the training-set patients and
then tested on the patients of the test set, which the model has never
Balanced datasets encountered before. To avoid biases introduced by a specific split, the
To evaluate whether the results are significantly influenced by the process was repeated five times and the survival probability estimation is
imbalance between the mutation categories, balanced datasets were the average of the 5 repetitions.
created for the two analyses depicted in Fig. 4b and c. To maintain the The models’ performances on the test set patients were evaluated using
balance, only high-resolution features were used in these datasets. Six the Area Under the Curve (AUC) score for various times (100, 500, 1000,
same-size datasets were needed for the balanced version of Fig. 4b. For 1500, 2000, 2500, 3000, 3500, 4000, and 4500 days) after the initial cancer
every cancer type: diagnosis. After 4500 days the data is scarce, as most patients have
stopped attending follow-ups or have passed away. Thus, the analysis was
1. The patients were split to two equally sized groups. The first for terminated at this point.
feature selection and creation of the balanced datasets and the
second for training models on the balanced datasets and evaluating
the results. Predicting the regulatory effects of highly ranked features
2. For creating the balanced datasets six OVA models (one per dataset) Predictive models were used to assess the influence of mutations spanned
were trained using the first group of patients and all their features by the top ten ranked features of each cancer type (whether they are of
were ranked. For every model, the highest ranked 8,296 features low, medium or high resolution) on splice sites (using SpliceAI85), miRNA
were chosen as the new dataset. This step resulted in six balanced binding sites (using cnnMirTarget86), mRNA expression levels (using
datasets per cancer type, each containing 8,296 features. (The Xpresso87), polyadenylation (using SANPolyA88), 3D folding (using Akita89)
number of features was derived from the number of features in the
and several protein-mRNA binding sites (using DeepCLIP90).
smallest category, the flanking region mutations).
3. The six OVA models (one per dataset) were trained using the second
group of patients and the balanced datasets. The models were Approval for study of human subjects
trained for 10 rounds, whereby on each round a stratified random The need for Institutional Review Board Approval at our institution (Tel
0.7/0.3 split was performed. The performance was evaluated using Aviv University) was waived for this study as all data used for this project
the same measures as the imbalanced version of this analysis. had previously been generated as part of The Cancer Genome Atlas Project
For the balanced version of Fig. 4c an all features dataset with an and none of the results reported in this manuscript can be used to identify
internal balance between mutation types was needed. For every cancer individual patients.
type, the 8,296 features that were chosen from each of the five mutation
categories were combined in order to create the internally balanced all
features dataset. Then, an OVA model was trained using the balanced Reporting summary
dataset and the second group of patients. The model was trained for 10 Further information on research design is available in the Nature Research
rounds, whereby on each round a stratified random 0.7/0.3 split was Reporting Summary linked to this article.
Published in partnership with CEGMR, King Abdulaziz University npj Genomic Medicine (2021) 67You can also read