Ethiopia 2016 Demographic and Health Survey Key Findings - The DHS ...
←
→
Page content transcription
If your browser does not render page correctly, please read the page content below

Ethiopia 2016 Demographic and Health Survey Key Findings

The 2016 Ethiopia Demographic and Health Survey (2016 EDHS) was implemented by the Central Statistical
Agency (CSA) from January 18, 2016, to June 27, 2016. The funding for the 2016 EDHS was provided by the
government of Ethiopia, the United States Agency for International Development (USAID), the government of
the Netherlands, the Global Fund, Irish Aid, the World Bank, the United Nations Population Fund (UNFPA),
the United Nations Children’s Fund (UNICEF), and UN Women. ICF provided technical assistance through
The DHS Program, a USAID-funded project providing support and technical assistance in the implementation
of population and health surveys in countries worldwide.

Additional information about the 2016 EDHS may be obtained from the Central Statistical Agency of Ethiopia,
P.O. Box 1143, Addis Ababa, Ethiopia; Telephone +251-111-55-30-11/111-15 78-41; Fax: +251-111-55-03-34;
E-mail: csa@ethionet.et.

Additional information about The DHS Program may be obtained from ICF, 530 Gaither Road, Suite 500,
Rockville, MD 20850, USA; Telephone: +1-301-407-6500; Fax: 301-407-6501; E-mail: info@DHSprogram.com;
Internet: www.DHSprogram.com.

Recommended citation:

Central Statistical Agency (CSA) [Ethiopia] and ICF. 2017. 2016 Ethiopia Demographic and Health Survey Key
Findings. Addis Ababa, Ethiopia, and Rockville, Maryland, USA. CSA and ICF.

  Cover photographs: “Colorful Baskets in Addis Market” © 2016 Philip Kromer, used under Creative Commons CC2.0
                                                     Generic license; © 2015 Willow Gerber, Courtesy of Photoshare.

                                                        ETHIOPIANS AND AMERICANS
                                                     IN PARTNERSHIP TO FIGHT HIV/AIDS
About the 2016 EDHS
The 2016 Ethiopia Demographic and Health Survey (EDHS) is designed to provide data for monitoring the
population and health situation in Ethiopia. The 2016 EDHS is the fourth Demographic and Health Survey
conducted in Ethiopia since 2000. The objective of the survey is to provide reliable estimates of fertility levels,
marriage, sexual activity, fertility preferences, family planning methods, breastfeeding practices, nutrition,
childhood and maternal mortality, maternal and child health, HIV/AIDS and other sexually transmitted
infections (STIs), women’s empowerment, female genital mutilation/cutting, and domestic violence that can
be used by programme managers and policymakers to evaluate and improve existing programmes.

Who participated in the survey?
A nationally representative sample of 15,683 women age 15-49 and 12,688 men age 15-59 in 16,650 selected
households were interviewed. This represents a response rate of 95% of women and 86% of men. The 2016
EDHS provides reliable estimates at the national level, for urban and rural areas, and for each of the 9 regions
and 2 administrative cities.

                                                              © 2013 Sarah V. Harlan/JHU CCP, Courtesy of Photoshare

2016 Ethiopia Demographic and Health Survey                                                                    Page 1
Characteristics of Households and Respondents
Household Composition
The average household size in Ethiopia is 4.6
members. One-quarter of households are headed
by women. Nearly half (47%) of the Ethiopian
population is under age 15.

Water, Sanitation, and Electricity
Nearly two-thirds (65%) of households have access
to an improved source of drinking water. Almost
all households in urban areas have access to an
improved source of drinking water, compared to
57% of rural households. Only 6% of households
in Ethiopia use improved sanitation. Urban
households are more likely than rural households                      © 2016 Zelalem Gizachew, Courtesy of Photoshare

to use improved sanitation (16% versus 4%).
Ninety-four percent of households use unimproved
sanitation—9% use a shared facility, 53% use an       Ownership of Goods
unimproved facility, and 32% have no facility. More   More than half of Ethiopian households have a
than one-quarter (26%) of Ethiopian households have   mobile telephone (56%), 28% have a radio, and 14%
electricity. Nearly all urban households (93%) have   have a television. Urban households are more likely
electricity, compared to 8% of rural households.      than rural households to own a mobile telephone,
                                                      radio, or television. In contrast, rural households are
 Water, Sanitation, and Electricity by Residence      more likely to own agricultural land or farm animals
               Percent of households with:            than urban households.
                  Total Urban Rural
                                                      Education
          97                                 93       Nearly half of women (48%) and 28% of men age 15-
                                                      49 have no education. More than one-third of women
     65
               57                                     (35%) and 48% of men have attended primary school,
                                                      while 12% of women and 15% of men have attended
                                        26            secondary education. Only 6% of women and 9% of
                           16                         men have more than secondary education. About 4 in
                       6        4                 8
                                                      10 women (42%) and 7 in 10 men (69%) are literate.
      Improved         Improved         Electricity
      source of        sanitation
   drinking water
                                                                               Education
                                                         Percent distribution of women and men age 15-49
                                                              by highest level of education attended

                                                                6                    9            More than
                                                                12                   15           secondary
                                                                35
                                                                                                  Secondary
                                                                                     48
                                                                                                  Primary
                                                                48
                                                                                     28
                                                                                                  No education
                                                            Women                   Men
                                                         Figure adds up to more than 100% due to rounding.

Page 2                                                           2016 Ethiopia Demographic and Health Survey
Fertility and Its Determinants
Total Fertility Rate                                                                  Trends in Total Fertility Rate
Currently, women in Ethiopia have an average of                                       Births per woman for the three-year
                                                                                            period before the survey
4.6 children. Since 2000, fertility has decreased from
5.5 children per woman to the current level. This
demonstrates a decline of 0.9 children.

Fertility varies by residence and region. Women in                              5.5            5.4
                                                                                                              4.8                4.6
rural areas have an average of 5.2 children, compared
to 2.3 children among women in urban areas. Fertility
is lowest in Addis Ababa (1.8 children per woman)
and highest in Somali (7.2 children per woman).
                                                                              2000            2005          2011                 2016
                                                                              EDHS            EDHS          EDHS                 EDHS
Fertility also varies with education and economic
status. Women with no education have 3.8 more
children than women with more than secondary
education (5.7 versus 1.9). Fertility decreases as the
wealth of the respondent’s household* increases.
Women living in the poorest households have an
average of 6.4 children, compared to 2.6 children
among women living in the wealthiest households.                                      Total Fertility Rate by Region
                                                                                      Births per woman for the three-year
                                                                                            period before the survey

     Total Fertility Rate by Household Wealth                                                   Tigray                 4.7
              Births per woman for the three-year                                                 Affar                    5.5
                    period before the survey
                                                                                              Amhara                3.7

                                                                                             Oromiya                       5.4
        6.4                                                                                    Somali                            7.2
                    5.6
                               4.9
                                          4.3                                  Benishangul-Gumuz                       4.4
                                                     2.6                                       SNNPR                   4.4
                                                                                             Gambela                3.5
      Lowest Second Middle Fourth Highest
                                                                                                Harari               4.1
    Poorest                                     Wealthiest
                                                                                         Addis Ababa          1.8
                                                                                            Dire Dawa            3.1
                                                                                              Ethiopia                 4.6

* Wealth of families is calculated through household assets collected from DHS surveys—i.e., type of flooring; source of water;
availability of electricity; possession of durable consumer goods. These are combined into a single wealth index. They are then divided
into five groups of equal size, or quintiles, based on their relative standing on the household wealth index.

2016 Ethiopia Demographic and Health Survey                                                                                            Page 3
Age at First Sex, Marriage, and Birth                     Polygyny
Ethiopian women begin sexual activity before              Eleven percent of Ethiopian women age 15-49 are in a
Ethiopian men. The median age at first sexual             polygynous union. Polygyny is most common among
intercourse for women age 25-49 is 16.6 years,            women in Somali region (29%). Five percent of men
compared to 21.2 years among men age 25-49.               age 15-49 are in a polygynous union.
Women with more than secondary education initiate
sex 6.3 years later than women with no education          Teenage Childbearing
(22.3 years versus 16.0 years). One in four women         In Ethiopia, 13% of adolescent women age 15-19 are
begins sexual activity before age 15, while 62% have      already mothers or pregnant with their first child.
sex before age 18.                                        Teenage fertility is three times higher in rural areas
                                                          (15%) than in urban areas (5%). Adolescent women
Women get married 0.5 years after sexual initiation       in the poorest households are four times as likely as
at age 17.1. Ethiopian men marry much later than          those in the wealthiest households to have begun
women at a median age of 23.7 years. Women with           childbearing (24% versus 6%). Teenage pregnancy
no education marry 7.7 years earlier than women           decreases with increased education; 28% of young
with more than secondary education (16.3 years            women with no education have begun childbearing
versus 24.0 years). Nearly 6 in 10 (58%) Ethiopian        compared to 3% young women with more than
women are married by age 18, compared to 1 in 10          secondary education. Regionally, teenage pregnancy
men (9%).                                                 ranges from 3% in Addis Ababa to 23% in Affar.
Within 2.1 years of marriage, women are having their
first birth. The median age at first birth for women is         Teenage Childbearing by Education
19.2 years. Nearly 4 in 10 (38%) women give birth by                   Percent of women age 15-19 who
age 18.                                                                    have begun childbearing

  Median Age at First Sex, Marriage, and Birth
           Among women and men age 25-49
                                                                 28
                  Women Men

                             23.7                                             12
              21.2
                                     19.2                                                  4            3
       16.6           17.1
                                                                No          Primary   Secondary More than
                                                             education                          secondary

                                            na
         Median       Median          Median
          age at     age at first      age at
         first sex    marriage       first birth

Page 4                                                                2016 Ethiopia Demographic and Health Survey
Family Planning
Current Use of Family Planning                                      Family Planning
More than one-third (36%) of married women age              Percent of married women age 15-49
                                                                   using family planning
15-49 use any method of family planning—35% use
a modern method and 1% use a traditional method.                   Any method                    36
Injectables are the most popular modern method
(23%), followed by implants (8%), IUD (2%), and the        Any modern method                     35
pill (2%).                                                           Injectables            23
Among sexually active, unmarried women age 15-                         Implants        8
49, 55% use a modern method of family planning
                                                        Any traditional method 1
and 3% use a traditional method. The most popular
methods among sexually active, unmarried women
are injectables (35%) and implants (11%).

Use of modern methods of family planning among
married women varies by region. Modern method
use ranges from a low of 1% in Somali to a high
of 50% in Addis Ababa. Modern family planning
use increases with wealth; 20% of women from the          Modern Method Use by Region
poorest households use a modern method of family      Percent of married women age 15-49 using any
planning, compared to 47% of women from the                modern method of family planning
wealthiest households.
                                                                    Tigray                 35
The use of any method of family planning by married                               12
                                                                      Affar
women has increased more than fourfold from 8% in
2000 to 36% in 2016. Similarly, modern method use                 Amhara                        47
has increased fivefold from 6% to 35% during the                  Oromiya              28
same time period.
                                                                    Somali    1
           Trends in Family Planning Use              Benishangul-Gumuz                28
           Percent of married women age 15-49
                                                                   SNNPR                    40
                  using family planning
                                                                 Gambela                   35
  50
                                                                    Harari             29
  40
                              Any method                      Addis Ababa                       50
  30
                                                                Dire Dawa              29
  20                          Any modern method
                                                                  Ethiopia                 35
  10

       2000        2005        2011         2016
       EDHS        EDHS        EDHS         EDHS

2016 Ethiopia Demographic and Health Survey                                                           Page 5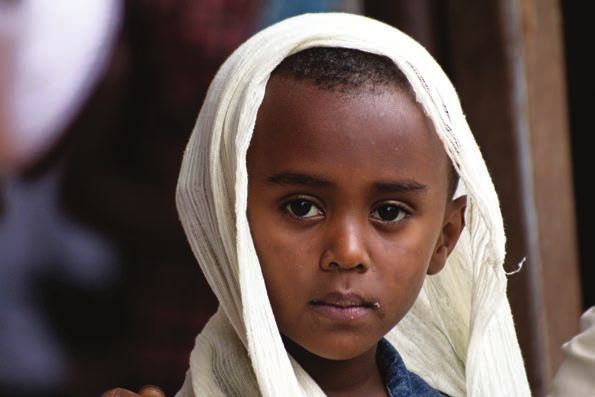
Demand for Family Planning                               Exposure to Family Planning Messages
More than one-third of married women (35%) want          The most common media source of family planning
to delay childbearing (delay first birth or space        messages is the radio. One-quarter of women and
another birth) for at least two years. Additionally,     one-third of men heard a family planning message
24% of married women do not want any more                on the radio in the few months before the survey.
children. Women who want to delay or stop                Women and men were much less likely to have
childbearing are said to have a demand for family        seen a family planning message on television or in
planning. The total demand for family planning           a newspaper/magazine. Overall, 46% of women
among married women in Ethiopia is 58%.                  and 40% of men have not been exposed to family
                                                         planning messages via any media source.
The total demand for family planning includes both
met and unmet need. Met need is the contraceptive        Informed Choice
prevalence rate. In Ethiopia, 36% of married women       Family planning clients should be informed about
use any family planning method.                          the side effects of the method used, what to do if they
                                                         experience side effects, and told about other available
Unmet Need for Family Planning
                                                         family planning methods. Less than half of current
Unmet need for family planning is defined as the         users of modern contraceptive methods (46%) were
proportion of married women who want to delay or         informed of possible side effects or problems of their
stop childbearing but are not using family planning.     method, 36% were informed about what to do if they
More than 1 in 5 married women in Ethiopia have an       experience side effects, and 56% were informed of
unmet need for family planning: 13% want to delay        other available family planning methods. Overall, 3
childbearing, while 9% want to stop childbearing.        in 10 women were informed of all three.
Demand for Family Planning Satisfied by
Modern Methods
Demand satisfied by modern methods measures
the extent to which women who want to delay or
stop childbearing are actually using modern family
planning methods. Sixty-one percent of the demand
for family planning in Ethiopia is satisfied by modern
methods. Both total demand for family planning and
demand satisfied by modern methods have increased
since 2000.

       Trends in Demand for Family Planning                     © 2013 Sarah V. Harlan/JHUCCP, Courtesy of Photoshare
         Among married women age 15-49, percent
           with demand for family planning and
           demand satisfied by modern methods
 100
  80
  60      Total demand

  40                          Demand satisfied by
  20                          modern methods

       2000        2005        2011        2016
       EDHS        EDHS        EDHS        EDHS

Page 6                                                            2016 Ethiopia Demographic and Health Survey
Childhood Mortality
Rates and Trends
Infant and under-5 mortality rates for the five-year
period before the survey are 48 and 67 deaths per
1,000 live births, respectively. At these mortality
levels, 1 in every 15 Ethiopian children does not
survive to their fifth birthday.

Childhood mortality rates have declined since 2000.
Infant mortality has decreased from 97 deaths per
1,000 live births in 2000 to 48 in 2016. During the
same time period, under-5 mortality has markedly
declined from 166 to 67 deaths per 1,000 live births.
                                                                       © 2014 Nicole M. Melancon, Courtesy of Photoshare

            Trends in Childhood Mortality                 Birth Intervals
            Deaths per 1,000 live births for the
             five-year period before the survey           Spacing children at least 36 months apart reduces
  180     Under-5 mortality                               the risk of infant death. The median birth interval
                                                          in Ethiopia is 34.5 months. Infants born less than
  150
                                                          two years after a previous birth have high under-5
  120
          Infant mortality                                mortality rates. Under-5 mortality is dramatically
   90                                                     higher among children born less than two years after
   60     Neonatal mortality                              a previous birth (114 deaths per 1,000 live births) than
                                                          among children born three years after a previous
   30
                                                          birth (44 deaths per 1,000 live births). Overall, 22%
        2000        2005          2011             2016   of children are born less than two years after their
        EDHS        EDHS          EDHS             EDHS   siblings.

Mortality Rates by Background
Characteristics
The under-5 mortality rate differs by residence and        Under-5 Mortality by Previous Birth Interval
region for the ten-year period before the survey.                     Deaths per 1,000 live births for the
                                                                      ten-year period before the survey
Children in rural areas are more likely to die young
(83 deaths per 1,000 live births) than children in
                                                                114
urban areas (66 deaths per 1,000 live births). Under-5
mortality also varies by region, from 39 deaths per                            78
1,000 live births in Addis Ababa to 125 deaths per
                                                                                                             55
1,000 live births in Affar.                                                                  44
Maternal Health
Antenatal Care                                                                       Trends in Maternal Health Care
More than 6 in 10 women (62%) age 15-49 receive                           Percent of live births in the five years before the survey
antenatal care (ANC) from a skilled provider*
                                                                       100
(doctor, nurse, midwife, health officer, and health
                                                                         80
extension worker). The timing and quality of ANC
are also important. One in five women has their first                    60
ANC visit in the first trimester, as recommended.                        40        ANC by skilled provider*
One-third of women make four or more ANC visits.
                                                                         20        Health facility delivery
Only 42% of women take iron tablets during
pregnancy. Almost half (49%) of women’s most                                    2000             2005            2011      2016
                                                                                EDHS             EDHS            EDHS      EDHS
recent births are protected against neonatal tetanus.
                                                                              *% of women for most recent live birth
Among women who received ANC for their most
recent birth, 75% had their blood pressure measured,
73% had a blood sample taken, 66% had a urine
sample taken, and 66% had nutritional counseling.

Delivery and Postnatal Care
Only 26% of births occur in a health facility, primarily
in public sector facilities. However, 73% of births
occur at home. Women with more than secondary
education and those in the wealthiest households are
more likely to deliver at a health facility. Only 5%
of births in 2000 were delivered in a health facility,
compared to 26% in 2016.

Overall, 28% of births are assisted by a skilled
provider*, the majority by nurses/midwives. Most
births are delivered by unskilled traditional birth
                                                                                        © 2016 Mulugeta Wolde for Maternity Foundation,
attendants (42%). Women in urban areas (80%),                                                                    Courtesy of Photoshare
those with more than secondary education (93%),
and those living in the wealthiest households (70%)
                                                                     Pregnancy-related Mortality
are most likely to receive delivery assistance from a
skilled provider. Skilled assistance during delivery                 The 2016 EDHS asked women about deaths of their
has increased from 6% in 2000 to 28% in 2016.                        sisters to determine pregnancy-related mortality.
                                                                     Pregnancy-related mortality includes deaths of
Postnatal care helps prevent complications after                     women during pregnancy, delivery, and two months
childbirth. Only 17% of women age 15-49 receive a                    after delivery, irrespective of the cause of death.
postnatal check within two days of delivery, while                   The pregnancy-related mortality ratio (PRMR) for
81% did not have a postnatal check within 41 days of                 Ethiopia is 412 deaths per 100,000 live births for the
delivery. Merely 13% of newborns receive a postnatal                 seven-year period before the survey. The confidence
check within two days of birth.                                      interval for the 2016 PRMR ranges from 273 to 551
                                                                     deaths per 100,000 live births. The 2016 EDHS PRMR
                                                                     estimate is significantly different from the 2011 EDHS
                                                                     estimate of 676 deaths per 100,000 live births.

* The definition of a skilled provider for 2000, 2005, and 2011 EDHS surveys includes doctor, nurse, and midwife. The 2016 EDHS skilled
provider definition includes doctor, nurse, midwife, health officer, and health extension worker.

Page 8                                                                              2016 Ethiopia Demographic and Health Survey
Child Health
Vaccination Coverage Childhood Illnesses
Nearly 4 in 10 children age 12-23 months have In the two weeks before the survey, 7% of children
received all eight basic vaccinations—one dose under five were ill with cough and rapid breathing,
each of BCG and measles and three doses each of symptoms of acute respiratory infection (ARI).
DPT-HepB-Hib and polio vaccine. Urban children Among these children, 31% sought treatment or
are more likely to have received all eight basic advice.
vaccinations than rural children (65% vs. 35%). Basic
Fourteen percent of children under five had fever in
vaccination coverage is lowest in Affar (15%) and
the two weeks before the survey. Of these children,
highest in Addis Ababa (89%). Basic vaccination
35% sought treatment or advice. Treatment seeking
coverage has more than doubled since 2000 when
for recent fever is low among children from the
14% of children had received all basic vaccinations.
poorest households (24%) and high among children
from the wealthiest households (51%).
Vaccination Coverage
Percent of children age 12-23 months vaccinated More than 1 in 10 children under five had diarrhoea
at any time before the survey in the two weeks before the survey. Diarrhoea was
most common among children age 6-11 months
81
69 73 72 (23%). Forty-four percent of children under five with
65
53 56 54 diarrhoea sought treatment or advice. Children with
39 diarrhoea should drink more fluids, particularly
through oral rehydration therapy (ORT). While 46%
16
of children under five with diarrhoea received ORT,
38% received no treatment.
BCG 1 2 3 1 2 3 Measles All None
basic
DPT-HepB-Hib Polio
Basic Vaccination Coverage by Region
Percent of children age 12-23 months who
received all basic vaccinations
Tigray 67
Affar 15
Amhara 46
Oromiya 25
Somali 22
© 2013 SC4CCM/JSI, Courtesy of Photoshare
Benishangul-Gumuz 57
SNNPR 47
Gambela 41
Harari 42
Addis Ababa 89
Dire Dawa 76
Ethiopia 39
2016 Ethiopia Demographic and Health Survey Page 9Feeding Practices and Supplementation
Breastfeeding and the Introduction of Vitamin A and Iron Supplementation
Complementary Foods Micronutrients are essential vitamins and minerals
Breastfeeding is very common in Ethiopia with 97% required for good health. Vitamin A, which prevents
of children ever breastfed. Almost three-quarters blindness and infection, is particularly important for
of children are breastfed within the first hour of children. In the 24 hours before the survey, 38% of
life. Only 8% of children who were ever breastfed children age 6-23 months ate foods rich in vitamin
received a prelacteal feed, though this is not A. Forty-five percent of children age 6-59 months
recommended. received a vitamin A supplement in the six months
prior to the survey.
WHO recommends that children receive nothing but
breastmilk (exclusive breastfeeding) for the first six Iron is essential for cognitive development in
months of life. Fifty-eight percent of children under children and low iron intake can contribute to
six months are exclusively breastfed. Children age anaemia. Twenty-two percent of children ate iron-
0-35 months breastfeed until a median of 23.9 months rich foods the day before the survey, while 9%
and are exclusively breastfed for 3.1 months. received an iron supplement in the week before the
survey. Pregnant women should take iron tablets
Complementary foods should be introduced when for at least 90 days during pregnancy to prevent
a child is six months old to reduce the risk of anaemia and other complications. Only 5% of women
malnutrition. In Ethiopia, 56% of children age 6-8 took iron tablets for at least 90 days during their last
months are breastfed and receive complementary pregnancy.
foods.
Use of Iodised Salt
Iodine is an important micronutrient for physical and
mental development. Fortification of salt with iodine
is the most common method of preventing iodine
deficiency. Nine in ten households in Ethiopia have
iodised salt.
© 2013 SC4CCM/JSI, Courtesy of Photoshare
Page 10 2016 Ethiopia Demographic and Health SurveyNutritional Status
Children’s Nutritional Status Women and Men’s Nutritional Status
The 2016 EDHS measures children’s nutritional status The 2016 EDHS also took weight and height
by comparing height and weight measurements measurements of women and men age 15–49.
against an international reference standard. Nearly Overall, 22% of women are thin (body mass index
4 in 10 (38%) of children under five in Ethiopia are or BMI < 18.5). Comparatively, 8% of women are
stunted, or too short for their age. Stunting is an overweight or obese (BMI ≥ 25.0). Women in urban
indication of chronic undernutrition. Stunting is more households are five times as likely to be overweight
common in Amhara (46%) and less common in Addis or obese than rural women (21% vs. 4%). Since 2000,
Ababa (15%). Children from the poorest households overweight or obesity has increased from 3% to 8% in
(45%) and whose mothers have no education (42%) 2016.
are more likely to be stunted.
Among men, one-third are thin (BMI < 18.5) and only
Overall, 10% of children are wasted (too thin for 3% are overweight or obese (BMI ≥ 25.0). Men with
height), a sign of acute malnutrition. In addition, more than secondary education (14%) and those from
24% of children are underweight, or too thin for their the wealthiest households (10%) are more likely to be
age. The nutritional status of Ethiopian children overweight or obese. Since 2011, thinness among men
has improved since 2000. In 2000, more than half of has slightly declined from 37% to 33%.
children under five were stunted compared to 38% in
2016. Anaemia
The 2016 EDHS tested children age 6-59 months,
Trends in Childhood’s Nutritional Status women age 15-49, and men age 15-49 for anaemia.
Percent of children under five, Overall, 57% of children age 6-59 months are
based on 2006 WHO Child Growth Standards anaemic. Anaemia is more common in children
100
from the poorest households (68%) and those
80 whose mothers have no education (58%). Anaemia
60 Stunted in children has increased since 2011 when 44% of
Underweight children were anaemic.
40
20 Wasted One-quarter of women age 15-49 in Ethiopia are
anaemic. Comparatively, 15% of men are anaemic.
2000 2005 2011 2016 Since 2005, anaemia among women has slightly
EDHS EDHS EDHS EDHS decreased from 27% to 24% in 2016. Among men,
anaemia has slightly increased from 11% in 2011 to
15% in 2016.
Anaemia in Children, Women, and Men
Percent of children age 6-59 months, women
age 15-49, and men age 15-49 with anaemia
57
24
15
Children Women Men
2016 Ethiopia Demographic and Health Survey Page 11HIV Knowledge, Attitudes, and Behaviour
Knowledge of HIV Prevention Methods Multiple Sexual Partners
Half of women and 69% of men know that the risk Having multiple sexual partners increases the risk
of getting HIV can be reduced by using condoms of contracting HIV and other sexually transmitted
and limiting sex to one monogamous, uninfected infections (STIs). Less than 1% of women and 3% of
partner. Knowledge of HIV prevention methods is men had two or more sexual partners in the past 12
highest among women and men from the wealthiest months. Among women and men who had two or
households and those with more than secondary more partners in the past year, 20% of women and
education. 19% of men reported using a condom at last sexual
intercourse. Men in Ethiopia have 1.3 more sexual
Knowledge of Prevention of Mother-to-Child partners in their lifetime than women (2.9 versus 1.6).
Transmission (PMTCT)
More than half of women and men know that HIV Male Circumcision
can be transmitted during pregnancy, delivery, and Nine in ten men in Ethiopia are circumcised. Male
by breastfeeding. Half of women and 61% of men circumcision ranges from 72% in Gambela to 99% in
know that HIV transmission can be reduced by the Affar, Somali, Harari, and Dire Dawa. Young men
mother taking special medication. age 15-19 are less likely to be circumcised than older
men age 30-49 (86% vs. 94%)
HIV Testing
More than two-thirds of women (69%) and 84% of
Knowledge of HIV Prevention Methods
men know where to get an HIV test. Four in ten
Percent of women and men age 15-49 who know that
the risk of HIV transmission can be reduced by: women and 43% of men have ever been tested for
Women HIV and received the results. However, 56% of
Men women and 55% of men have never been tested for
HIV. Within the past 12 months, 1 in 5 women and
58
Using condoms men have been tested and received the results. HIV
77
testing has slightly increased since 2011 when 36% of
women and 38% of men were ever tested for HIV and
Limiting sex to one 69 received the results. Nineteen percent of pregnant
uninfected partner 81 women with a live birth in the last two years received
HIV testing and counseling and received the results
49 during an ANC visit.
Both
69
Knowledge of PMTCT Trends in HIV Testing
Percent of women and men age 15-49 who know that: Percent of women and men age 15-49 who were ever
tested for HIV and received their results
Women
Men 2005 EDHS 2011 EDHS 2016 EDHS
HIV can be transmitted 57
during pregnancy, delivery,
and by breastfeeding 55
Transmission can be 43
51 36 40 38
reduced by mother taking
special drugs 61
2 5
Women Men
Page 12 2016 Ethiopia Demographic and Health SurveyWomen’s Empowerment
Employment Participation in Household Decisions
Nearly half of married women (48%) were employed The 2016 EDHS asked married women about their
at any time in the past 12 months compared to 99% participation in three types of household decisions:
of married men. Working women and men are her own health care, making major household
likely to not be paid for their work (49% and 53%, purchases, and visits to family or relatives. Married
respectively). Only 35% of working women and 23% women in Ethiopia are most likely to have sole or
of men are paid in cash. Sixty-two percent of married joint decision making power about visiting family or
women who are employed and earned cash made relatives (84%) and their own health care (81%) and
joint decisions with their husband on how to spend less likely to make decisions about major household
their earnings. Overall, 58% of working women purchases (78%). Overall, 71% of married women
reported earning less than their husband. participate in all three decisions. Since 2005, married
women’s participation in decision making has
Ownership of Assets steadily improved.
Among both women and men, half own a home
alone or jointly. Women are less likely than men to
Trends in Women’s Participation
own land alone or jointly (40% vs. 48%).
in Decision Making
In Ethiopia, 15% of women and 25% of men use a Percent of women age 15-49 who usually make specific
bank account. More than one-quarter of women and decisions by themselves or jointly with their husband
55% of men own a mobile phone. Among mobile 2005 EDHS 2011 EDHS 2016 EDHS
phone owners, only 5% of women and 9% of men use
the phone for financial transactions. 81 84
74 78 78 78
66 66 71
Problems in Accessing Health Care 57 54
45
Seven in 10 women report at least one problem
accessing health care for themselves. More than
half of women are concerned about getting money
for treatment, while half are concerned about the Own Major Visits to All 3
distance to the health facility. Forty-two percent health household family or decisions
do not want to go alone to the health facility, while care purchases friends
32% are worried about getting permission to go for
treatment.
© 2013 Wallace Mawire, Courtesy of Photoshare
2016 Ethiopia Demographic and Health Survey Page 13Domestic Violence
Attitudes toward Wife Beating Spousal Violence
Sixty-three percent of women and 28% of men agree More than one-third of ever-married women have
that a husband is justified in beating his wife for at experienced spousal violence, whether physical
least one of the following reasons: if she burns the or sexual or emotional. Twenty-seven percent of
food, argues with him, goes out without telling him, ever-married women report having experienced
neglects the children, or refuses to have sex with spousal violence within the past year. Spousal
him. Both women and men are most likely to agree violence is highest among ever-married women who
that wife beating is justified if the wife neglects the are divorced/separated/widowed (44%), with no
children (48% and 19%, respectively). education (36%), and those from the Oromiya region
(38%).
Experience of Physical Violence
Nearly one-quarter of women (23%) have ever
Spousal Violence
experienced physical violence since age 15. In the
Percent of ever-married women who have experienced
past year, 15% of women have experienced physical
the following types of spousal violence
violence. The most common perpetrator of physical
Ever Past 12 months
violence among ever-married women is a current
husband/partner (68%). Among never married
women, the most common perpetrator of physical
violence is a sister/brother (27%).
Experience of Sexual Violence 34
24 20 24 26 27
One in ten women have ever experienced sexual 17 20
10 8
violence; 7% have experienced sexual violence in the
past year. Divorced/separated/widowed women Emotional Physical Sexual Physical Physical,
are most at risk (18%) compared to never married or sexual sexual, or
emotional
women (2%). The most common perpetrator of sexual
violence among ever-married women is a current
husband/partner (69%).
Help Seeking Behaviour
More than 1 in 5 women who have experienced
physical or sexual violence sought help to stop the
violence. The most common sources of help for these
women are their neighbour (34%) or own family
(31%).
Page 14 2016 Ethiopia Demographic and Health SurveyFemale Genital Mutilation/Cutting
Female Genital Mutilation/Cutting (FGM/C) Female Genital Mutilation/Cutting by Region
Nearly all women and men have heard of FGM/C in Percent of women age 15-49 who are circumcised
Ethiopia. Knowledge of FGM/C steadily increases
Tigray 24
with increased levels of education.
Affar 91
In Ethiopia, 65% of women have been circumcised.
Amhara 62
Among these women, the most common type of
FGM/C involves the cutting and removal of flesh Oromiya 76
(73%). FGM/C is more common among women from
Somali 99
rural areas (68%) than urban areas (54%). Regionally,
FGM/C is least common in Tigray (24%) and Benishangul-Gumuz 63
Gambela (33%) and more common in Affar (91%) and SNNPR 62
Somali (99%). FGM/C has declined since 2000 from
Gambela 33
80% of women in 2000 to 74% in 2005 to the current
level of 65% in 2016. Harari 82
Addis Ababa 54
In Ethiopia, FGM/C is performed throughout
childhood. Women are most likely to report Dire Dawa 75
circumcision occurred before age 5 (49%), while 22% 65
Ethiopia
are circumcised between age 5-9, 18% age 10-14, and
6% age 15 or older.
FGM/C among Girls
Women interviewed in the 2016 EDHS who had Trends in Female Genital Mutilation/Cutting
daughters under age 15 were asked if their daughters Percent of women age 15-49 who are circumcised
are circumcised. Overall, 16% of girls under age 15
are circumcised. FGM/C is more common among 80
74
girls in rural areas (17%), whose mothers have no 65
education (17%), and whose mothers are circumcised
(20%).
Attitudes toward FGM/C
One-quarter of women and 17% of men believe that 2000 2005 2016
FGM/C is required by their religion. Overall, 79% EDHS EDHS EDHS
of women and 87% of men believe that the practice
should not be continued.
Age at Female Genital Mutilation/Cutting
Percent distribution of women age 15-49
who are circumcised by age at circumcision
Don’t know
6%
Age 15+
6%
AgeIndicators
Residence
Fertility Ethiopia Urban Rural
Total fertility rate (number of children per woman) 4.6 2.3 5.2
Median age at first birth for women age 25-49 (years) 19.2 21.6 18.9
Women age 15-19 who are mothers or currently pregnant (%) 13 5 15
Family Planning (among married women age 15-49)
Current use of any method of family planning (%) 36 52 33
Current use of a modern method of family planning (%) 35 50 32
Unmet need for family planning2 (%) 22 11 25
Demand satisfied by modern methods (%) 61 79 57
Maternal Health (among women age 15-49)
ANC visit with a skilled provider3 (%) 62 90 58
Births delivered in a health facility (%) 26 79 20
Births assisted by a skilled provider (%) 3
28 80 21
Child Health (among children age 12-23 months)
Children who have received all basic vaccinations4 (%) 39 65 35
Nutrition
Children under five who are stunted (moderate or severe) (%) 38 25 40
Women age 15-49 who are overweight or obese (%) 8 21 4
Men age 15-49 who are overweight or obese (%) 3 12 1
Prevalence of any anaemia among children age 6-59 months (%) 57 49 58
Prevalence of any anaemia among women age 15-49 (%) 24 17 25
Prevalence of any anaemia among men age 15-49 (%) 15 7 16
Childhood Mortality (deaths per 1,000 live births)5
Neonatal mortality 29 41 38
Infant mortality 48 54 62
Under-five mortality 67 66 83
HIV/AIDS
Women age 15-49 who know that HIV can be prevent by using condoms and
limiting sexual intercourse to one uninfected partner (%) 49 69 43
Men age 15-49 who know that HIV can be prevent by using condoms and
limiting sexual intercourse to one uninfected partner (%) 69 74 67
Women age 15-49 who have ever been tested for HIV and received the results (%) 40 68 32
Men age 15-49 who have ever been tested for HIV and received the results (%) 43 65 37
Domestic Violence (among women age 15-49)
Women who have ever experienced physical violence since age 15 (%) 23 21 24
Ever-married women who have ever experienced spousal physical, sexual, or emo-
tional violence (%) 34 28 35
1
a = Omitted because less than 50% of respondents had sexual intercourse for the first time before reaching the beginning of the age group. 2Currently married women who
do not want any more children or want to wait at least two years before their next birth but are not currently using a method of family planning. 3Skilled provider includes
doctor, nurse, midwife, health officer, and health extension worker. 4Basic vaccinations include BCG, measles, three doses each of DPT-HepB-Hib and polio vaccine (excluding
polio vaccine given at birth). 5Figures are for the ten-year period before the survey except for the national rate, in italics, which represents the five-year period before the
survey.Region
Benishangul- Addis Dire
Tigray Affar Amhara Oromiya Somali Gumuz SNNPR Gambela Harari Ababa Dawa
4.7 5.5 3.7 5.4 7.2 4.4 4.4 3.5 4.1 1.8 3.1
19.2 18.6 18.8 18.8 20.0 18.4 19.5 19.2 20.4 a 1
20.3
12 23 8 17 19 14 11 16 17 3 13
36 12 47 29 2 29 40 35 30 56 30
35 12 47 28 1 28 40 35 29 50 29
18 17 17 29 13 21 21 23 21 11 19
65 40 72 49 10 57 65 60 58 75 59
90 51 67 51 44 69 69 72 76 97 87
57 15 27 19 18 26 26 45 50 97 56
59 16 28 20 20 29 29 47 51 97 57
67 15 46 25 22 57 47 41 42 89 76
39 41 46 37 27 43 39 24 32 15 40
6 8 3 7 15 7 6 9 20 29 22
3 5 1 3 3 3 2 4 9 20 9
54 75 42 66 83 43 50 56 68 49 72
20 45 17 27 60 19 23 26 28 16 30
17 24 14 16 21 11 14 10 14 5 16
34 38 47 37 41 35 35 36 34 18 36
43 81 67 60 67 62 65 56 57 28 67
59 125 85 79 94 98 88 88 72 39 93
66 31 52 46 10 33 44 44 47 73 46
84 72 76 66 38 68 62 69 62 77 65
62 38 49 28 13 44 37 58 54 72 61
56 50 53 33 15 47 41 62 31 71 60
25 16 24 28 6 18 17 25 25 23 20
33 20 35 38 9 32 29 34 37 26 29You can also read