Euroclear Investments SA Debt investor presentation

Page created by Bruce Knight
 
CONTINUE READING
Euroclear Investments SA Debt investor presentation
Euroclear Investments SA
Debt investor presentation

November 2016
Euroclear Investments SA Debt investor presentation
Disclaimer
This presentation is not a prospectus or offering memorandum and investors should not subscribe for or purchase any securities referred to in this presentation except on the basis of information in
the prospectus. The information, statements and opinions expressed in this presentation (the “Content”) do not constitute and shall not be deemed to constitute: (i) any offer, invitation or
inducement to sell a security or engage in investment, financial or other similar activity; or (ii) a solicitation of an offer to buy any security; or (iii) any recommendation or advice in relation to any
investment, financial or other decision. Persons considering making any investment or financial decision should contact their qualified financial adviser. The Content may include forward looking
statements, in particular, in relation to future events, growth, future financial performance, plans, strategies, expectations, aims, prospects, competitive environment, regulation and
supply and demand. Words such as “anticipates”, “believes”, “estimates”, “expects”, “intends”, “plans”, “projects”, “may” and similar expressions are used to identify these forward-
looking statements. Such statements contain inherent risks and uncertainties and actual outcomes may differ materially from those expressed or implied by forward looking
statements. To the maximum extent permitted by law, no warranty or representation (express or implied) including, but not limited to, accuracy or completeness is made in relation to the Content,
including, but not limited to, any projections or statements about the prospects of Euroclear. Any forward-looking statement contained in this presentation speaks only as of the date of this
presentation. Euroclear makes no commitment to update Content and expressly disclaims, to the extent lawful, liability for any errors or omissions in it. This presentation is confidential and is being
submitted to selected recipients only and may not be reproduced (in whole or in part), distributed or transmitted to any other person without the prior written consent of Euroclear. The Content is not
directed at, or intended for distribution to, or use by any person or entity where such distribution or use is restricted by law or regulation. Persons into whose possession the Content comes should
inform themselves about and observe any such restrictions. In particular this presentation is not intended for distribution in the United States or to U.S. persons (as defined in Regulation S) under
the United States Securities Act of 1933, as amended. In the United Kingdom this presentation is being made only to and is directed only at persons who have professional experience in matters
relating to investments who fall within Article 19(1) of the Financial Services and Markets Act 2000 (Financial Promotion) Order 2005 (the “Order”) and other persons to whom it may otherwise
lawfully be communicated in accordance with the Order. Past performance, historic financial information and/or historic distributions should not be taken as an indication of current or future
performance, results or distributions.

                                                                                                                                                                                                               2
Executive Summary

Terms of the offering                                                Credit rating
• Offering size: €600mm issued by Euroclear Investments SA           • Issuer Ratings: AA-/AA (S&P/Fitch)

• Euro denominated, Senior, Unsecured with a maturity of 10          • Expected Issue Ratings: AA-/AA (S&P/Fitch)
  years
• Fixed rate coupon payable annually

Transaction rationale                                                Business overview
• Provide incremental investment capacity to fund potential future   • Established in 1968, Euroclear is a leading central securities
  projects                                                             depository providing post-trade services
• Provide financial flexibility in light of changing regulatory      • Provides settlement and related securities services for cross-
  landscape and new capital requirements for central securities        border transactions involving domestic and international bonds,
  depositories                                                         equities, derivatives and investment funds
                                                                     • Offers transaction settlement, asset servicing and collateral
                                                                       management services

                                                                                                                                         3
Content

Euroclear at a glance: business & strategy

Group consolidated financial performance

Transaction rationale & key features

                                             4
Euroclear at a glance

• Trusted provider and leader in post-trade services to the global
  financial markets                                                                   6 CSDs*
                                                                                      serving 7 markets
• More than 40 years of existence                                                     Euroclear Belgium
                                                                                      Euroclear Finland
                                                                                      Euroclear France
• Mission to assist our diversified client base to:                                   Euroclear Nederland
   - Ensure securities transactions are processed safely and efficiently              Euroclear Sweden
                                                                                      Euroclear UK & Ireland
   - Reduce complexity, lower costs and mitigate risks

• Open and resilient market infrastructure operating under strong
                                                                                        +
  regulatory oversight
• Strong AA-ratings: AA/AA+ (S&P/Fitch) for Euroclear Bank and AA-/AA                 1 ICSD**
                                                                                      Euroclear Bank
  (S&P/Fitch) for Euroclear Investments SA                                            Gateway to the world
                                                                                      > 900,000
• Governed by a client-led board with stable predominantly client                     securities
  shareholders base.

(*) Central Securities Depository, (**) International Central Securities Depository
                                                                                                               5
A leading position in a highly fragmented market

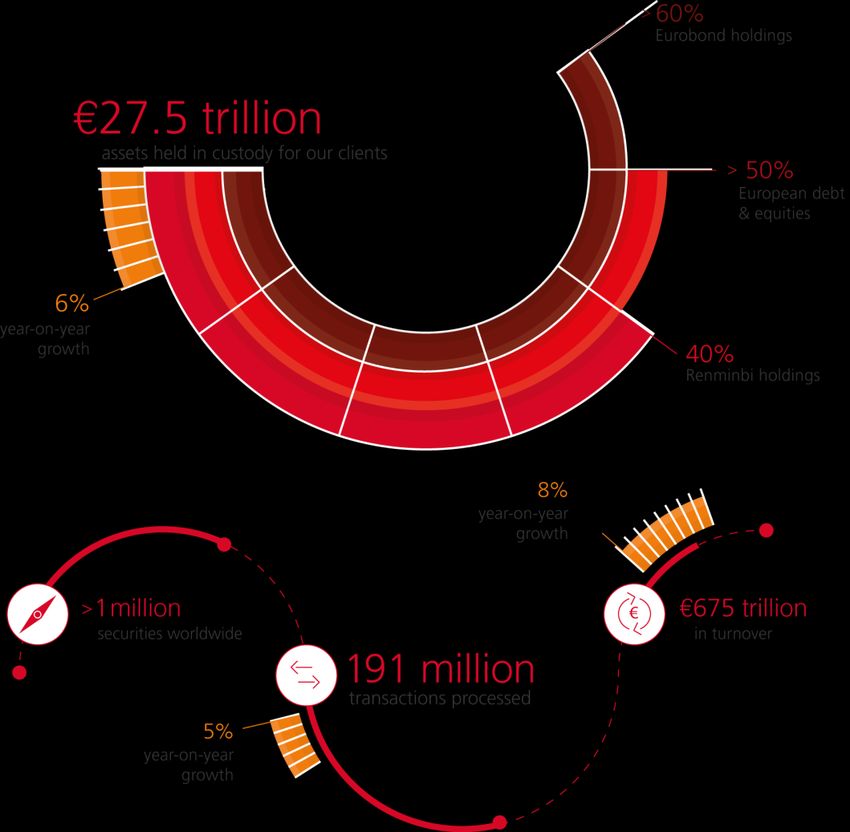
• Market leader with €27.5 trillion assets under custody
                                                                   Key figures
   end 2015                                                        (end 2015)
• We offer a global service:
   - To clients in over 90 countries
   - In 16 languages
   - Across 46 major markets
   - In 51 settlement currencies

• Our international client franchise includes:
   - Over 2,000 clients
   - Over 100 central banks
   - 90% of the world’s 50 largest banks

• Robust regulatory framework as a financial market
   infrastructure, with high levels of capitalization and strong
   credit ratings.

Source: Euroclear Plc 2015 Annual Report
                                                                                 6
Combining our values and client needs to generate
business growth

Euroclear strategy

Euroclear values                               Client needs
• Openness                                     • Efficiency
• Profit moderated
                                     +         • Regulation /
                                                                                          =
• For the public good                              resilience
                                               • Global / local

We continue to invest in capabilities and innovative business
solutions that help clients improve operating efficiency, strengthen
market stability and mitigate risk

(*) “Euroclearability” is the creation of access to developing markets that might otherwise have limited access to global participants
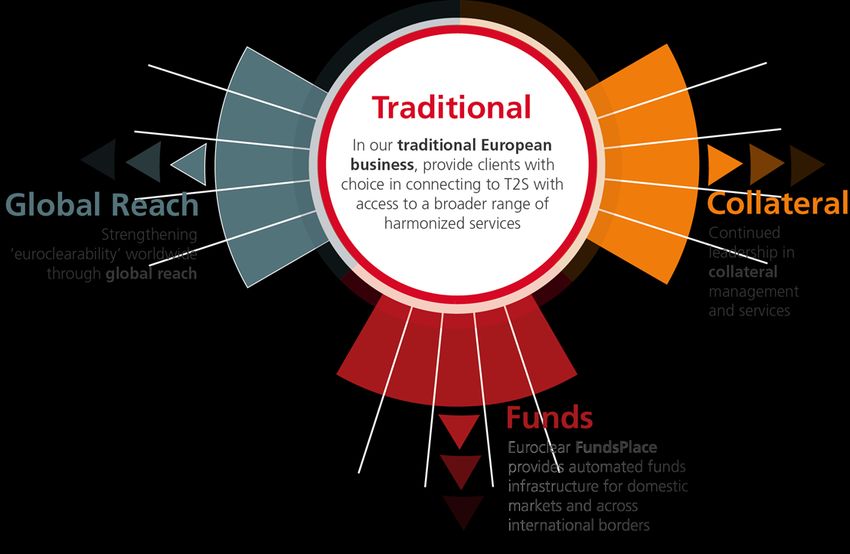
                                                                                                                                         7
A well established and resilient traditional business

Main activities
• Issuance & settlement
    - Fast, efficient, low risk processing of securities
    - Direct access to the broadest range of investors across multiple jurisdictions
    - Leader in automation and delivery-versus-payment settlement that ensures that cash and securities exchange hands simultaneously
    - Remunerated via a fee per instruction

• Asset servicing
    - Covers all steps in the life cycle of a security
    - From distribution of a new issue to timely and accurate custody-related services
    - Automates complex corporate actions while improving efficiency and reducing risks
    - Remunerated via a yearly fee based on the asset value

Recent investments
• Euronext participation
    - Euroclear acquired a stake in Euronext (8%) as part of a group of reference shareholders in June 2014
    - This investment provides the group closer proximity to its user community, strengthening its Euroclear Settlement for Euronext-zone
      Securities (ESES) franchise, and its future in delivering Issuer and Investor CSD services

• Target 2 Securities (T2S)
    - Euroclear invested materially in this ECB project to create a new, centralized European securities settlement engine
    - As leading place of issuance and liquidity access in T2S markets, Euroclear is the natural point of entry to T2S, offering flexible
      access to all the markets that will settle through the T2S platform
    - In September 2016, the Group has brought T2S project to fruition, with settlement activity for Euroclear’s ESES CSDs in Belgium,
      France and the Netherlands migrating to the T2S platform in September. Euroclear Finland’s CSD will migrate in late 2017

                                                                                                                                            8
Continued momentum in collateral management leadership

Collateral Management services help clients to optimise returns on their assets                               CSDs
                                                                                                                                       Agent
and manage their risks effectively
• Euroclear’s Collateral Highway
    - World’s first open architecture global infrastructure for collateral
                                                                                                                                        Custodians
         management
                                                                                                                      CCPSs*
       - Neutral, inter-operable, venue-agnostic utility
       - Source & mobilise collateral across geographical borders and time zones

• GlobalCollateral
                                                                                                                      Central banks
    - Joint venture with DTCC, launched in September 2014                                Collateral
                                                                                                                                                     Banks

    - Seeks to deliver operating efficiencies to clients & improve the stability and     Facilitation

          soundness of global financial markets
       - First solutions with the DTCC JV have been launched in September 2016

2015                                                                                          Average daily collateral outstanding
                                                                                              € billion
                                                                                                                               1,068
           • Daily collateral outstandings grew by 20%                                                               887
                                                                                                        787
               y.o.y in 2015                                                                     701
                                                                                       503

                                                                                       2011     2012    2013     2014          2015

Source: Euroclear Plc consolidated figures as of year-end 2015
(*) Central counterparties                                                                                                                                   9
The place for funds

Introducing our global fund solution – Euroclear FundsPlace:
• Single access point to cross-border, offshore and domestic funds
                                                                                                         Our FundSettle
• Expanding network of funds markets, and links to over 900 fund administrators                          International service
                                                                                                         supports both buy and
                                                                                                         sell sides of fund
• Automated trade and post-trade processing solutions for order routing, settlement, and                 distribution, providing
   asset servicing                                                                                       automated order routing,
                                                                                                         settlement and asset
                                                                                                         servicing

                                                                                           €1.7 trillion of funds
                                                                                           under custody and
                                                                                           12.7 million fund

2015                                                                                       orders routed
                                                                                           annually

           • Fund assets under custody up 13% in 2015

           • Traction in growth of international ETF                                                    FundSettle
               structure                                                                                processes 90,000
                                                                                                        funds and connects
                                                                                                        with 900 fund
                                                                                                        administrators
                                                                                                        worldwide

Source: Euroclear Plc consolidated figures as of year-end 2015
                                                                                                                                    10
Global Reach supports growth economies’ expansion
and stability through “Euroclearability”

• Euroclear has a long track record working with growth markets beyond Europe to help strengthen their capital
  markets infrastructure and connect their issuers with international investors
• Continued success in bringing “Euroclearability” to domestic capital markets

• Partnering with governments to develop their regulation and capital market practices to meet the needs of
  global investors, and enhance their stability and cost of funding
• Increasing breadth of domestic securities available for settlement through our links to local CSDs

2015

      • “Euroclearability” is now a criteria for inclusion in
         several emerging market bond indices

                                                                                                                 11
The regulatory reforms are intensifying on all forms
of trading and post-trading activities

                                                                     EU CSD                       Target 2                      Other
                                                                     Regulation                   Securities                    regulations

                                                                     • Definitions of CSD         • Single Settlement System    • Recovery & Resolution
     Financial stability                                               activities of commercial     for “euro” Central Bank       regimes for banks/FMIs
          Safety                                                       bank money settlement        Money DVP settlement
                                                                                                                                • MREL and bail-in
                                                                     • Capital & liquidity
                                                                                                                                • Basel III (LCR, Leverage,
                                                                                                                                  NSFR)

                                                                     • Dematerialisation          • Settlement and Corporate    • Capital Markets Union
   Cross-border efficiency                                                                          Actions                       (integration of Europe’s
                                                                     • T+2 settlement                                             capital markets)
      Harmonisation                                                                               • Market practices
                                                                     • Settlement Discipline

                                                                                                                                • MiFIR/EMIR access between
                                                                                                                                  trading venues, CCPs and
                                                                     • Allowing EU CSDs to        • CSDs incentivised to          CSDs
                                                                       compete on a consistent      move ‘up the value chain’
     EU Single Market                                                                                                           • Securities Financing
                                                                       regulatory playing field
       Competition                                                                                                                Transaction Regulation
                                                                     • CSD passport                                               (Transparency)
      Consolidation
                                                                     • Freedom of choice
                                                                       for issuers

• Euroclear is well advanced with its CSDR implementation (entry into force around end 2017), launched T2S in September 2016 for the ESES
  market and is securing T2S delivery for Finland (2017)
• Besides investments to comply with regulatory changes, no major impact expected on the group financial strength (no additional funding
  required)
• Euroclear is well positioned to take advantage of business opportunities resulting from EU regulation which will reinforce the role of market
  infrastructures

                                                                                                                                                              12
Euroclear’s leadership team

              Marc Antoine Autheman                                    Tim Howell                                             Lieve Mostrey
              Chairman of the Board of Directors                       Chief Executive Officer;                               Chief Technology and Services
              of Euroclear Plc and Euroclear                           Mr Howell will step down on 1                          Officer; Chief Executive Officer
              SA/NV                                                    January 2017                                           Designate

              Frederic Hannequart                                      Bernard Frenay                                         Jo Van de Velde
              Chief Business Officer of the                            Chief Financial Officer                                Head of Product Management
              Euroclear Group

              Valérie Urbain                                           Yves Poullet                                           Peter Sneyers
              Chief Executive Officer,                                 Head of Corporate Technology                           Chief Risk Officer
              Euroclear Bank

Referenced from Fitch report on Euroclear Bank (October 2016)
“Euroclear Bank risk profile and risk appetite are very low. Management has a high degree of depth and relevant expertise for the bank specialized business.
Euroclear Bank has a strong corporate culture with high risk awareness.”
                                                                                                                                                                 13
Content

Euroclear at a glance: business & strategy

Group consolidated financial performance

Transaction rationale & key features

                                             14
Group financial performance highlights

           Leading operator in global post-trade sector, ideally positioned to benefit
    1      from changing operating and regulatory environment

     2     A resilient, stable and well diversified business

     3     Improving efficiency resulting in higher operating profit and profitability

           Disciplined and dynamic risk management framework with resilient risk
    4      profile, solid capitalisation and limited leverage

    5      Preserving strong capital levels

                                                                                         15
Our business: financial performance in 2015
underpinned by solid operational momentum

                             Assets under custody grew by 6% to €27.5 trillion in 2015
         +6%

         +8%                Turnover increased by 8% to €674.7 trillion in 2015

         +5%                 Volume of settlement grew by 5% to 190.7 million netted transactions

                             Collateral mobilised daily grew by 20% with approx €1,068 billion in average
      +20%                   daily outstandings in 2015

      +13%                   Group-wide Fund orders routed up 13% to 12.7 million

Source:
Euroclear Plc consolidated figures as of year-end 2015
                                                                                                            16
2015 resilient financial performance, confirmed end Q2 2016

€ million                                                  Q2 2016 YTD                   Q2 2015 YTD       Y-o-Y   2015 FY   2014 FY      Y-o-Y

Net fee and commission income                                            490                        502     -2%       983       924         6%

Net interest income                                                        60                        53     12%        99        90         9%

Other operating income                                                     26                        27     -1%        49        26        89%

Operating Income                                                         576                        582     -1%      1,130     1,040        9%

Administrative expenses                                                 -362                        -351     3%       -723      -680        6%

Share of result in joint venture                                           -5                         -2   115%         -7        -1        n/m

Operating profit before tax                                              208                        228     -9%       401       359        12%

Taxation and other                                                        -62                        -64    -3%       -108       -78       38%

Profit for the period                                                    147                        164    -11%       293       281         4%

Earnings per share                                                      45.5                        48.8    -7%       87.0      78.6       11%

Dividend per share                                                                                                    36.3      31.5       15%

• 2015 Performance driven by increased activity across business lines and continued cost discipline, despite investment in regulatory-
   driven initiatives
• Euroclear’s revenue performance in the first half of 2016 was, as expected, adversely impacted by more challenging financial market conditions
   and less favourable foreign exchange rates

Source:
Euroclear Plc consolidated figures as of year-end 2015
Abridged, unaudited consolidated interim financial statements of Euroclear plc as of 30 June 2016                                                  17
Strong and resilient revenue base driven by market volumes
       and competitiveness

               Securities held in custody                          Value and volume of securities                                           Net fee income
               € trillion equivalent, year-end                     transactions settled                                                     € million
                                                                   € trillion equivalent
                                                                                                 +7%           250.0

                                   +6%            1,000.0                                                                                                      +6%
                                                                                                 +5%   191
                                                                                           182                 200.0
                                                                              170                                 1,200
                                           27.5             163
                                                   800.0            159                                                                                              983
                                26.0                                                                   675        1,000                                 924
                                                                                           634                 150.0          864    874    877
                    24.2                                    581               573
        23.0                                       600.0            542                                                 800
22.1
                                                                                                               100.0600
                                                   400.0
                                                                                                                        400
                                                                                                               50.0
                                                   200.0
                                                                                                                        200

                                                       -                                                       -          0
2011    2012        2013       2014        2015             2011    2012     2013      2014            2015                   2011   2012   2013        2014         2015
                                                                                     Value of securities transactions
                                                                                     settled (EUR trillion)
                                                                                     Number of transactions after
                                                                                     netting (million)

       • Securities under custody increased to €27.5 trillion, a record year-end level

       • Revenue increased by 6% to reach €983 million

       Source: Euroclear Plc 2015 Annual Report
                                                                                                                                                                            18
Strong financial discipline and operating efficiencies driving
       improvements on unit cost

                               Operating expenses                                                Unit cost
                               € million                                                         Operating expenses compared to the average
                                                                                                 value of the securities held for the year in b.p.

                                                        +6%
710                                                           723
                683                               680                        0.35     0.32                                           -7%
                               661
                                                                                                0.30
                                                                             0.30                          0.28        0.27       0.26
                                                                             0.25

                                                                             0.20

                                                                             0.15

                                                                             0.10

                                                                             0.05

                                                                             0.00
2011           2012            2013           2014            2015                   2011       2012       2013       2014        2015

               •   Operating expenses increased as a result of regulatory projects (c. 4%) and business as usual (c. 2%)
               •   Further increase in spread between net fee income and operating expenses, reflecting capacity to contain costs while
                   fueling business volume growth

       Source: Euroclear Plc 2015 Annual Report
                                                                                                                                                     19
Strong operating profit growth

                                         Operating profit before tax and net fee income margin
                                         € million
                                                                                      +12%
                                                                                                                     50%
                                                                                                  401
                                                                                                                     45%
                                                                             359
                                                      326                                                            40%
 294                        296                                                                                      35%
                                                                               36%                   36%
                                                          33%                                                        30%
                                                                                                                           Referenced from Fitch report on Euroclear Bank
                               28%                                                                                   25%   (October 2016):
22%                                                                                                                  20%   “The bank franchise is sufficiently strong and diversified to
         113                                                                                                         15%   generate sound profitability while maintaining their current low
                                    88                                              90                    99               risk profile”
                                                               85
                                                                                                                     10%
                                                                                                                     5%
                                                                                                                     0%
  2011                         2012                      2013                  2014                  2015
                                                            Operating profit                 Net interest earnings
                                                            Net fee income margin

                                     • Operating profit growth with less dependency on interest income

                                     • Margin remains stable despite investment pressure

       Source: Euroclear Plc consolidated figures as of year-end 2015
                                                                                                                                                                                              20
Strong and progressive earnings generation capacity

                           Return on equity                                                                            Earnings per share
                                                                                                                       €/share
                                                           8.9%*                                                                           +11%
                                          8.7%                                         100.0
                                                                                        90.0                                                      87.0
                                                            8.7%
                                                                                                                                    78.6
                         8.3%                                                           80.0
                                                                                                                      69.3
                                                                                        70.0             63.0
                                                                                                  57.8
                                                                                        60.0
        7.8%                                                                            50.0
.6%                                                                                     40.0
                                                                                        30.0
                                                                                        20.0
                                                                                        10.0
                                                                                         0.0
011     2012             2013             2014             2015                                   2011   2012         2013         2014           2015

                 • ROE is stable while EPS growth maintains                                                     Referenced from Fitch report on Euroclear
                     momentum                                                                                   Bank (October 2016):
                 • Strong level in light of sizeable capital                                                    “The bank franchise is sufficiently strong and
                     requirement as a Financial Market Infrastructure                                           diversified to generate sound profitability while
                                                                                                                maintaining their current low risk profile”

      Source: Euroclear Plc 2015 Annual Report
      (*) Equity normalized excluding movements of the available for sale – revaluation reserve                                                                     21
Group cash flows demonstrate strong liquidity levels

• Debt proceeds will provide additional financial flexibility to the group

• Debt repayment can be funded with group operating cash flows,
   while distributions can be accommodated to secure repayment at maturity

Referenced from S&P report on Euroclear Bank (November 2015):
“Exceptional current liquidity position, aided by good cash flow generation and on-balance-sheet liquid assets”

                                                                                                                  22
Industry-leading Basel III capital and leverage ratio

           Capital ratio

           60%          Basel II regime                             Basel III regime           3,000

                                                                                                       Millions
                               47.7%
           50%                                                                                 2,500
                                                             39.2%                     40.0%
           40%                                                                                 2,000

           30%                                                                                 1,500

           20%                                                                                 1,000

           10%                                                                                 500

            0%                                                                                 0
                              2013                               2014                   2015
                             Total capital ratio                        Regulatory own funds

      • Strong Basel III fully loaded capital ratio of 40%, far above required levels

      • Decrease in 2014 due to Basel III implementation and higher credit exposure linked to financial participation

      • Capital ratios would remain around 40%, driven by group distribution policy

      • Strong and stable ratings reflect our performance and market position

      • Self-financing of the EU CSD regulation implications

      • Leverage ratios will remain very moderate post issuance (no leverage at end 2015)

Source: Euroclear Plc consolidated figures as of year-end 2015
* Same as Tier 1 capital ratio                                                                                          23
3 main types of risk in our activities

                                                    Mitigation approaches

Risks                                               Specific                                                        General

Operational risks                                   • New product approval, control self assessment, escalation     • Relationship management:
                                                      procedures, issue tracking                                        - Choice of counterparties
People (incl. fraud), systems (cyber), processes,
                                                                                                                          (clients, depositories, etc.)
external events                                     • Business continuity policies
                                                                                                                        - Due diligence and
                                                    • Large insurance coverage                                            service-level monitoring
                                                                                                                          for all key service providers

Credit risks                                        • Close to 99% secured and very short term                      • Strong capital level

Intra-day credit to facilitate settlement           • Sound legal protection re collateral appropriation            • Strong regulatory oversight
                                                                                                                      across entities (incl. capital &
                                                                                                                      recovery planning)

Market & liquidity risks                            • Large portfolio of short term liquidity sources
                                                      (incl. very secure & largely pledge-able own treasury book)
• No trading activity
• Important intraday liquidity needs                • Hedging of material & relevant cash flow exposures in
                                                      foreign currencies
                                                    • Liquidity-contingency plans

                                                                                                                                                          24
Group operational risks are managed strongly
• Low operational risk profile of Euroclear Bank and group          Risk Weighted Assets – operational risk & loss history
   CSDs is demonstrated by its loss history, as very few loss
   cases were observed over the past 10-year period
                                                                     2.50%                                                                   400
• Strong commitment, dedicated resources and adequate
                                                                                                                                             350
   insurance policies to ensure business continuity and              2.00%
                                                                                                                                             300
   operational risk management
                                                                     1.50%                                                                   250
• Scenario analysis is used to assess operational risks at very
                                                                                                                                             200
   high confidence levels, combining internal loss history and
                                                                     1.00%                                                                   150
   external loss data
                                                                                                                                             100
• Implementation of Lean management philosophy in 2008-              0.50%
                                                                                                                                             50
   2009 (together with other measures) reduced operational risks
                                                                     0.00%                                                                   0
• 3 data centres provide business continuity (2 synchronous in                      2013                 2014                 2015
   France, 1 in Belgium – asynchronous but enabling resumption of                RWA - operational risks (€ million)
   business critical services within same business day)                          Operational losses / operating profit before taxation (%)
• 4 operational centers for business continuity (2 in Belgium, 1
   in Poland, 1 in Hong-Kong)

Referenced from Fitch report on Euroclear Bank                      Referenced from S&P report on Euroclear Bank
(October 2016):                                                     (November 2015):

“Risk controls are very strong and investments in risk management   “Strong risk-management controls and track record of very low
are a management priority. To date, the track record of avoiding    losses arising from operational and credit risks.”
operational losses has been strong.”

Source: Euroclear Plc consolidated figures as of year-end 2015
                                                                                                                                                   25
A conservative approach to credit risk

Clients credit exposures                                                              Risk Weighted Assets – credit risk
• Close to 99% of credit to clients is extended on a very short term and
   secured basis                                                                      30

• More than 98% of secured credit is granted to investment grade                      25
   clients & is backed by investment grade collateral
                                                                                      20
• Close to 99.9% of unsecured credit is granted to investment grade
   clients and predominantly Central Banks & Supranationals                           15

                                                                           Billions
                                                                                      10
Treasury credit exposures
                                                                                       5
• Treasury exposures arise principally from cash balances left on
   account by Euroclear Bank’s clients (c. €18 billion end 2015)                       0
                                                                                                   2013                     2014   2015
• The largest part of treasury exposure is engaged on an overnight
                                                                                           Total assets   RWA credit risk
   basis
• More than 85% of treasury activity is conducted on a secured basis

• Treasury counterparts (secured & unsecured) are all rated investment
   grade and predominantly A- minimum

                         Due to very conservative credit risk
                        policies, Risk Weighted Assets (RWA)
                         only represent a very low fraction of
                               total group assets (
Financial assets portfolio: liquidity risk carefully managed

According to group investment policies, group own cash is invested:

• In AA/AAA government or supranational EUR-denominated and ECB eligible securities, with very short
  term maturities for Euroclear Bank

• In EUR term deposits or similar products with maturity not exceeding 3 years for all other entities of the
  group (incl. CSDs):

    - Counterparts have ratings in A range at least

    - Strong investment granularity: largest investment in one counterpart may represent only up to 10% of the
      group regulatory capital

                                                                                                                 27
Content

Euroclear at a glance: business & strategy

Group consolidated financial performance

Transaction rationale & key features

                                             28
Rationale for the transaction
Debt issue of €600 million is for general corporate purposes and aims to:
•   Maintain the level of incremental investment capacity
•   Preserve optionality in a changing environment
•   Provide additional financial flexibility
•   Strengthen the capacity for recovery purposes in operating entities
•   Benefit from the current low interest rates opportunity and strong AA- /AA ratings (Euroclear Investments SA)

The group has a strong capital ratio policy and aims to preserving suitable cash levels in view of:
• Factors requiring capacity retention in operating entities
    - New capital requirements for CSDs under CSDR
    - Maintain current capital level in the Bank with volume growth and business complexity

• Cash investment in financial, tangible and intangible assets

                                                                                                                    29
Transaction structure: corporate issue at holding level

                                                                                              Shareholders
                                                                                                                                                                            Operating income by entity
                                                                                          147 shareholders 85%
                                                                                          Sicovam Holding 15%                                                                                EC Finland &
                                                                                                                                                                                              EC Sweden
                                                                                                         CH                                                                    EC France, EC      6%
                                                                                                                                                                              Netherlands &
                                                                                                                                                                                 EC Belgium
                                                                                              Euroclear Plc                                                                          11%
Consolidated oversight by the National Bank of Belgium

                                                                                                                                                                             EC Ireland & EC
                                                                                                         100% - LUX                                                                 UK
                                                                                                                                                                                    9%
                                                                                                                                S&P: AA-/A-1+
                                                                                     Euroclear Investments SA                   Fitch: AA/F1+                                    Other
                                                                                                                                                                                  1%
                                                                                                                                                                                                                                    EC Bank
                                                                                                                                                                                                                                     73%
                                                                                                           100% (- 1 share) - BE

                                                                                             Euroclear SA/NV
                                                                                                                                                 Other entities
                                                                               100% (- 1 share)                       100%                       • Euroclear Properties
                                                                                                                                                   France SA
                                                                                      (BE)                    (FR, BE, NL, UK, F, S)
                                                                                                                                                 • Euroclear
                                                                                                                                                                            Total assets by entity
                                                                                                      50%
                                                                                                                                                   Reinsurance              € million
                                                                                                       UK
                                                                                                                                                                            25,000

                                                                                                                                                                            20,000
                                                                 Euroclear
                                                                                                  DEGCL*                           CSDs                                     15,000
                                                                Bank SA/NV
                                                                                                                                                                            10,000
                                                                 S&P: AA/A-1+
                                                                                                                                                                             5,000
                                                                 Fitch: AA+/F1+
                                                                                                                                                                                0

                                                                         Directly supervised activity by National Bank of                       Not directly regulated by      Euroclear Plc                   Euroclear Investments SA
                                                                                Belgium and other local regulators                              National Bank of Belgium       Euroclear SA/NV                 Euroclear Bank SA/NV
                                                                                                                                                                               CDS's, DEGCL & other entities

                                                  Source: Euroclear Plc consolidated figures as of year-end 2015
                                                  * DTTC Euroclear Global Collateral Limited                                                                                                                                                  30
Strong credit ratings for both issuer and instrument

                                     Euroclear Investments SA       New issue ratings               Euroclear Bank
Rating agency
                                         (“the Issuer”) ratings            (expected)                       ratings

S&P                                                  AA- / A-1+             AA- / A-1+                       AA / A-1+

Fitch                                                 AA / F1+               AA / F1+                        AA+ / F1+

Both rating agencies rated the issuer and the projected new issue one notch lower than Euroclear Bank, which is
mainly due to Euroclear Investments SA:
• Being a non operating holding company, and

• Not directly supervised by the group regulator (NBB)

Rationale for strong issuer credit rating:
• Projected leverage and cash flow ratios remain consistent with minimal financial risk profile assessment

•   Euroclear group will maintain its:
     - Low risk profile
     - Satisfactory underlying profitability
     - Strong capitalisation
     - Leading position in its business

• Strong capacity to service the debt issue

                                                                                                                         31
Euroclear Investments SA’s stand-alone strong
historical performance

Income statement                                                                               Balance sheet
€ million                                                                                      € million

                                                                   2015        2014    2013                                      2015   2014   2013

Net interest income / expenses                                          0.2      0.2     0.0   Cash & cash equivalent             16     28     28

Other income                                                            1.1      0.9     0.7   Loans and advance                   5      –      –

Dividend income                                                    212.2       251.1   232.1   Other assets and accrued income     1      1      0

Operating income                                                   213.5       252.2   232.8   Participations in group company   589    581    581

Operating expenses                                                      -1.4    -1.3    -0.8   Total assets                      611    610    610
of which costs of debt issue                                                                   Long-term debt                      –      –      –

Operating profit                                                   212.0       251.0   232.0   Other liabilities                   1      0      0

Tax                                                                       0       0       0    Shareholders’ equity              610    610    610

Net profit                                                         212.0       250.9   232.1   Total liabilities                 611    610    610

• Cash flows and P&L are mainly driven by recurring dividend upstreaming (between €150-250 million per year)

• End 2015, assets are mainly made of financial participations (€590 million) and cash at banks and loans (€20 million)

• Performance is expected to remain stable in the coming years (€150-200 million profit generated per year)

Source: Euroclear Investments SA figures as of year-end 2015 and 2014
                                                                                                                                                      32
Key features of the contemplated transaction

Issuer                                 Euroclear Investments SA

Format*                                Senior, Unsecured, Global Notes, RegS Bearer

Issuer Ratings                         AA-/AA (S&P/Fitch)

Expected Issue Ratings                 AA-/AA (S&P/Fitch)

Currency                               EUR

Amount                                 600,000,000

Maturity                               10 years

Type of coupon                         Fixed rate payable annually

Documentation *                        Standalone prospectus - Make-whole redemption, Negative Pledge

Use of proceeds                        General corporate purposes

Denominations                          EUR 100,000 + 100,000

Listing                                Euronext Amsterdam

Law                                    English law

(* ) See full prospectus for details
                                                                                                        33
Summary
Euroclear's robust financial performance:
• Strong 2015 results reflecting resilience of business model (confirmed with end Q2 2016 results)

• Operating model can absorb higher volumes of activity with limited increase in costs

• Conservative balance-sheet and capital strategy confirmed / reinforced in 2015

Rationale for debt issuance in Euroclear:
• €600 million senior debt issuance to improve financial flexibility in an evolving operating and regulatory environment

• Repayment at maturity thanks to strong cash flow generation capacity

• Euroclear does not intend to become a frequent issuer

Euroclear capital and leverage position will remain extremely solid post issuance:
• Target 35-40% fully loaded Tier 1 ratio and very low leverage profile

• Strong cash flow capacity

                                                                                                                           34
Lieve Mostrey                    Bernard Frenay
Chief Technology and Services    Group Chief Financial Officer
Officer; CEO Designate
                                 T + 32 2 326 23 06
T +32 2 326 1843                 F + 32 2 326 14 49
lieve.mostrey@euroclear.com      bernard.frenay@euroclear.com

Martine Deroanne                 Baudhuin Douxchamps
Head of Corporate Finance        Corporate Finance Director
T + 32 2 326 12 08               T + 32 2 326 94 70
F + 32 2 326 14 49               F + 32 2 326 14 49
martine.deroanne@euroclear.com   baudhuin.douxchamps@euroclear.com

euroclear.com
You can also read