EUROPEAN AVIATION IN 2040 - CHALLENGES OF GROWTH - Eurocontrol
←
→
Page content transcription
If your browser does not render page correctly, please read the page content below
EUROCONTROL

      EUROPEAN
AVIATION IN 2040
CHALLENGES OF GROWTH
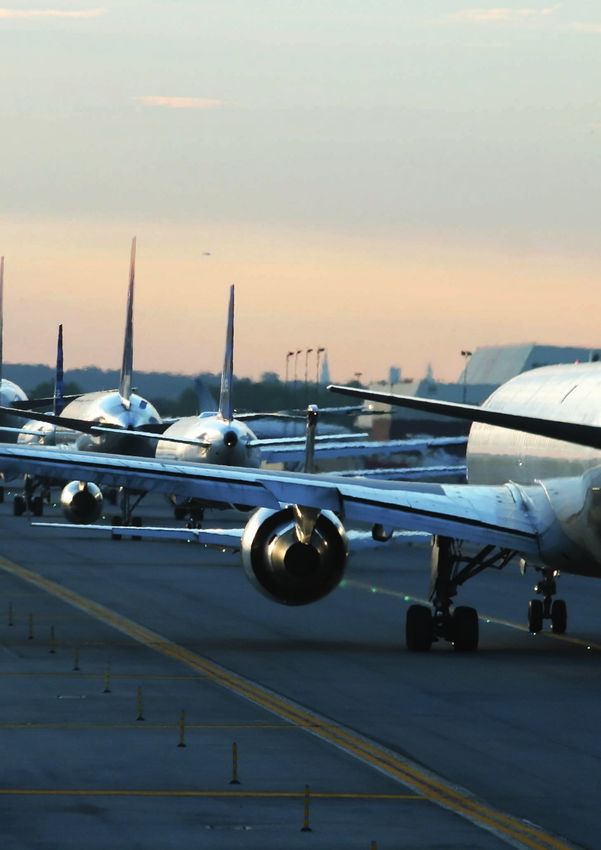
FLIGHTS
          IN 2040
 HIGH
19.5M
         16.2M
+84%
         +53%                              CAPACITY
          1.9%/year                        PLANS
          CAPACITY                          +16%                         +28%
                                                                         TOP20
          GAP 2040 FLIGHTS
                   111 AIRPORTS

          1.5M
          FLIGHTS      HIGH
          8% OF DEMAND 3.7M
          160M PEOPLE 16%

        / / / / / / / / / / / / / / / / /////////////////////////////////////// / / / / / / / / / / / /
03

        SUMMARY
        The Challenges of Growth studies aim to deliver the best-achievable
        information to support long-term planning for aviation in Europe.
        EUROCONTROL has previously published four Challenges studies, in
        2001, 2004, 2008 and 2013. This report summarises airport capacity
        challenges identified in the fifth study, Challenges of Growth 2018 (CG18),
        which tackles the following question:

        What are the challenges of growth for commercial aviation in Europe
        between now and 2040?

        Recent variability in traffic has re-emphasised the need to consider a range of possible futures, in order
        to manage risks. After a stakeholder review, we have defined four scenarios, each describing a different
        future:

        n   Global Growth: Strong global growth with technology used to mitigate sustainability challenges;
        n   Regulation and Growth (Most-Likely): moderate growth regulated to reconcile demand with
            sustainability issues;
        n   Fragmenting World: a World of increasing tensions and reduced globalisation;
        n   Happy Localism: like Regulation and Growth, but with a fragile Europe increasingly, and contentedly,
            looking inwards.

        The most-likely scenario is Regulation and Growth. However, we see a number of long-term risks that
        would lead to higher growth, and thus we also give particular attention to Global Growth.

        By 2040, traffic in Europe is expected to grow to just over 16 million flights in Regulation and Growth, and
        close to 20 million in Global Growth. This is a total growth of 53% (Regulation and Growth) and 84% (Global
        Growth) compared to 2017.

        This is rather slower growth than before 2008. Indeed, over the 20 years before the economic crisis, the
        number of flights in Europe doubled from 5 million IFR movements in 1988 to 10 million in 2008. Overall,
        the future deceleration in growth is explained by slower rates of economic growth, increasing fuel prices
        and increasing congestion at airports.

        We now collect airport capacity data around the clock, for operations as well as long-term studies like
        this one. After cutting back between 2008 and 2013, airports are expanding their capacity plans again,
        with 111 airports planning a 16% increase in capacity between them, 4 million more runway movements.
        This growth is focused on the top 20 airports, who are planning growth of 28%, or 2.4 million runway
        movements.

        These airport capacity expansion plans, even if they can be delivered, are not sufficient. Plans are better
        focused than they were in 2013, with more expansion where we predict more traffic growth. Even so, by
        2040 there will be 1.5M flights more in demand than can be accommodated, 8% of demand in Regulation
        and Growth. That is 160 million passengers unable to fly. The gap is spread across 17 States. In Global
        Growth, the gap is 3.7M and 16% of demand.

// / / / // / / //////////// / / / / / / / / / / / / / / / / / /////////////////////////////
04 / EUROPEAN AVIATION IN 2040 - CHALLENGES OF GROWTH

                                            2040
                                            SUMMER
                                            DELAY           CLOSING
                          HIGH
                             45
                         +370%
                                            20 28%
                                             mins/flight
                                                            THE GAP

                                                            if deploy
                                                                           HIGH
                                                                           14%

                                             +63%           SESAR Wave 1

                                            CONGESTED       NEED TO ADAPT
                                             AIRPORTS

                                          16  vs. 6 in 28
                                              Summer 2016
                                                            HIGH
05

Even with 1.5M flights unaccommodated and therefore lost, the network remains highly
congested. The number of 'Heathrow-like' airports operating near capacity for much of the
day climbs from 6 in Summer 2016 to 16 in 2040, or even 28 in Global Growth. We have
modelled delays from all causes, and find that in the Summer, these would jump from
12 minutes to 20 minutes per flight in 2040. In particular, the number of flights delayed
by 1-2 hours increases by a factor of 7, which means around 470,000 passengers each day
delayed by 1-2 hours in 2040, compared to around 50,000 today.

Closing the capacity gap is a task for airports, providing more infrastructure, but also for
airlines, regulators and others. Taking a cue from how Industry has responded in the past,
we modelled six different mitigations, apart from new runways. Of these mitigations, the
most promising are the developments under SESAR Wave 1, which target busy airports at
peak hours. These developments could reduce the most-likely capacity gap by 28% in 2040,
if they can be successfully deployed.

The climate is changing. Over the medium and long term, there will be changes to
temperatures, to rain, snow, wind and storm patterns and in the sea level. This will affect
aviation infrastructure, patterns of demand and daily operations. An updated and enlarged
survey shows that the European aviation industry recognises that these challenges
are coming. But there has been little change over the last five years in the proportion of
organisations actually planning for adaptation to climate change impacts. This is a risk that
needs further investigation.

There will be many more unmanned aircraft systems (UAS) or 'drones' by 2040. Most of these
will operate outside current IFR airspace, but this will put pressure to cede parts of current
controlled airspace. Within controlled airspace, 2017 saw about 6 flights/day. By 2040 the
main effect will be to replace existing operations with 'optionally piloted' ones. On top of
this transformation, we see further growth of about 100 flights/day.

In summary, we see three key challenges for 2040:

n   Delivering current airport capacity plans is already a challenge, but they will fall 1.5M
    flights short of demand. More capacity is needed at airports in 17 different States.

n   Even with 1.5M flights lost to the capacity gap, a typical Summer day in 2040 will have
    16 airports as congested as Heathrow is now. That will push total network delays to an
    average of 20 minutes per flight. It will be a challenge to provide an adequate quality of
    service, day in, day out in these circumstances.

n   Climate change will damage aviation infrastructure, alter patterns of passenger demand,
    and lead to more disruption of daily operations. Industry recognises the need for
    adaptation, but only half of organisations have begun to plan.

/ /////////// / / / / / / / / / / / / / / / / //////////////////
06 / EUROPEAN AVIATION IN 2040 - CHALLENGES OF GROWTH

                         / / / / / / / / / / / / / / / / / / ////////////////////////////////////// / / / / / / / / / / /
07

                   Summary			                                                           03

                   A foundation for planning to 2040                                    09

                   Looking ahead, bounding the risks                                    11

                         Return to growth		                                             11

                         Four scenarios, four possible futures                          14

                         Airport capacity: stable, and better focused                   16

                   Measuring and Mitigating Growth                                      19

                         Slow flight growth to 2040                                     19

                         Drones: more outside controlled airspace than inside           23

                         Airport capacity plans are not enough                          24

                         Increasing congestion means severe delays                      26

                         Mitigation – more airport capacity by a variety of means       28

                         Adapting to climate change needs long-term planning            30

                   The Main Challenges		                                                33

                   Annexes			                                                           34

                   A.    Comparison with previous Challenges Studies                    34

                   B.    Glossary		                                                     35

                   C.    References		                                                   36

// / / /// / / /////////// / / / / / / / / / / / / / / / / / / /////////////////////////////
08 / EUROPEAN AVIATION IN 2040 - CHALLENGES OF GROWTH

/ / / ////////// / / / / / / / / / / / / / / / / / / / ////////////////////////////////////// / / / / / / / / / / /

09

         A FOUNDATION
         FOR PLANNING TO 2040
         The Challenges of Growth studies aim to deliver the best-achievable
         information to support long-term planning for aviation in Europe.
         EUROCONTROL has completed four Challenges studies, in 2001, 2004,
         2008 and 2013 (Ref. 1, 2 ,3 4). This report summarises the fifth study,
         Challenges of Growth 2018 (CG18), which tackles the following question:
         What are the challenges of growth for commercial aviation in Europe1
         between now and 2040?

         This summary report is complemented by more              ACKNOWLEDGEMENTS
         detailed, technical reports:
                                                                  The Challenges of Growth project team is grateful
         n   The forecast of flights to 2040 and the effects of   to the many in the industry who made the
             capacity constraints at airports are discussed in    time to support the project with information
             detail in Ref. 6.                                    and informed comments, directly or through
                                                                  questionnaires. In particular, DG MOVE and ACI
         n   In Ref. 9 we report on the impact of this lack of    EUROPE provided expert encouragement and
             capacity in terms of congestion and delays.          advice, and members of the STATFOR User Group
                                                                  helped to review and refine the scenarios. Thank
         n   In the mitigation report (Ref. 5), we look at ways   you.
             to mitigate the lack of capacity, starting with
             building more airport capacity, but also how to      The project was a collaboration between a
             use differently what capacity there is.              number of teams in EUROCONTROL: the Airport
                                                                  unit provided the airport expertise and led the
         Later in 2018 we will publish a report on                data collection, STATFOR led the forecasting and
         environmental issues (Ref. 12) providing: a forecast     mitigation work, GIS provided the cartography,
         of CO2 emissions and how aviation is reducing its        the environment experts of the Policy unit led
         impact; and how prepared European aviation is to         the work on climate adaptation and emissions
         adapt to climate change.                                 modelling, the Network unit developed and ran
                                                                  the methods to evaluate the impact of delays on
                                                                  the network, while the Master Plan unit helped
                                                                  with the SESAR benefits.

                                                                                                                      1- Unless otherwise
                                                                                                                      specified, 'Europe'
                                                                                                                      refers to the
                                                                                                                      airspace of the
                                                                                                                      European Civil
                                                                                                                      Aviation Conference
                                                                                                                      (ECAC) States. See
                                                                                                                      Glossary for a map.

// / / /// / / /////////// / / / / / / / / / / / / / / /
10 / EUROPEAN AVIATION IN 2040 - CHALLENGES OF GROWTH

/ / / ////////// / / / / / / / / / / / / / / / / / / / ////////////////////////////////////// / / / / / / / / / / /
11

           LOOKING AHEAD,
           BOUNDING THE RISKS
           RETURN TO GROWTH
           Flight growth is back: 2017 saw broad-based, strong growth that finally
           took European flight counts above the 2008 peak.

           Five years ago, flights had just seen a double-dip          based traffic growth in 2017 across all market
           decline and were still 5% below the 2008 peak.              segments finally took European flight totals over
           So there seemed a need to reassure readers of               the 2008 peak, to 10.6 million. Indeed, even 4%
           the Challenges of Growth 2013 (CG13) summary                growth in flights in 2017 looks modest compared
           report (Ref. 4, p8) that, when economic growth              to almost twice that reported for passengers
           returned, so would growth in air traffic.                   or passenger-km. Current growth is certainly
                                                                       supported by strong demand. This growth has
           It has taken a while to get here, but today the             brought traffic back to the most-likely scenario
           situation looks rather different; strong and broad-         from the 2013 forecast (Figure 1).

             Figure 1 / In 2017, strong growth saw traffic back on the most-likely scenario from the 2013 forecast
                                   18

                                   17     CG13 Global Growth
                                          CG13 Regulation and Growth
        IFR movements (Millions)

                                   16

                                   15     CG13 Fragmenting World
                                          CG13 Happy Localism
                                   14
                                          Actual
                                   13

                                   12

                                   11

                                   10

                                   9

                                   8
                                        2005
                                        2006
                                        2007
                                        2008
                                        2009
                                        2010
                                        2011
                                        2012
                                        2013
                                        2014
                                        2015
                                        2016
                                        2017
                                        2018
                                        2019
                                        2020
                                        2021
                                        2022
                                        2023
                                        2024
                                        2025

                                                                                                       2030

                                                                                                                     2035

             The supply side is also healthier than in recent          Geographically, there has been particularly
             years: globally IATA has reported airlines                strong growth in arrival and departing flights for
             profitable for three years in a row, mostly in North      Greece and Iberia, including the Canary Islands, as
             America. Europe added to the total profit, even           tourism preferences continued to change, moving
             if there were some notable bankruptcies on this           at least temporarily away from Egypt, Tunisia and
             side of the Atlantic in late 2017. Significantly          to some extent Turkey. Overflight patterns have
             lower fuel prices have helped this profitability, as      also changed considerably in five years: Ukraine
             have record high load factors.                            has around 70% fewer overflights than in 2012,

// / / /// / / /////////// / / / / / / / / / / / / / / / / / / ////////////
12 / EUROPEAN AVIATION IN 2040 - CHALLENGES OF GROWTH
with neighbouring Moldova down 50%, after the essential for decision makers to take account of a
attack on flight MH17; flights have re-routed to range of different scenarios, that capture possible
the South, with Bulgaria, Romania and Turkey up ways in which Europe and European air traffic might
40-50%. develop.
Given this scale of change over just five years, Figure 2 explores some of the main trends, and
when looking ahead 20 years we believe it is different directions that these trends could easily go.
Figure 2 / Long-term trends and possible futures
Trend Upside: more flights Downside: fewer flights
Oil prices Rapid electrification of ground trans- Low investment in a declining oil
port leads the way to peak oil use. market leads to dwindling yields.
Prices fall as producers compete in a Scarcity drives up prices, though
contracting market. shale oil continues to provide a
ceiling.
Tourism Growing economies continue to drive
both European and in-bound tourism.
A more mobile, millennial generation
expects to travel more often, ie have a
higher propensity to fly.
Low-cost long-haul New aircraft types, new carriers and Higher oil prices, unattractively low
‘de-constructed’ fares increase the va- frequencies on thin markets and
riety and reduce the cost of long-haul much smaller price margins than
travel, boosting demand. possible in short-haul mean that
low-cost long-haul remains a niche
market.
Hubbing Growing large hubs within and beyond -
Europe drive growth in feeder flights as
well as long-haul flights and overflights.
Electrification New, hybrid kerosene-electric aircraft -
change the economics of the 30-70
seat market, creating new possibilities
for feeder and short-haul connectivity.
Drones, UAS Even in current controlled airspace, -
new business models emerge, for ex-
ample medium-haul, pilotless cargo.
Middle-class growth Expanding economies in Europe, Asia -
and elsewhere create a larger popula-
tion with more disposable income.
Globalisation Long-term trends for global, intercon- Populist attacks on free trade lead
nected industrial production and trade to slower growth in trade, reducing
in services increase the need for face- the need for business travel and
to-face meetings. transportation of goods. Fragmen-
tation, gloomier Brexit scenarios.
/ / / / / / / / / / / / / / / / /////////////////////////////////////// / / / / / / / / / / / /13
Five years ago, in addition to the baseline, However, from Figure 2 it is clear that there are
business-as-usual growth scenario, the a number of potential societal and business
discussion was about maturity of the market, transformations that have the potential to boost
and the downside risks. Now it is clear that, traffic over the long term, more so than there
even if scheduled aviation in Europe is reaching are long-term, down-side risks. Compared to the
its centenary, there is 'life in the old dog yet'. economic cycle, their potential effects are poorly
Economic growth is not forecast to be as strong in understood. Even if only a subset of the list - low-
the future as in the past, so this source of growth cost long-haul, hybrid short-haul, drones, Chinese
in demand will diminish, as Figure 3 shows. In middle-class travel, new hubs, new long-haul
2018, with oil prices rising, threats to increase aircraft – arrive in strength, the up-side risks are
trade barriers and economic growth faltering strong.
there are clearly also economic down-side risks;
some economists are suggesting we have reached
the top of the latest economic cycle.
Figure 3 / Economic and flight growth continue in tandem, but both are slowing.
5% 10%
4% 8%
3% 6%
2% 4%
EU GDP Growth
EU Flight Growth
1% 2%
0% 0%
1975 1980 1985 1990 1995 2000 2005 2010 2015 2020
-1% -2%
-2% -4%
-3% -6%
-4% -8%
-5% -10%
GDP Growth
Flight Growth
Linear (DGP Growth)
// / / / // / / //////////// / / / / / / / / / / / / / / / / / /////////////////////////////14 / EUROPEAN AVIATION IN 2040 - CHALLENGES OF GROWTH
FOUR SCENARIOS, FOUR POSSIBLE FUTURES
Recent variability in traffic has re-emphasised the need to consider a
range of possible futures, in order to manage risks. After a stakeholder
review, we have four scenarios, each describing a different future.
The most-likely scenario is Regulation and Growth. However, we see a
number of long-term risks that would lead to higher growth, and thus we
also give particular attention to the high-growth scenario Global Growth.
We produce forecasts to help decision makers This led to four possible futures (Figure 4), chosen so
manage risks. Looking 20 years ahead, or even that they bracket a range of outcomes in order to make
just looking to the swings of traffic over the last for robust planning.
five years, makes it clear that no single forecast
will capture the risks. So we have worked with n Global Growth: strong global economic growth
stakeholders to develop four scenarios. That with technology used to mitigate environmental
process started by identifying some principal challenges. This is a high growth scenario.
axes of uncertainty, which we captured as: n Regulation and Growth: moderate growth
regulated to reconcile demand with environmental
n How adaptable Europe is, either economically, sustainability issues. This is assessed to be the most
technologically or politically; likely of the four.
n Whether Europe is more or is less outward- n Happy Localism: like Regulation and Growth, but
looking. with a fragile Europe increasingly and contentedly,
looking inwards for trade and travel. In other words,
“small is beautiful”;
n Fragmenting World: a World of increasing tensions
Figure 4 / Four scenarios to manage the risks.
and reduced globalisation, as barriers to free trade
multiply.
Europe
adapts
We see Regulation and Growth as the most likely
scenario, but for CG18 we think that Global Growth also
GLOBAL needs close attention. As discussed in the previous
GROWTH
section, the recent return to traffic growth has been
vigorous, and there are newer growth drivers - long-
HIGH
haul, low-cost; new aircraft types; middle-class growth
in China; changes in propensity to fly; drones – all of
HAPPY
LOCALISM which are under-represented in our forecast models
Europe: Europe: because of their short histories. All four scenarios should
inward outward
perspective REGULATION perspective be considered as part of a balanced risk assessment, but
& GROWTH
in this report we will discuss the higher-growth Global
Growth scenario as a complement to the most-likely
MOST-LIKELY Regulation and Growth scenario.
FRAGMENTING The scenarios from CG13 were the starting point, and
WORLD
after consultation they were left structurally unchanged,
although the detail of the assumptions which define
them was adapted and updated. Figure 5 summarises
and compares these updated input assumptions for the
Europe
less four scenarios. Supporting background material and
adaptable
differences between the scenarios are covered in more
detail in the forecast report (Ref. 6).
// / / / / / / / / / / / / / / / / / / ////////////////////////////////////// / / / / / / / / / / / /15
Figure 5 / Summary of the input assumptions per scenario
Global Regulation Happy Fragmenting
Growth & Growth Localism World
2023 starting point at
High Base Base Low
end of 7-year forecast
Passengers
Aging Aging Aging Aging
Demographics
UN Medium-fertility UN Medium-fertility UN Medium-fertility UN Zero-migration
(Population)
variant variant variant variant
Routes and
Long-haul No Change Long-haul Long-haul
Destinations
EU enlargement later EU enlargement EU enlargement EU enlargement
Open Skies
+Far & Middle-East earliest earliest latest
High-speed rail 20 city-pairs 20 city-pairs 20 city-pairs
(new & improved faster 20 city-pairs faster later
connections) implementation implementation implementation
Economic conditions
GDP growth Stronger Moderate Weak Weaker
EU Enlargement +5 States, Later +5 States, Earliest +5 States, Earliest +5 States, Latest
More limited,
Free Trade Global, faster Limited, later None
even later
Price of travel
Operating cost Decreasing Decreasing Decreasing No change
Price of CO2 in
Emission Trading Moderate Lowest Lowest Highest
System
Price of oil/barrel Low Lowest Highest High
Change in Noise: Noise: Noise: Noise:
other charges Security: Security: Security: Security:
Structure
Hubs: Middle-East Hubs: Middle-East Hubs: Middle-East
Europe Turkey Europe & Turkey Europe & Turkey
Network No change
Point-to-Point: Point-to-Point: Point-to-Point:
N. Atlantic N. Atlantic N. Atlantic
Industry fleet Industry fleet Industry fleet Industry fleet
Market Structure forecast + STATFOR forecast + STATFOR forecast + STATFOR forecast + STATFOR
assumptions assumptions assumptions assumptions
// / / / // / / //////////// / / / / / / / / / / / / / / / / / ///16 / EUROPEAN AVIATION IN 2040 - CHALLENGES OF GROWTH
AIRPORT CAPACITY:
STABLE, AND BETTER FOCUSED
We now collect airport capacity data around the clock, for operations as
well as long-term studies like this one. After cutting back between 2008
and 2013, airports are expanding their capacity plans again, with 111
airports planning a 16% increase in capacity between them, 4M more
runway movements. This growth is focused on the top 20 airports, which
are planning growth of 28%, which is 2.4M runway movements.
As Network Manager, EUROCONTROL is in capacity planning: having a current plan, but with
constant contact with European airports. In a range of measures available for implementation
particular, through an on-line tool called 'Airport at shorter notice that could enable increases or
Corner' (Ref. 7), we maintain a constant dialogue decreases relative to that plan, depending on how
about current and future capacity plans at demand develops.
airports, from short-term reductions for taxiway
repairs, say, to long-term master-planning of Figure 7 also illustrates that few plans look further
total passenger and flight capacity. Some of that ahead than that: there is little change between
information is public, but most future plans are 2035 and 2040 now. The same was true in the last
shared in confidence, for commercial reasons. five years of the CG13 study.
+28% For CG18, we have data on the future capacity An important change in the CG18 data,
TOP20 plans of 111 airports in Europe. More are covered compared to CG13, is that the expansion is more
in the Airport Corner, but for current capacity concentrated in major airports, despite this being
TY
CAPACI only. 111 is slightly more than in 2013. Figure 6 where it can be most difficult to make additional
PLANS
illustrates the airports included. These airports capacity, because many of the 'easier' initiatives
include all but four of the top 50 in Europe. Some have already been taken. We will see the impact
+1G6H%
TS
9 million flights either arrived or departed one
of these airports in 2017, which is 84% of total
of this change in a number of results. The top
20 airports, ranked in terms of flights in 2017,
FL1IAIRPORTS traffic. Our forecasting is based on all 2,000 or so are highlighted in the map in Figure 6. These
11 airports for which we see instrument flight rules 20 airports saw 53% of all flights as arrivals or
(IFR) flights, but with capacity issues analysed at departures in 2017, although they account for
these 111. only 35% of the available capacity.
In fact, for analytic simplicity we treat Istanbul/ These top 20 are planning some 28% growth in
Ataturk and the new Istanbul airport as one. So capacity. For example, the additional runway at
really this is 112 airports. Heathrow is now included, and the opening of
Berlin Brandenburg has moved into this window.
In the aftermath of the 2008 financial crisis, In total, the top 20 are adding capacity for 2.4M
airports scaled back their expansion plans driven new flights (arriving and departing runway
by a reduction in demand as well as increased movements), nearly two thirds of total capacity
difficulty in financing. Now the situation appears growth. In CG13, the equivalent was only a
to be more stable. As Figure 7 shows, the growth quarter of new capacity planned at these airports.
of capacity over the 2017-2035 period is slightly
stronger in CG18 than the plans seen in 2013:
overall, the 111 airports are planning a 16%
increase between 2017 and 2035, compared to
13% over the same period last time. In general,
there seems to be a more agile approach to
/ / / / / / / / / / / / / / / / /////////////////////////////////////// / / / / / / / / / / / /17
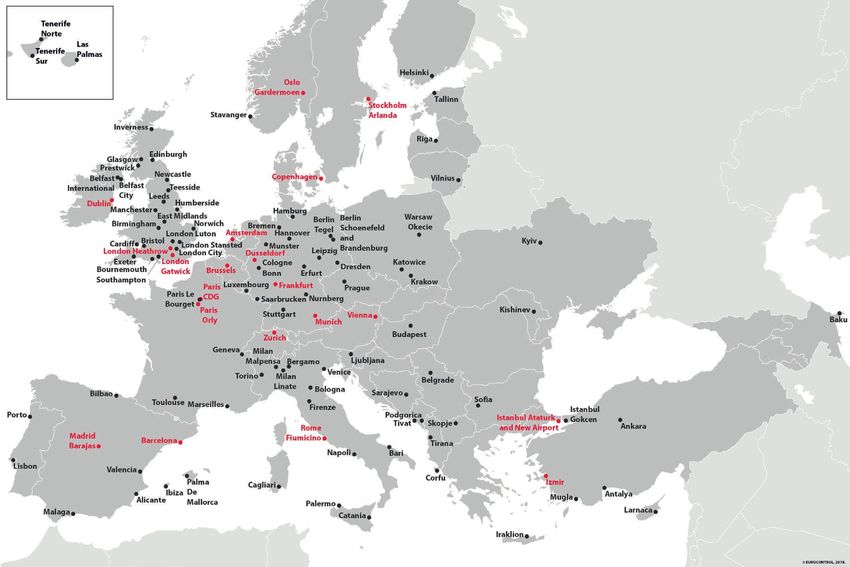
Figure 6 / CG18 uses the capacity plans of 111 airports (top 20 highlighted in red)
Figure 7 / In CG18, the additional capacity planned is more concentrated at the busiest airports
+16%
+13%
ALL AIRPORTS
IN DATA
Flight Capacity (M)
+18% +28%
TOP 20 AIRPORTS
(2017 FLIGHTS)
2017 2035 2017 2035 2040
CG13 (109 Airports) CG18 (111 Airports)
// / / / // / / //////////// / / / / / / / / / / / / / / / / / /////////////////////////////18 / EUROPEAN AVIATION IN 2040 - CHALLENGES OF GROWTH / / / ////////// / / / / / / / / / / / / / / / / / / / ////////////////////////////////////// / / / / / / / / / / /
19

         MEASURING AND
         MITIGATING GROWTH
         SLOW FLIGHT GROWTH TO 2040
         By 2040, traffic in Europe is expected to grow to just over 16 million
         flights in the most-likely scenario Regulation and Growth, or close to
         20 million in Global Growth. This corresponds to a total growth of 53%
         (Regulation and Growth) and 84% (Global Growth). This is rather slower
         growth than before 2008. Indeed, over the 20 years before the economic
         crisis, the number of IFR movements in Europe doubled from 5 million IFR
         movements in 1988 to 10 million in 2008.
         Overall, the future deceleration in growth is explained by slower rates of
         economic growth, increasing fuel prices and higher level of congestion
         at airports.

         Each scenario paints a picture of a different future,    and capacity constraints at airports, which bite
         with a different pattern of traffic growth (Figure 8).   harder due to the higher traffic. As mentioned
         Focusing on the ECAC region which covers Europe,         above, the recent return to traffic growth and
         from Iceland to Azerbaijan (Figure 21),                  new growth drivers mean that we recommend
         we observe the following.                                that, in addition to the most-likely Regulation
                                                                  and Growth scenario, particular attention
         In Regulation and Growth, there will be 16.2             be paid to the high-growth scenario Global
         million flights in Europe in 2040, 53% more flights      Growth.
         than in 2017. That is an average growth of 1.9%
         per year. There will be a slow-down in growth from       In Happy Localism, the effects of a more
         2035 as markets become more mature, economic             inward-looking Europe are slightly slower
         growth decelerates and as airport capacity limits        economic growth and higher fuel prices.
         across Europe become an increasing issue (see            Although starting from the same 2023 traffic
         page 24).                                                levels as Regulation and Growth, growth is
                                                                  slower, resulting in 1.3 million fewer flights by
         Global Growth is the most challenging scenario,          2040.
         with high growth supported by economic growth
         at the high end of expectations, a high propensity       Lastly, in Fragmenting World many factors
         to fly, a wide range of open skies agreements and        hinder the traffic growth: high oil prices, slow
         relatively low fuel prices. This scenario records 19.5   economic development, limited free trade
         million flights in 2040 in Europe, 84% more than         agreements with partners outside Europe and
         in 2017. The average annual growth rate is 2.7%,         a high price of travel. Flight growth stagnates,
         but the earlier years see average annual growth          reaching only 11.9 million flights in 2040 in
         rates of 3.1% per year (2017-2025) capitalising on       Europe, corresponding to 12% more flights
         the recent traffic recovery, while the later years       than in 2017. In 2040, the final number of
         show more moderate rates of 2% per year (2030-           flights in Fragmenting World corresponds to
         2040). This decelerating trend is explained by a         the expected number of flights by 2022 in the
         mix of factors: market saturation, larger aircraft,      most-likely scenario, Regulation and Growth.

// / / /// / / /////////// / / / / / / / / / / / / / / /
20 / EUROPEAN AVIATION IN 2040 - CHALLENGES OF GROWTH
Overall, these are rather slower growth rates than growth is due to slower economic growth (Figure
before 2008. Indeed, over the 20 years before 3), increasing fuel prices and higher levels of
the economic crisis, the number of IFR flights in congestion at airports. There is more discussion of
Europe doubled from 5 million IFR movements this in the 20-year forecast report (Ref. 6).
in 1988 to 10 million in 2008. This slower future
Figure 8 / In Regulation & Growth flights increase by 53% between 2017 and 2040
20
Global Growth
Regulation
15 & Growth
Fragmenting
World
Flights in Europe (Million)
10
5
5%
Annual Growth
0 0%
Annual Growth
-5%
Actual Forecast
-10%
1980 1985 1990 1995 2000 2005 2010 2015 2020 2025 2030 2035 2040
IFR Flights (million) Total growth Average Annual Extra flights/day
2040 2040/2017 Growth (thousands)
2040/2017
Global Growth 19.5 84% 2.7% 24
Regulation & Growth 16.2 53% 1.9% 15
Happy Localism 14.9 41% 1.5% 12
Fragmenting World 11.9 12% 0.5% 4
FLIGHTS HIGH
IN 2040
19.5M
+84%
16.2M
+ 5 3 e%ar
1.9%/y
/ /////////// / / / / / / / / / / / / / / / / //////////////////////////////////////// / / / / / / / / / / /21
In percentage terms, the smaller markets to the increase in flights per day on top of an already
East grow most quickly, due to the lower starting high total. In Regulation and Growth, four States
point, but also boosted by the new airport add more than 3,000 flights per day (Figure 9). In
capacity at Istanbul. However, much of the most Global Growth this climbs to six, with another half
challenging airspace is in the West, and even dozen not far behind. We return to this, with more
small percentage increases here can mean a large detail, later (Figure 15).
Figure 9 / In Regulation and Growth, four states add more than 3,000 flights/day.
5,000 5.0%
4.4%
4,000 4.0%
3.7%
3.5%
Additional daily flights 2040 vs. 2017
3.5% 3.5%
Average Annual Growth (AAGR) in %
3,000 3.0% 3.0%
2.7% 2.7%
2.6%
2.5%
2.3% 2.3% 2.4% 2.4%
2.3% 2.3% 2.2% 2.2%
2.1%
2.0% 2.0%
2,000 1.9% 1.9% 1.9% 2.0%
1.8%
1.7% 1.8% 1.7%
1.6% 1.5% 1.7%
1.5% 1.5%
1.4% 1.4%
1.3% 1.4% 1.3%
1,000 1.0%
1.0%
0 0.0%
Albania —
Austria —
Azerbaijan —
Belgium/Luxembourg —
Bosnia-Herzogovina —
Bulgaria —
Canary Islands —
Croatia —
Cyprus —
Czech Republic —
Denmark —
Estonia —
FYROM —
Finland —
France —
Georgia —
Germany —
Greece —
Hungary —
Ireland —
Italy —
Latvia —
Lisbon FIR —
Lithuania —
Malta —
Moldova —
Netherlands —
Norway —
Poland —
Romania —
Serbia & Montenegro —
Slovakia —
Slovenia —
Spain —
Sweden —
Switzerland —
Turkey —
Ukraine —
UK —
Additional Daily Flights (2040 vs 2017)
AAGR (2040 vs 2017)
ECAC average annual growth (2040 vs 2017)
// / / / // / / / /////////// / / / / / / / / / / / / / / / / /////////////////////////////////////// / / / /22 / EUROPEAN AVIATION IN 2040 - CHALLENGES OF GROWTH
/ ////////////////////////////////////// / / / / / / / / / / /23
DRONES: MORE OUTSIDE CONTROLLED
AIRSPACE THAN INSIDE
There will be many more unmanned aircraft systems (UAS) or 'drones'
by 2040. Most of these will operate outside current controlled airspace,
but this will put pressure to cede parts of current controlled airspace.
Within controlled airspace, 2017 saw about 6 flights/day. By 2040, the
main effect will be to replace existing operations with 'optionally piloted'
ones. On top of this transformation, we see growth of about
100 flights/day.
In 2017, there were 6 IFR flights/day by drones in in China. By way of high-side estimate of the
controlled airspace, just 0.02% of total flights. We potential impact of this within Europe, we note
reviewed recent estimates for the growing use that a doubling of the current all-cargo flights
of unmanned aircraft systems (UAS), or 'drones', intra-Europe would be of order of magnitude
including sending out a questionnaire to industry. 1,000 extra flights. We do not believe that more
For Challenges of Growth, only flights in current IFR precision than an order of magnitude is possible
airspace are within scope. Towards the end of the at this stage.
2040 horizon, there may be significant numbers
of replacement 'optionally piloted' aircraft, which It is clear that there will be a lot more UAS in
do not increase the overall demand, but present future, but largely outside current IFR airspace. A
regulatory, safety and acceptance challenges significant issue will be the pressure this puts on
if industry are to be able to deliver this new aviation to cede airspace to new uses. There will
technology and thus continue to improve efficiency. be pressure to raise the 150m ceiling for low-level
UAS operations, and there will be some airspace
The number of applications that add to rather need for very high-level, long-endurance UAS
than replace existing flights, appears much during ascent or descent. Military and some civil
smaller; mainly border and maritime patrol. We projects (Loon, Aquila) are already operating here.
estimate around 100 additional flights/day net
by 2040 for this, based on our analysis of SESAR We conclude from the consultation that
Joint Undertaking (SJU) work (Ref. 8). However, industry is far from a consensus or even a broad
there are up-side risks from new applications such understanding of the prospects for growth in this
as medium-haul cargo, currently being trialled area, so more work is needed.
Figure 10 / Outlook for additional flights from drones in IFR airspace, rather than replacements, is moderate.
But the upside risks are high.
25km Loon
Aquila
FL660 Military high-altitude
(New supersonics)
18km
Upper
6 +100 Airspace
Military
IFR drone flights/day medium-
flights-day due to IFR drones altitude
2017 2040
(excluding replacement) Lower
Airspace
New cargo services?
150m
Around
Airports
// / / /// / / /////////// / / / / / / / / / / / / / / / / / / ////////////////////////////24 / EUROPEAN AVIATION IN 2040 - CHALLENGES OF GROWTH
AIRPORT CAPACITY PLANS ARE NOT ENOUGH
Airport capacity expansion plans, even if they can be delivered, are not
sufficient. Plans are better focused than they were in 2013, with more
capacity expansion where we predict more traffic growth. Even so, by 2040,
there will be 1.5M flights more in demand than can be accommodated, 8%
of demand in the most-likely scenario, Regulation and Growth. That is 160
million passengers. The gap is spread across 17 States. In Global Growth,
the gap is 3.7M flights and 16% of demand.
Even if it is possible to deliver all of the Challenges of Growth 2013 looked out to 2035.
plans reported (and experience suggests At this horizon the 2018 situation has improved;
that this will not be the case) the 16% unaccommodated demand has dropped from 1.9 to 1.0M
planned increase in airport capacity is not in Regulation and Growth. This change is made up of:
sufficient to meet demand. In Regulation
and Growth, the capacity gap is some n lower demand at that horizon: a net reduction of about
1.5M flights, which is 8% of underlying 0.6M flights made up of larger falls for Turkey and
demand, or 160 million passengers unable Germany, for example, not entirely balanced out by
to fly. In the high-growth, Global Growth increases in Spain and France;
scenario, that climbs to 3.7M flights n better-used capacity: where UK and Netherlands, for
unaccommodated, or 16% of demand, example, manage to accommodate more flights on
360 million passengers. The results from lower total capacity plans, because the plans are better
all four scenarios are shown in Figure 11. targeted to where we expect to find the growth.
This shows how the gap widens steadily
in later years for Regulation and Growth, One of the aims of the Challenges series of studies is to
but accelerates in Global Growth, jumping raise awareness of the scale of the future needs, if aviation
by 80% in the last five years as the forecast is to meet demand. The fact that there has been some
pushes past the horizon of most capacity improvement in capacity is, in respect of this goal, a
expansion plans that were reported to the positive sign, even if a million unaccommodated flights in
Airport Corner. 2035 is still a critical capacity gap.
Figure 11 / Demand exceeds capacity by 1.5M flights in 2040,
climbing to 3.7M in Global Growth. Global
Growth
HIGH
20
3.7M
16% CAPA
Regulation GAP 2CIT Y
040
1.5M
IFR Flights (million)
& Growth
15
Happy
localism FLIGH
8% O TS
160MF DEMAND
PEOP
Fragmenting LE
World
10
Main (constrained) forecast - solid line
Unconstrained demand - dashed line
2005 2010 2015 2020 2025 2030 2035 2040
/ / / / / / / / / / / / / / / / /////////////////////////////////////// / / / / / / / / / / / /25
The most-likely capacity gap of 1.5M flights is equivalent to 7 or 8 busy runways. But the gap is not
conveniently located for that to be the solution. It is spread over 17 different States, as shown in Figure 12.
Even with their ambitious capacity expansion plans, both Turkey and UK are forecast still to have
additional capacity gaps.
Figure 12 / In Regulation and Growth, the capacity gap is felt in 17 States2.
Regulation & Growth
Happy Localism
Global Growth
Fragmenting World
Albania
Austria
Azerbaijan
Belgium/Luxembourg
Cyprus
Czech Republic
Estonia
France
Germany
Greece
Hungary
Ireland
Italy
Lisbon FIR
Moldova
Netherlands
Norway
Poland
Serbia & Montenegro
Slovenia
Spain
Sweden
Switzerland
Turkey
UK
2- In the diagram,
two pairs of States
are shown, because
they share a flight
information region,
while (Continental)
Spain and Lisbon FIR Total capacity gap at local airports in 2040
refer to the Iberian
FIRs of Spain and
-50k 50k-100k 100k-200k >200k
Portugal respectively.
Unaccommodated IFR Movements (million) Unaccommodated demand (%)
2025 2030 2035 2040 2025 2030 2035 2040
Global Growth 0.7 1.1 2.1 3.7 5% 7% 10% 16%
Regulation & Growth 0.3 0.5 0.9 1.5 2% 3% 6% 8%
Happy Localism 0.3 0.6 1.0 1.4 2% 4% 7% 9%
Fragmenting World 0.2 0.2 0.3 0.4 2% 2% 2% 3%
// / / / // / / //////////// / / / / / / / / / / / / / / / / / /////////////////////////////26 / EUROPEAN AVIATION IN 2040 - CHALLENGES OF GROWTH
INCREASING CONGESTION MEANS SEVERE DELAYS
Even with 1.5M flights unaccommodated and therefore lost, the network
remains highly congested. The number 'Heathrow-like' airports operating
near capacity for much of the day climbs from 6 in Summer 2016 to 16 in
2040, or even 28 in Global Growth. We have modelled delays from all causes,
and find that in the Summer, these would jump from 12 minutes
to 20 minutes per flight in 2040. In particular, the number of flights
delayed by 1-2 hours increases by a factor of 7.
HIGH
28
Flow management is the core responsibility Operating at 80% or
of the Network Manager. It means regulating more of capacity for 6
traffic to keep the network running smoothly consecutive hours:
and avoid the overloading of airspace There were 6 airports at
by having too many flights arrive at one this level of congestion
time. We have modelled the future traffic in Summer 2016; London
scenarios to see their impact on the network, Heathrow being like this
taking two Summer months August and year-round. This is already an increase on the 3
September as a busy traffic sample. The tool airports observed in 2012, in the last report. The
used allows us to model all causes of delay. forecast is now for this to climb to 16 congested,
So we see the development of primary 'Heathrow-like' airports by 2040, in Regulation and
delay, such as that from flow management Growth, or even 28 in Global Growth. That is a small
regulations or from delays in loading improvement on the 20 congested airports in the
baggage, as well as reactionary delay caused most-likely scenario from CG13, since the capacity
by late arrival of an aircraft from an earlier growth is better targeted at the larger airports, as
flight in the same day. There is more detail previously discussed.
of this modelling in the congestion report
(Ref. 9). Another way of looking at this outcome is that in
Regulation and Growth, more than 80% of the capa-
The results show that, even having lost 1.5M city of the top 20 airports will be being used for most
flights that are unaccommodated, there will of the operating day, up from less than 70% in 2016.
still be a significant number of congested
airports. There are a number of different Airlines and airports adapt to a certain level of
ways to define congestion, but we focus on congestion, with operating procedures, processes,
two here. schedules and capital investment to provide a
reasonable quality of service to their passengers.
Average delay per flight: We assume that However, it is hard to see how quality of service
delays from causes other than congestion could be maintained if average delays were nearly
on the ground3 remain constant. Then our to double. There is a long tail to the distribution of
modelling of the interaction of increased delays: our modelling shows a significant increase in
traffic and future capacity plans shows flow flights delayed by 60-120 minutes in this situation,
management delays climb from 1.2 mins with 7 times as many by 2040 in Regulation and
flight in Summer 2016 to 6.2 in 2040. This Growth. This means around 470,000 passengers
is because the Network Manager needs to each day delayed by 1-2 hours in 2040, compared
apply more and more flow management to around 50,000 today. We also modelled the
3- For simplicity we
take this to include regulation to balance demand against cancellation of flights in response to strong delay,
cases where airport the limited capacity. This drives the total but at these levels of delay any cancellation model is
constraints are more in
the surrounding airspace
delay from 12.3 minutes to 20.1 minutes on working outside its calibration region. More details
than on the runway. average, per flight (Figure 13). are in the congestion report (Ref. 9).
/ / / / / / / / / / / / / / / / / / / ////////////////////////////////////// / / / / / / / / / / / /20.1 27
8.7
12.3 Reactionary
Delay
per flight
HIGH
(minutes) 6.0 45
Flow
6.2
+370% SUMMER
1.2 Management
DEL AY
20
Figure 13 / In Regulation and Growth, 5.1 Other 5.2
Summer delay jumps from Primary
12 to 20 minutes per flight, driven by
Summer 2016 Summer 2040
flow management regulations.
mins/flig
ht
+63%
Figure 14 / The congestion challenge means degraded performance at a significant number of airports.
Average delay/flight (minutes)
2016
5 10 15 20 >30
2040 - Most Likely
Figure 15 / Between 2017 and 2040, flights will increase most in what is already the most-challenging airspace.
Additional Flights per day
0 100 200 300 400 500 700 900
Regulation & Growth Global Growth
// / / / // / / / /////////// / / / / / / / / / / / / / / / / ////////////////////////////28 / EUROPEAN AVIATION IN 2040 - CHALLENGES OF GROWTH
Congestion is also a challenge for the airspace. The European core area will not be exempt,
Although for this study we did not model having an average demand growth between
airspace congestion, we can look in more detail 40% and 55%. But here, in what is already
at where the traffic increases will be. By 2040 today the most complex and busy airspace in
in Regulation and Growth
Growth, a majority of en- Europe, even a small percentage change is an
route airspace will face an increase in demand operationally-significant increase in traffic. Figure
of between 50% and 80%, so some airspaces 15 shows that small segments of this airspace
will see growth well ahead of the 53% average will receive more than 900 additional flights per
growth. For example, at this time horizon, Turkey day. To handle this growth where traffic is already
will face 2.5 times as many flights. This expected dense and complex will surely represent as much
growth will directly impact the neighbouring of a challenge as a higher percentage growth
countries, so Romania, Bulgaria, Serbia, Cyprus elsewhere. EUROCONTROL Network Manager is
and Greece will experience high level of traffic part of the strategic airspace study for DGMOVE
demand with expected growth around or greater looking in detail at how airspace optimisation
than 80% compared to 2016. can reduce this en-route congestion problem.
MITIGATION – MORE AIRPORT CAPACITY
BY A VARIETY OF MEANS
Closing the capacity gap is a task for airports, providing more infrastructure,
but also for airlines, regulators and others. Taking a cue from how industry
has responded in the past, we modelled six different mitigations, apart from
new runways. Of these mitigations, the most promising are the developments
under SESAR Wave 1, which target busy airports at peak hours.
These developments could reduce the most-likely capacity gap by 28% in
HIGH 2040, if they can be successfully deployed.
14%
CLOSIN
THE GA G
The response to the capacity gap, the have been seen in the past or plans for what
mitigation, will be led by airports but might be achieved in the future. The outcome of
P
28%
involve a broad range of actors in the six such what-ifs is shown in Figure 16.
industry: airlines, regulators, local
authorities, passengers and shippers, air SESAR: Wave 1 of SESAR has a package of 10
if depl navigation service providers, research improvements to increase airport capacity at
SESAR oy organisations amongst others. Airport peak times. The SESAR target gains are around
Wave 1 congestion is not a new phenomenon, and 7% in peak throughput. This gives around 1.5%
looking into historic data we can identify a increase in total capacity across the 111 airports
number of responses which industry has used but, since they are focused on peak hours, the
in the past. In the mitigation study (Ref. 5) we effect in Regulation and Growth is to reduce the
investigated the possible impact of a range of 1.5M flight capacity gap by 28% in 2040. They
such responses. are much less effective in Global Growth, where
the capacity challenge is much broader. Overall,
Building new airport infrastructure is clearly a this mitigation is more focused than in CG13 and
principal response, and we have seen in earlier as a result gives a bigger reduction where the
sections how well-targeted airport capacity saving was 19%.
plans can reduce the capacity gap, even if such
plans are not always easy to deliver. Local Alternative: Major cities are typically
not short of runways, but often they are not at
Beyond this, the mitigations are more the right airport and lack the right airport and
speculative extrapolations of responses that ground access infrastructure, or they are not
/ / / / / / / / / / / / / / / / / / / / ////////////////////////////////////// / / / / / / / / / / /29
well-placed relative to residential areas. Where fill up. Projecting the same forward, based on
these obstacles can be circumvented, airlines the current quiet-versus-busy-hour pattern at
may focus their growth away from the principal Heathrow, gives us the 'schedule smoothing'
airport to avoid congestion, either under their what-if? Here, the reduction in the capacity gap
own or as a government initiative. In a what-if? is 11%, considerably lower than in CG13 (20%).
analysis we looked at some city-specific options
for this, and found that some 16% of the capacity Larger aircraft: Looking around Europe, and
gap would be mitigated, if these options could current traffic, we can see wide variation in the
be delivered. This is probably an upper bound, size of aircraft used to serve city pairs that are
given the difficulties in implementing such otherwise similar in distance, in total passenger
changes, it is also lower than that seen last time numbers and in having competition between
(21%). airlines. As a what-if?, we modelled the effects if
the larger aircraft on such city pairs were more
Consensus Benchmark: For smaller airports, consistently used. This led to an 8% reduction
capacity plans sometimes seem to be driven as in unaccommodated demand: more passengers
much by current demand as by fundamental able to fly, on fewer flights.
limits to local physical capacity. We took, as a
what-if?, the assumption that single-runway HST investment: The forecast scenarios already
airports could if necessary reach the upper- capture known plans for improving high-speed
quartile capacity of this whole group, 200,000 train (HST) infrastructure, and our forecast
movements per year. This reduced the capacity includes a model of the local reductions in air
gap by 13%, marginally better than in CG13 passenger demand that will result. As a what-
(10%). if? we looked at 43 other city pairs which have
significant numbers of flights, and at distances
Schedule smoothing: When airport slots at where HST is often competitive. If these
peak hours are unavailable, airlines add capacity additional HST links were possible, it would
at other hours. This can improve fleet utilisation, move more passengers from air to rail, and
but has a cost impact due to lower yields. reduce the capacity gap by 7%. The obstacles to
In aggregate historical data, we can see the making that possible are large, including funding
effect of this as the quieter hours at an airport and acceptance by residents along the route.
Figure 16 / Mitigation: What-if? reductions in capacity gap for 2040.
SESAR Local Consensus Schedule Larger HST
Improvements Alternative Benchmark Smoothing Aircraft Investments
0%
-6% -6%
-10% -10%
-20% -14%
-20%
Global Growth
-40%
0%
-8% -7%
-20% -13% -11%
-16%
-28% Regulation & Growth
-40%
/// / / /// / / /////////// / / / / / / / / / / / / / / / / / / /////////////////////////30 / EUROPEAN AVIATION IN 2040 - CHALLENGES OF GROWTH
NEED TO
ADAPT
ADAPTING TO CLIMATE CHANGE
NEEDS LONG-TERM PLANNING
The climate is changing. Over the medium and long term, there will be
changes to temperatures, to rain, snow, wind and storm patterns and in
the sea level. This will affect aviation infrastructure, patterns of demand,
and daily operations. An updated and enlarged survey shows that the
European aviation industry recognises that these challenges are coming.
But there has been little change over the last five years in the proportion
of organisations actually planning for adaptation to climate change
impacts. This is a risk that needs further investigation.
Since Challenges of Growth 2013, the two main changes to the climate and effects on aviation,
scientific documents on climate change that which include damage to infrastructure, delays
were referenced then, the IPCC Assessment and disruption on the day of operation, and
Reports (eg. Ref. 10) and the European changes to underlying demand: when and where
Environment Agency (EEA) Climate Change tourists will want to go.
Impacts and Vulnerabilities report (Ref. 11), have
both been updated. Their message remains The CG18 environment report (Ref. 12) describes
consistent and clear: inertia in the climate system the background and impact in more detail. It
means that some degree of climate change is also begins to address some of the adaptation
inevitable. Figure 17 summarises the principal measures that are available.
Figure 17 / Summary of the principal climate change impacts on aviation
Climate Effect Aviation Impact
Temperature
Europe continues to warm more quickly than the global Aircraft performance
average: Scandinavia more in Winter, southern Europe in Seasonal and geographical changes in tourism demand patterns
Summer.
Heat damage to infrastructure
Changes to Rain & Snow Patterns
Less snow overall, but heavier events Delays and cancellations
Less rain in the South, more in the North Flooding of airports and access routes
More heavy rainfall events Change in snow clearance needs
Changes to storm patterns
More uncertainty in the climate modelling here, but Delays, re-routing, increased fuel burn
increase in frequency of strong and damaging storms Loss of en route capacity
Convective weather affecting multiple airports simultaneously
Sea Level
Over longer term, sea level rise Permanent or temporary loss of airport capacity,
Uncertainty over storm surges infrastructure and access.
Network disruption
Changes to wind patterns
Change in jet stream strength, position and curvature Increase in clear air turbulence
Shifts in prevailing wind direction Increased variability in trans-Atlantic times and routes
Increase in extreme wind speeds in North and centre. Crosswind changes affecting airport capacity
Operational disruption
/ / / / / / / / / / / / / / / / /////////////////////////////////////// / / / / / / / / / / /31
In CG13, we consulted industry to assess the Given the long-term horizons of investments in
extent to which it was ready for climate change. aviation infrastructure, some of these climate
We re-ran this survey for Challenges of Growth change effects are within planning horizons,
2018, receiving more than 90 replies, a much eg before 2040. But only half (52%) reported
larger response than five years ago. that their organisations had begun to plan for
adaptation to climate change impacts. This is a
A clear majority of respondents believe that proportion that has hardly moved in the last five
their businesses will be affected by climate years (although the response size was small last
change (Figure 18). Indeed, around a quarter time). Respondents gave reasons for not taking
of total respondents think that their businesses action that included lack of information and lack
are already being affected. There have been of resources, but this delay in taking action is a
a number of well-reported severe weather clear risk for the future.
events recently. While climate scientists would
be cautious about jumping to the conclusion A theme of Challenges of Growth is sounding
that this was climate change, the events help to an early warning, leading to actions that are
persuade that there will be challenges ahead, taken in good time. We need to do more here
since 86% believe that they will have to respond to understand the gap between need and real
(Figure 18). planning for action: what are the reasons for this
gap? Are they valid? If not, what can be done to
encourage investments that take climate change
into account?
Figure 18 / A majority believe climate change will affect their business
% of organisations that expect the impacts
of climate change to affect their business
57% 10% 33%
between now and 2050 Yes No No official position
2013: 52% 2013: 45%
% of organisations that consider adaptation
actions to reduce the impacts of climate change
86%
may be necessary now or in the future Yes No
% of organisations that have begun planning 52%
for adaptation to climate change impact Yes No
0% 10% 20% 30% 40% 50% 60% 70% 80% 90% 100%
// / / /// / / /////////// / / / / / / / / / / / / / / / / / / /////////////////////////////32 / EUROPEAN AVIATION IN 2040 - CHALLENGES OF GROWTH / / / ////////// / / / / / / / / / / / / / / / / / / / ////////////////////////////////////// / / / / / / / / / / /
33

        THE MAIN CHALLENGES
        In summary, we have explored the future outlook by means of four
        scenarios. We identified three principal challenges linked to airport
        capacity.

        Airport capacity plans are more focused

                                                       CAPACITY
        on where the capacity is needed, ie at
        the busiest airports, but they are still                         HIGH
                                                       GAP 2040
        not enough to meet forecast demand.
        In the most-likely scenario Regulation                           3.7M
                                                                         16%
                                                       1.5M
        and Growth, the gap of 1.5M flights
        is roughly 8 runways, but impossibly
        shared across 17 different States. We
        looked at other options, but with that
        scale of gap, new airport capacity has to
        be part of the solution. We do not need        FLIGHTS
        to look far for evidence of how difficult it   8% OF DEMAND
        can be to deliver it, so the challenge is to
        plan and deliver enough future capacity.
                                                       160M PEOPLE
        Lack of airport capacity means
        unaccommodated demand, but will
        also bring Summer network delays
        more than 60% higher than today. The
        number of flights delayed by 1-2 hours
                                                       2040
                                                       SUMMER
                                                       DELAY
        will go up by a factor of 7. It will be
        a challenge to provide an acceptable

                                                       20
        quality of service to passengers and
        shippers with this level of delays at
        airports, and that is without including
        the en route challenge of adding
                                                                         HIGH
        high volumes of flights to what are                                45
        today already the most complex and                              +370%
        congested parts of the airspace.

        An updated survey shows that the               mins/flight
                                                       +63%
        European aviation industry recognises
        that climate change is coming. Over
        the medium and long term, there will
        be changes to temperatures, to rain,
        snow, wind and storm patterns and in
        the sea level. This will affect aviation
        infrastructure, patterns of demand, and
                                                       NEED TO ADAPT
        daily operations. Industry recognises the
        need for adaptation, but only half have
        begun to plan.

// / / /// / / /////////// / / / / / / / / / / / / / / / / / / //////////////////////////
34 / EUROPEAN AVIATION IN 2040 - CHALLENGES OF GROWTH
A. COMPARISON WITH PREVIOUS CHALLENGES STUDIES
To achieve a like-for-like comparison with In terms of demand and accommodated flights,
previous Challenges studies, we use the ESRA02 we see clearly the effects of:
region (Figure 19), since the ECAC region was not
analysed in 2004. We are also limited because the n the economic downturn, which has led to a
2004 study only reached to 2025, and the 2008 nine-year hiatus in traffic growth, meaning that
study to 2030. The comparison for the most-likely the 2008 peak was not passed until 2017 (ECAC
scenario, and the most challenging scenario is figures). That nine-year shift is nearly 5 million
shown in Figure 20. flights in Regulation and Growth.
Figure 19 / ESRA02 region n An economic forecast for future years which
continues to be reduced, leading to increasing
divergence of the current flight forecast from
previous forecasts.
In Regulation and Growth, the forecast is relatively
stable. The capacity gap is slightly lower in 2025,
and significantly lower in 2030 and 2035, for
example because of the better-targeted growth
plans that have been discussed. Since we are
now five years closer to these dates, such an
improvement would be hoped for; for one thing
it suggests that the message of Challenges of
Growth has been heard.
Figure 20 / Comparison with previous studies for the ESRA02 region
(Results are different in the main text, which uses the larger ECAC region.)
Global Growth Regulation & Growth
Demand Flights Capacity gap Demand Flights Capacity gap
(million) (million) million) (million)
2025
Challenges to Growth 2004 20.9 17.2 18% 16.7 15.1 10%
Challenges of Growth 2008 23.6 19.9 16% 17.6 16.7 5%
Challenges of Growth 2013 15.1 13.9 8% 12.8 12.3 4%
Challenges of Growth 2018 14.3 13.6 4% 12.4 12.1 3%
2030
Challenges of Growth 2008 29.1 22.1 24% 20.4 18.2 11%
Challenges of Growth 2013 17.7 15.4 13% 14.4 13.2 8%
Challenges of Growth 2018 16.6 15.5 6% 13.9 13.4 3%
2035
Challenges of Growth 2013 16.9 21.3 21% 15.9 14.0 12%
Challenges of Growth 2018 19.2 17.2 10% 15.6 14.7 6%
/ / / ////////// / / / / / / / / / / / / / / / / / / / ////////////////////////////////////// / / / / / / / / / / /You can also read