European Construction Sector Observatory - Country profile Sweden June 2018
←
→
Page content transcription
If your browser does not render page correctly, please read the page content below

European Construction
Sector Observatory
Country profile Sweden
June 2018
European Construction Sector Observatory

                                                        In a nutshell

The Swedish construction sector has been experiencing strong                      To boost investment in infrastructure, improve mobility and thus
growth in the recent years. The number of companies in the sector                 alleviate the housing shortage, the government introduced a new
grew by 21.4% in 2016 compared to 2010, to 213,434. Similarly,                    SEK 622.5 billion (EUR 65.8 billion) infrastructure bill for 2018-2029.
production in the construction of buildings has been on the upswing,              Sweden is also a leader in research and innovation, with several
exceeding the 2010 level by 19.2% in 2016. However, in 2016 produc-               initiatives to strengthen the link between academia and the construc-
tion in civil engineering was 17.5% below its 2010. Positive develop-             tion industry to actively promote the commercialisation of research
ments are also observed in terms of profitability, with the turnover              and research into sustainable construction. Schemes to support the
growing by 42.3% to EUR 127.1 billion over 2010-2016. Employment in               energy efficiency and renovation of the housing stock are also
the broad construction sector has also been buoyant, with the number              available, including a 30% tax deduction (ROT) and a SEK 778 million
of workers increasing by 20.2% over the same period (to 644,073                   (EUR 82.2 million) programme for the energy efficient renovation of
people).                                                                          rental housing in socio-economically disadvantaged areas.

                                                                                  The outlook for the construction sector is positive, with growth
Number of companies in the                                                        being forecast at 5.9% in 2017, 3.9% annually for 2018-2022 and 2.6%
construction sector evolution 2010-2016                                           over 2023-2027. Obstacles to growth can be found in the remaining
                                                                                  complexity of the planning and building regulations and the skills
                                                                                  shortage already experienced by construction sector companies.
Low interest rates and the ease of access to mortgages, coupled with
population growth and immigration, are spurring demand for resi-
dential properties. However, there is structural undersupply of dwell-
ings in Sweden and despite the high levels of dwelling construction in                  The outlook for the construction sector is
2016 and 2017 (63,100 new starts, +34% compared to 2015; 76,00 new
                                                                                        positive, with growth being forecast at 5.9%
starts in 2017, +20.4 vis-à-vis 2016), these were not sufficient to address
the housing shortage, which requires the construction of 600,00 new
                                                                                        in 2017, 3.9% annually for 2018-2022 and 2.6%
homes by 2025. This situation led to significant increases in house                     over 2023-2027.
prices, with the house price index soaring by 47.1% between 2010 and
2016 and 8.6% between 2015 and 2016 alone. Coupled with the high
household debt approaching 86% of GDP and about 180% of dispos-
able income, there have been concerns about the vulnerability of the
Swedish economy to shocks. Policy responses include fiscal stimulus
for increased construction, regulatory reforms of planning and building
regulations and revisions to housing loan regulations.

         New dwelling construction evolution

                                                                              2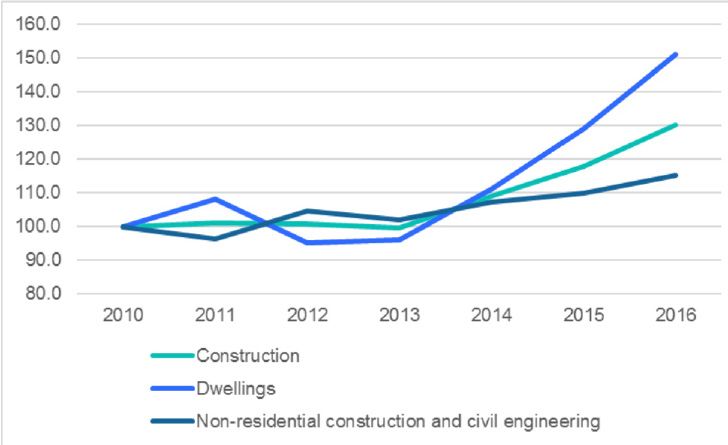
Country Fact Sheet Sweden

                                                                                  1
                                                                             Key Figures

                                                                                                            In 2016, the total value added of the broad construc-
The number of enterprises in the broad construction sector in
Sweden totalled 213,434 in 2016 (Figure 1). Companies in the narrow
                                                                                                            tion sector was EUR 59.6 billion, with the narrow
construction sector accounted for 49.8% of the total, followed by                                           construction sub-sector having the largest share,
real estate activities (28.7%), architectural and engineering activities                                    followed by real estate activities, architectural and
(18.8%) and manufacturing (2.7%). The overall number of enterprises                                         engineering and manufacturing (Figure 3).
in the broad construction sector experienced a 21.4% increase over
2010-2016, with growth in all sub-sectors at approximately 20%, with
the exception of manufacturing, in which the number of companies                                         The share of gross value added of the narrow construction sector in
declined by 7.5%. Production in construction and its subsectors was in                                   the GDP1 reached 5.4% in 2016, while real estate activities accounted
decline between 2011 and 2013, but has been recovering since and in                                      for 7.7% of GDP (Figure 4).
2016 was 16.3% above its 2010 level. However, while production in the
construction of building increased by 19.2% in that period, production                                     Figure 3: Value added in the construction sector in Sweden
in civil engineering remained below its 2010 value by 17.5%. (Figure 2).                                   in 2016 (EUR m)
                                                                                                            60,000

      Production in construction                                                                            50,000                                           7,256
      evolution 2010-2016
                                                                                                            40,000
                                                                                                                                                             18,884
   Figure 1: Number of enterprises in the construction sector                                               30,000
   in Sweden over 2008-2016
                                                                                                            20,000
                                                                                                                                                             23,960
 120000
                                                                                                            10,000

 100000                                                                                                                                                      3,006
                                                                                                                    0
                                                                                                                  Architectural and engineering activities     Real estate activities
  80000
                                                                                                                  Construction                                 Manufacturing

  60000                                                                                                                                                                                 Source: Eurostat, 2017.

  40000

  20000
                                                                                                           Figure 4: Gross value added as a share of GDP in the construction
      0                                                                                                    sector in Sweden in 2016 (%)
             2010         2011        2012          2013       2014           2015        2016
     Manufacturing                                   Construction
     Real estate activities                          Architectural and engineering activities
                                                                                                                                                                                    7.7
                                                                           Source: Eurostat, 2017.

                                                                                                                                                                5.4
  Figure 2: Volume index of production in the Swedish
  construction sector over 2010-2016 (2010=100)
   120

   110                                                                                                      0.0                2.0              4.0                  6.0            8.0                10.0

   100                                                                                                                          Real estate activities                      Construction
    90                                                                                                                                                                           Source: Eurostat, 2017.
    80

    70

    60
            2010       2011       2012       2013       2014        2015        2016

             Volume index of production - construction
             Volume index of production - construction of buildings
             Volume index of production - construction of civil engineering works

                                                               Source: Eurostat, 2017.

                                                                                                     3
European Construction Sector Observatory

                                       2
                             Macroeconomic Indicators

In 2016, Sweden’s GDP amounted to SEK 4,025 billion (EUR 405.6                                        Unemployment rate
billion), representing a 3.3% increase since 2015 and a 14.3% increase
since 2010. The same year, the country’s potential GDP was SEK 4,017
billion (EUR 404.9 billion), resulting in a slightly positive output gap.
Growth was driven in particular by domestic demand: an expansionary
monetary policy, additional public expenditure to cope with the influx
of asylum seekers and strong household income.

       Sweden’s GDP amount
       evolution 2010-2016

In 2016, general government expenditure as a share of GDP in
Sweden was 50.1%. Data on government deficit as a share of
GDP indicates that the country recorded a surplus of 0.9%, in spite
of spending increases related to migration. Furthermore, general
government gross debt amounted to 41.6% in 2016, higher than                    In terms of access to finance, it is worth noting that lending to non-fi-
in 2010 (38.3%) but considerably below the EU-28 average of 85%2.               nancial corporations has picked up in 2015-2016 (4% and 5.1% of
Public finances are assessed as being robust, despite the need for              year-on-year growth respectively), following actual contraction in 2009
continued spending on refugee integration, education and social                 (-4.4%) and slow annual growth in the following years. Nevertheless,
services including housing3.                                                    Sweden is one of the top performers in Europe as regards access to
                                                                                finance for SMEs and specifically the availability of venture capital
                      Government gross debt                                     and equity to young and growing firms. SMEs have also benefited
                                                                                from financial support by the European Investment Fund, which has
                                                                                concluded agreements with a number of intermediaries in Sweden,
                                                                                amounting to EUR 235 million as of 20165.

                                                                                In terms of demographics, the total population of Sweden amounted
                                                                                to 9.9 million people in 2016, which was 5.8% more than the popula-
                                                                                tion in 2010. Net migration has been growing continuously, reaching
                                                                                117 000 people in 2016, i.e. 134% above the 2010 level. Largely due
                                                                                to the high number of refugees admitted to the country since 2013,
                                                                                the high migrations levels are putting additional pressure on the
                                                                                existing housing stock and driving the need for public infrastructure
                                                                                and services.

The unemployment rate in Sweden stood at 6.9% in 2016, below
the EU-28 average of 8.6% but also a marked decrease from the high
unemployment level in 2010 (8.6%). Youth unemployment (below the                    The total population of Sweden
age of 25) was at 18.9% in 2016, in line with the EU-28 average of 18.8%            evolution 2010-2016

and an improvement since 2010 (24.8%)4.

                                                                            4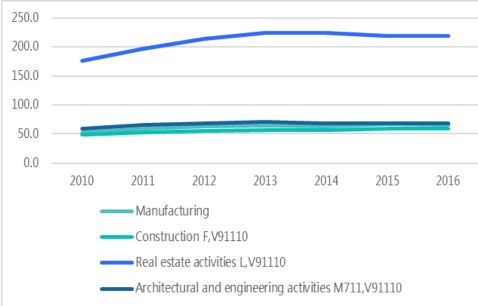
Country Fact Sheet Sweden

In 2016, Sweden’s working age population accounted for 62.8% of its
total population, and it is projected to decline in the future, accounting
for 59.8% of the total by 2050. People over 65 accounted for 19.8% in
2016 and their proportion is predicted to rise to 22.7% by 2050. This,
together with the demographic growth in the country, are expected
to drive the demand for public sector construction such as hospitals
(see TO 1 - Investment conditions and volumes), but also for housing
adapted to the needs of the elderly (See Policy schemes).

                                                                                   Percentage of working age population
                                                                                       regarding the total population

                                                                             5
European Construction Sector Observatory
3
Key economic drivers of the
construction sector
Productivity Profitability
Labour productivity in the broad construction sector in Sweden The turnover of the broad construction sector experienced a 42.3%
experienced a generally increasing trend, despite some fluctua- increase between 2010 and 2016, following the decline brought
tions, growing from EUR 68,545 in 2010 to EUR 81,827 of gross value about by the economic crisis. Similarly, gross operating surplus has
added per person employed in 2014 (+19.4%). Productivity across all been growing, reaching EUR 20.8 billion in 2014, i.e. 30.9% above the
construction sub-sectors has displayed a similar trend between 2010 2008 level (EUR 15.9 billion)6. The gross operating rate of the broad
and 2016, with labour productivity in real estate activities experiencing construction sector7, which gives an indication of the sector’s profit-
the largest increase in absolute terms, from EUR 176,400 in 2010 to ability, was 17.4% in 2014, comparable to the 2008 value (17.3%)8. In
EUR 218,400 in 2016, the highest among all sub-sectors. The relative parallel, construction costs for residential buildings have been experi-
increase in annual productivity over this period stood above 20% for encing an increasing trend, with the construction cost index rising by
all sub-sectors, with the exception of the architectural and engineering 13.2% over 2010-2016, spurred by the 15.1% and 13.1% increases in
activities sub-sector where it was 16.8%. labour costs and input prices for materials (Figure 9). The closed and
uncompetitive housebuilding market exacerbates this issue (see TO
Labour productivity in the broad 4 - Single Market).
construction sector
Turonover of the broad construction
sector evolution 2010-2016
Figure 9: Construction cost index for residential buildings over
2010-2016 (2010=100)
Figure 8: Labour productivity in the construction sector in Swe-
den over 2010-2016 (EUR k)
Source: Eurostat, 2017.
Source: Eurostat, 2017.
6Country Fact Sheet Sweden
Employment
The number of self-employed workers in the construction sub-sector
has remained roughly the same since 2010, from 60,300 to 59,400 in
2016 (-1.5%), and accounting for 14.5% of the total self-employed
In 2016, the broad construction sector people in the general economy. Conversely, self-employment in the
employed 644,073 people, a 20.2% real estate sub-sector by 14.1% between 2010 and 2016, to 8,100 in
increase compared to 2010 (535,817), 2016 and accounting for 2.0% of the self-employed in the general
representing 12.5% of total employment economy. SMEs play an important role in terms of employment, since
they employed 80.3% of the total workforce of the broad construction
in the general economy9.
industry in 2014.
Business confidence
In 2016, the broad construction sector employed 644,073 people,
a 20.2% increase compared to 2010 (535,817), representing 12.5% of Business confidence in Sweden has been improving since the
total employment in the general economy10. Specifically, the construc- economic crisis. Although fluctuating, the consumer confidence
tion sub-sector employed 63.1% of the total workforce in the broad indicator has been positive since 2000, and increased from a bottom
construction sector in 2016 (406,149persons), followed by architec- low of 1.1 in 2008 to a peak of 24.2 in 2010. It has been declining since
tural and engineering activities (16.5%), real estate activities (13.4%) then, reaching 10.7 in 2016, but was still above the 2008 value. The
and manufacturing (7.1%) (Figure 10). Architectural/engineering industry confidence has been fluctuating since 2010, but ended
activities, narrow construction and real estate activities experienced 2016 on a positive 3.6%. The construction confidence indicator
a 25.8%, 22.8% and a 15.4% increase in their workforce over 2010- was badly affected by the crisis, but managed to a recover a bottom
2016. Conversely, the manufacturing sub-sector saw a 1.2% decline low of -44.0 in 2009 to 15.8 in 2016. In parallel, the investment ratio
in the number of workers over the same period. As for employment has increased from 22.3% in 2010 to 24.7% in 2016. Investment per
by specific occupation, specialised constructions activities was worker dropped by 23.7% between 2007 and 2009, from EUR 106,512
the single largest occupation in the construction sub-sector in 2016 to a bottom low of EUR 81,241. It further fell in 2012 to EUR 77,072,
(272,813 people). Development of building projects professionals saw but subsequently recovered to EUR 81,182 in 2014, but was still 23.8%
the largest increment, but from a low base of 232 in 2010 to 647 in below the 2007 value11.
2016 (+198.4%), followed by workers in demolition and site prepara-
tion and building completion and finishing (+33.4% each). Conversely,
the number of workers employed in the manufacture of products of
wood, cork, straw and plaiting materials dropped by 7.9%, from 22,442
to 20,388 over the same period.
Figure 10: Percentage of people employed by construction
sub-sectors in Sweden in 2015
Consumer confidence
Source: Eurostat, 2017.
7European Construction Sector Observatory
Domestic sales Export of construction-related
products and services
The ranking of the most domestically sold construction products
has remained constant in Sweden between 2010 and 2016. Domestic The ranking of the most exported products has remained relatively
sales have experienced a considerable increase in value over this stable since 2010. Some of the top exports have dropped in value
period, with ‘Windows, French windows and their frames’ growing compared to 2010, e.g. the exports of other structures and part of
from EUR 344.6 million to EUR 795.7 million (+130.9%) and ‘Prefab- structures have dropped by 34% in that period, from 315 million to
ricated structural components for building or civil engineering, of 208 million. In comparison, the highest growth for the period was in
cement, concrete or artificial stone’ increasing by 216.8%, from EUR the export of towers and lattice masts of iron and steel – 1503%, but
107.2 million to EUR 339.8 million. The top 5 most domestically sold from a low value of 4 million in 2010 to 64 million in 2016. The top 5
construction products, both in Sweden and the EU, are presented in most exported construction products from Sweden and the EU-28 are
Table 3. These made up 75.4% of all Swedish construction products summarised in Table 4. Together, these made up 60.2% of all construc-
sales in 2015. tion product exports in 2016.
Table 3: 5 most domestically sold construction products in Sweden Table 4: 5 most exported construction products in Sweden and in the
and in the EU in 2016 EU in 2016
Sweden EU-28 Sweden EU-28
Product Value Share in Product Product Value Share in Product
(EUR m) construction (EUR m) construction
product product
domestic domestic
sales (%) sales (%)
Prefabricated wood- Other Other structures, etc. Ceramic tiles
en buildings 1,546 29.3 structures (group 251123) 208 19.1 and flags
(group 162320) (group 251123) (group 233110)
Windows, French Doors, Assembled parquet Other structures
795 15.1 panels (group 191 17.6 (group 251123)
windows, etc. (group windows, etc.
162311) (group 251210) 162210)
Tiles, flagstones,
bricks, etc. (group Ready-mixed Windows, French win- Marble, etc.
236111) 626 11.9 concrete dows and their frames, 105 9.7 (group 237011)
(group 236310) doors and their frames
and thresholds, of
Ready-mixed con- Prefabricated wood (group 162311)
crete (group 236310) 525 10.0 buildings
of metal
(group 251110) Prefabricated wood- Prefabricated
en buildings 76 7.1 buildings of
(group 162320) metal (group
Other structures Windows, French 251110)
491 9.3
(group 251123) windows and
their frames
(group 162311) Builders’ joinery and Builders’ joinery
carpentry, of wood, 73 6.7 and carpentry
n.e.c. (group 162319) (group 162319)
Source: PRODCOM, 2017. Source: PRODCOM, 2017.
In terms of cross-border provision of construction services,
Sweden exported EUR 987.9 million worldwide in 2016, 57.6% higher
than in 201012 (EUR 626.9 million). Specifically, 61.5% of exports (EUR
598.8 million) were made to the EU-28, up by 68.3% compared to 2010
(EUR 355.1 million). In the same period, the value of exports to coun-
tries outside the EU- grew by 43.6%, from EUR 271.8 million in 2010 to
EUR 390.1 million in 2016. In parallel, Sweden imported a total of EUR Cross-border provision of
1,417.1 million in construction services in 2016, a 67.2% increase since construction services exportation
2010 (EUR 847.5 million), with EUR 1,212.5 million from EU-28 countries
(i.e. 85.5% of imports). Sweden therefore reported a trade gap of EUR
429.3 million in 2016.
8Country Fact Sheet Sweden
Access to finance in the Moreover, interest rates on mortgages fell from 4.91% in 2010 to
3.94% in 2016 (Figure 11), and total outstanding residential loans to
construction sector
households increased by 28.2%, from EUR 292.2 billion in 2010 to EUR
In 2017, around 10% of total bank lending went to firms with commer- 374.8 billion in 2015, further supporting the increasing demand for
cial property activities in some form, including lending to tenant- housing.
owner associations. The major Swedish banks have extensive expo-
sures to real estate companies, which constitute more than 20% of
their total lending and thus are the second-largest individual exposure
after mortgages13. To facilitate access to finance for developers, partic-
ularly smaller ones, and support housebuilding, the National Board of
Housing, Building and Planning (Boverket) offers credit guarantees to Interest rates on mortgages
banks and other lenders to protect them against losses, thus reducing
the need for final financing or own capital for property developers.
The guarantee covers up to 90% of the market value of the completed
residential project14. Figure 11: Mortgage rates for loans for over 5 years original
maturity (%)
The results of a 2017 government analysis of access to finance did not
find sufficient evidence to confirm that lack of access to finance is an
obstacle to housing construction in general, although difficulties in
obtaining external funding can be an obstacle in smaller municipalities
outside the metropolitan regions15. The investigation estimates that
the causes of existing financing difficulties or potential contraction in
lending can be found in:
• The Basel rules, which mean that banks need higher capital adequacy
for small and medium-sized companies.
• Small projects in weaker markets are not prioritized by banks, even if
there is a repayment ability and sometimes there is no bank with local
knowledge, which leads to risk premiums or denied loans.
• Smaller players often lack equity - even after small investments into Source: ECB MFI Interest Rate Statistics, 2017.
new construction projects, it may take several years to rebuild the
equity and be able to make further investments.
• Smaller operators may need external financing already during the
design phase, which can be hard to obtain. This is the case in particular
for builders’ associations and cooperative tenant associations.
Over the last 20 years, Sweden has built about
• There is reluctance amount some banks to finance housing construc- half of what other EU countries have, with
tion with cooperative tenancy. construction of new residential buildings falling
by 28% in 2009 after the crisis and reaching
Access to housing 19,500 units in 2010.
The number of households in Sweden reached 4.8 million in 2016,
a 8.2% increase since 2010 (4.5 million). Furthermore, the country has
a high urbanisation rate, with 34.6% of the population living in cities. Over the last 20 years, Sweden has built about half of what other EU
Together with the general population growth and increasing mean countries have, with construction of new residential buildings falling
annual equivalised net income (SEK 259,220 - EUR 27,332 in 2015), by 28% in 2009 after the crisis and reaching 19,500 units in 2010. This
these figures highlight the growing demand and ensuing need for is about 53.6% lower than the 42,000 dwellings built annually between
new residential properties. 1980 and 199016. In 2016, the number of new dwellings started in new
residential buildings amounted to 63,100, a 34% increase compared to
the 47,209 dwellings started in 201517, with completions amounting to
42 44118. The National Board of Housing (Boverket) has estimated that
housing construction will increase by 18 percent in 2017, with 76,000
new dwellings started. The board’s forecasts show that in the years
2017-2025, 600,000 homes will need to be built19.
Number of households
9European Construction Sector Observatory
The generally low supply of dwellings coupled with high demand has One area of concern is the current rental regulation, which keeps rental
resulted in a surge in house prices (Figure 12). Namely, the house price prices affordable and often below market levels, thus resulting in low
index for total dwellings has increased by 47.1% between 2010 and rental yields and discouraging developers from building properties for
2016 and 8.6% between 2015 and 2016 alone. This represents partic- lease. This is a subject for debate between industry stakeholders (devel-
ularly the situation in large cities such as Stockholm, Göteborg and opers and landlords) and trade unions, with the latter believing that
Malmo. While this rapid house price growth is partly driven by strong introducing market pricing would not necessarily boost the construc-
fundamentals, valuation indicators suggests that house prices are tion of new dwellings, but rather make properties unaffordable for
overvalued by about 35 % — among the highest levels in the EU20. current tenants. There is a particular shortage of rental apartments
However, the greater supply of residential properties in 2016 and 2017 in larger cities; this, in turn, pushes households who might otherwise
has already contributed to a slow-down in house price increases. wish to rent into home ownership, thus exacerbating the shortage (and
upwards price pressure) in the owner-occupied market as well23.
The greater supply of new residential properties contributes to
increasing household debt, as ownership of new homes is largely In 2016, 65.2% of the Swedish population owned their property.
financed through loans to both households and tenant-owner associ- This rate increases to 71.7% for the population whose income is above
ations. The level of indebtedness of Swedish households is consider- 60% of the median equivalised income, but drops to only 31.7% for
ably above the international and EU average. Household indebtedness those below this threshold, one of the lowest reported values. Indeed,
has continued to rise from already high levels and grew by 7.1 % in for this income group, the proportion of tenants has been increasing,
2016, approaching 86% of GDP and about 180 % of disposable income, from 60.2% in 2010 to 68.3% in 2016, signalling housing affordability
driven mainly by higher mortgage borrowing linked to continued issues. However, the housing cost overburden rate24 was at 8.5% in
house price rises. The distribution of debt levels is becoming increas- 2016, below the EU-28 average of 11.1%25. Similarly, the overcrowding
ingly uneven, with a growing fraction of newly mortgaged households rate26 in 2016 was at 14.4%, below the EU-28 average of 16.6%, but
borrowing as much as 600 % of their disposable income. Other than one of the highest in Western Europe27. Finally, the severe housing
the ongoing supply shortage, the key drivers for the rise in household deprivation rate28 was 2.7% in 2016, below the EU-28 average of
debt include generous tax treatment of home ownership and mort- 4.9%, but increased compared to previous years and higher than that
gage debt, accommodative credit conditions coupled with relatively of neighbouring countries and Western Europe in general29.
low mortgage amortisation rates21.
The significant exposure of the Swedish economy to the housing Infrastructure
market makes it vulnerable to shocks22.
According to the 2016-2017 Global Competitiveness
Report, Sweden ranked 20th out of 138 economies in
Figure 12: House price index in Sweden over 2010-2016
terms of its infrastructure30.
(2015=100)
Namely, it performs best in terms of the quality of its port (13th) and
overall (18th) infrastructure. Conversely, it ranks comparatively worse
with respect to the quality of its roads (21st), quality of air transport
infrastructure (22nd) and quality of railroad infrastructure (30th), sug-
gesting that further investment is required for its improvement. As
discussed in TO 1 - Investment conditions and volumes, the Swedish
government identified the latter as a priority for investment, which
can in turn stimulate the construction of residential buildings and
thus offset the housing shortage.
Source: Eurostat, 2017.
10Country Fact Sheet Sweden
4
Key issues and barriers in the
construction sector
Company failure Late payment
The business demography in the broad construction sector has gener- Late payments with regard to the Public Administra-
ally seen an increase in the number of company births and a stabilisa-
tion are not a significant issue in Sweden, compared
tion in the number of deaths across most sub-sectors between 2008
to other countries (e.g. Italy, where the PA pays con-
and 2014, despite some fluctuations. Company births in narrow
construction experienced a 16.2% growth, from 6,294 to 7,311 over tractors with a 112-day delay).
2008-2014, whereas company deaths increased by 36.4%, from 4,435
to 6,049. Company births in real estate activities increased by 6.2%, The Swedish authorities reported an average payment delay of 4 days
from 3,048 in 2008 to 3,238 in 2014, whereas the number of deaths in 2017, according to the European Payment Report 2017, settling
decreased by 5.5%, from 2,032 to 1,920. Similarly, the architectural their invoices within 33 days, compared to the 29-day payment terms
and engineering activities sub-sector experienced a 3.3% increase in extended by businesses on average. However, 65% of Swedish busi-
company births (from 2,288 in 2008 to 2,363 in 2014), whereas deaths nesses reported being pressured to accept longer payment terms
remained stable (2,007 in 2014)31. than they are comfortable with, with 34% accept such payment terms
unconditionally. The payment terms granted to B2B customers in
Company births in narrow construction 2017 stood at 28 days (no change from 2016), with the actual time
evolution 2008-2014 required by customers to pay amounting to 32 days and resulting in
a 4-day delay (compared to 3 day in 2016). The main causes of late
payments are considered to be intentional delays and administrative
Company deaths in narrow construction inefficiency36.
evolution 2008-2014
As regards the construction sector specifically, it is characterised by
In 2017, the Swedish construction sector reported 1,240 bankruptcies, payment terms that at the average level for all sectors (28 day). Out of
up by 16.0% from 201532. Conversely, the number of bankruptcies in the 0.7% of all B2B sales that were categorised as uncollectable in 2017,
the real estate sector amounted to 123 in 2016, down by 6.6% from the largest shares originated from the consumer durables, business
the number in 201533. According to the construction industry repre- services and construction sectors37.
sentatives, this is connected to lower demand for renovation works,
due to changes to the tax rules regarding tax deduction on renovation Time and cost of obtaining building
expenditure34. permits and licenses
Trade credit Sweden ranked 25th out of 190 countries in 2016 in
terms of ‘dealing with construction permits’, accord-
After a sharp increase in sales on credit terms in 2016 (55.8%), the total ing to the World Bank’s Doing Business Report 2017,
value of B2B sales on credit in Sweden decreased again in 2017 slightly worse than 2015 (23rd)38.
(47.8%). On average, 52.1% of the sales to domestic B2B customers
were transacted on credit, while the share of sales on credit to foreign
B2B customers is 43.5%. Compared to Western Europe (domestic: 7 procedures and 116 days are required to complete administrative
42.6%; foreign: 35.1%), Sweden maintains a credit-friendly approach35. formalities to build a warehouse, which is shorter than the OECD
high-income average (12.1 procedures and 152.1 days, respectively).
Nevertheless, the cost of building a warehouse represents 2.1% of the
11European Construction Sector Observatory
value of the warehouse, above the OECD high-income average of 1.6%.
Specifically, obtaining a building permit takes 60 days and costs SEK Job vacancies in the construction
92,000 (EUR 9,858) (Table 5). sub-sector evolution 2009-2015
Table 5: Construction procedures timing and costs in Sweden
Sweden is experiencing a slight skills shortage in the narrow construc-
tion sector, both for blue and white-collar workers. The Swedish Migra-
Time to Associated tion Board regularly updates the list of occupations experiences labour
Procedure
complete costs shortages and in January 2018 it included architects, surveyors, civil
engineers, bricklayers, roofers, floorers, scaffolders, painters and
Hire an external certified 1 day
SEK 180,000 concrete workers39. Currently, the proportion of foreign workers in the
supervisor
(EUR 19,268) construction industry is lower than in other industries, but the differ-
ences have declined over time. For the most part, foreign workers in
Hold technical consultation the construction sector hold EU nationality. In small businesses with
15 days no charge
meeting with Building Commit-
tee of the Municipality fewer than 50 employees, foreign workers account for 12.7 percent
of the workforce, compared to 8.6 percent in the larger companies40.
Obtain building permit 60 days SEK 92,000
(EUR 9,858) The skills shortage is expected to increase in the coming years, due to
growing investments in construction, coupled with high retirement
Receive decision to com- rates in the sector. The Construction Industry Association has assessed
5 days no charge
mence construction that 50,000 new employees will be need over a five-year term solely
because of aging. Further needs arise due to the projected construc-
Submit supervisor’s report and tion of 600,000 new dwellings by 2025 and the infrastructure projects
10 days no charge
hold final consultation meeting outlined in the national transport plan 2018-202941.
Obtain water and sewerage 25 days SEK 190,000
connection (EUR 20,333)
Sector & sub-sector specific issues
Obtain final certificate 10 days no charge
Material efficiency and waste management
Source: Doing Business overview for Sweden, Word Bank, 2017.
Around 9.4 million tonnes of construction and dem-
olition waste were generated in 2014, of which 8.9
Skills shortage
million tonnes came from construction.
Job vacancies in the construction and real estate sectors experienced
an increasing trend since 2009. In the construction sub-sector, they Approximately 800,000 tonnes of the waste was classified as hazardous
soared by 155.2% between 2009 and 2015, from 1,534 to 3,914, while and consisted primarily of contaminated soil masses (590 000 tonnes),
in the real estate sub-sector grew by 146.4%, from 520 in 2009 to 1,281 mineral waste in the form of contaminated concrete, brick, asphalt,
in 2015. Moreover, the number of tertiary students in engineering, etc. (130 000 tonnes) and impregnated wood waste (50 000 tonnes).
manufacturing and construction, and specifically in architecture Non-hazardous waste amounted to almost 8.6 million tonnes and
and building, has been increasing continuously since 2008, growing by consisted mainly of soil masses (5.1 million tonnes), mixed construction
68.4% from 2,173 in 2008 to 3,660 in 2014. Likewise, adult participa- and demolition waste (1.7 million tonnes), dredging spoils (1.2 million
tion in education and training has been on the rise. In the construc- tonnes), metal waste (330,000 tonnes) and wood waste (200,000
tion sub-sector, it went from 15.1% in 2008 to a peak of 18.9% in 2016. tonnes). The largest amounts of construction and demolition waste
In real estate activities, adult participation in education and training were used as construction materials, refills and landfill coverage (4.2
grew from 24.7% in 2010 to 27.6% in 2016. million tonnes), followed by landfill (2.4 million tonnes). 1.2 million
tonnes of dredged spoils were dumped at sea, in the figure called
From 2,173 in 2008 to 3,660 in 2014. Likewise, adult participation “Other disposal” and about a million tonnes went to pre-treatment /
in education and training has been on the rise. In the construction sorting. Soils, concrete and rock were the types of waste deposited to
sub-sector, it went from 15.1% in 2008 to a peak of 18.9% in 2016. In landfills to the greatest extent42.
real estate activities, adult participation in education and training grew
from 24.7% in 2010 to 27.6% in 2016.
12Country Fact Sheet Sweden
Climate and energy
The Waste management plan for 2012-2017 published by the Swedish
Emissions of greenhouse gases carbon monoxide and dioxide,
Environmental Protection Agency emphasises the need for improved
methane, nitrous oxides and particulate matter) from activities in
waste statistics and improved Construction and Demolition (C&D) waste
the construction and real estate sub-sectors amounted to 2,224,930
management, namely recycling43. The Swedish Construction Federation
tonnes and 269,638 tonnes in 2014, respectively. The former have
published updated guidelines to improve the management of resources
increased by 6.6% since 2008, whereas the latter have experienced a
and C&D waste during construction and demolition activities44.
12.4% decline.
13European Construction Sector Observatory
5
Innovation in the
construction sector
Innovation performance Business enterprise R&D expenditure (BERD)47 in
the broad construction sector in the professional
scientific and technical activities sub-sector
Sweden is considered an Innovation
Leader, according to the European Inno-
vation Scoreboard 2016, reporting the
best innovation performance in the EU
in 2016 and having increased its perfor-
mance by 2.3% relative to that of the EU In parallel, the total R&D personnel (full-time equivalents – FTE48) in
in 201045. the broad construction sector also experienced a growing trend. In
line with the positive evolution of the BERD, the professional, scien-
tific and technical activities sub-sector reported the highest FTE, which
amounted to 2,988 in 201149. Likewise, total FTE in the construction
The country performs above the EU average for all dimensions, such as sub-sector increased by 15.7% over 2009-201350, from 153 to 177.
Open, excellent and attractive research systems, Linkages and Entre-
preneurship and Human resources. Specifically, its strongest indica- Moreover, there has been a slight increase in the annual average
tors are International scientific co-publications, Lifelong learning, New number of construction related patent applications in recent
doctorate graduates, R&D and innovation expenditure, Public-private years. In fact, over 2000-2007, an average of 93.5 patents were filed in
co-publications, and patent applications. On the contrary, its relative the European Patent Office (EPO) and United States Patent and Trade-
weaknesses are in the Sales share of new product innovations, Private mark Office (USPTO). This increased to 95.8 in the period 2008-2016,
co-funding of public R&D expenditure and Venture capital investments. with the year 2011 reporting the highest number of applications (117).
Business enterprise R&D expenditure (BERD)46 in the broad Fourteen Swedish construction-related firms ranked amongst the
construction sector has shown a generally increasing trend over top 1,000 EU companies by R&D spending, including two firms in the
the past years. The professional, scientific and technical activities Construction & Materials sector.
sub-sector experienced a 172.1% soar between 2007 and 2013, from
EUR 166.4 million to EUR 452.6 million, the highest across the sub-sec- To foster sustainable innovation the Swedish construction sector
tors. Similarly, BERD in the construction sub-sector increased by 76.9%, and increase its productivity and efficiency, the Swedish Innovation
from EUR 16.0 million in 2009 to EUR 28.3 million in 2013. Agency VINNOVA and a consortium of companies and universities are
carrying out the programme Construction Innovation 2011-2016
(Bygginnovationen 2011-2016), aiming to promote the commercial-
isation of research results by supporting the adoption of innovative
ICT and green growth solutions. With a total budget of SEK 90 million
(EUR 9.7 million), the programme’s funds target primarily construc-
tion SMEs engaging in R&D activities and their commercialisation51.
The programme has been extended until 2018, with a budget of SEK
7 million (EUR 737,735) per year from Vinnova, matched by the same
amount from industry partners52.
14Country Fact Sheet Sweden
Furthermore, industry operators, along with the Swedish Energy Eco-innovation and digitalisation
Agency, run a series of innovation clusters: LÅGAN is for buildings
with very low energy consumption; BELOK is a cluster for nonresiden-
tial premises; BeBo is an innovation cluster for owners and managers According to a study by VINNOVA, major construction companies
of apartment buildings; BeLivs is an innovation cluster of grocery in Sweden focus mainly on eco-innovation, particularly associated
premises; and BeSmå groups together house builders. Two new inno- with products and organisational processes, which account for 30%
vation clusters began operating in 2016. They are Innovationskluster and 20% of the innovative measures adopted by the companies,
för energieffektiv sjukvård [Innovation Cluster for Energy-Efficient respectively55. These include the construction of energy efficient and
Medical Care] and Innovationskluster Hållbart samhälle [Innova- carbon-smart housing (e.g. LEED-certified), but also internal measures
tion Cluster Sustainable Society]. The innovation clusters have mainly aiming to improve the environmental performance and footprint of
affected energy efficiency of the building stock by promoting the the companies themselves. For instance, the major construction firms
development of new solutions and applying and demonstrating new use energy efficient insulation and ventilation, as well as renewable
knowledge and technology. Experience and expertise is disseminated energy (wind and solar) to power their activities. As for R&D activities,
by bringing together industry operators in the clusters53. construction companies are active in the development of sustainable
products, such as long-life asphalt.
The Swedish Energy Agency also invests in research in the field of
buildings in the energy system through a range of programmes The Swedish Research Council (Formas) is responsible for funding
focusing on energy-efficiency in buildings, heat pump research and research under Sweden’s National Research Program for Sustainable
district heating research54. Spatial Planning56 and the strategic innovation programme Smart
Built Environment. Smart Built Environment is a plan for embracing
the new opportunities of digitalization and promoting the develop-
ment of intelligent, sustainable cities, efficient resource management
and reduced carbon emissions57. In 2017, the Council granted 6,3
million SEK under the plan to projects within e.g. machine learning,
genetic algorithms and artificial intelligence to support construction
processes58.
15European Construction Sector Observatory
6
National & Regional Policy &
Regulatory Framework
Policy schemes The government has also proposed the Planning and Building Act on
temporary building permissions for portable building for housing
The main policy schemes introduced by the Swedish purposes (proposal 2016/17:137), which will make it possible to use
government in the recent years aim at addressing temporary housing to augment permanent construction when the
the structural undersupply of dwellings and the housing need cannot be fully met through ordinary planning and
building processes by issuing permits with a validity of 15 years62.
long-standing barriers to the efficient functioning of
the housing market in Sweden, such as shortage of
The government has also taken measures to address the increasing
rental apartments and rigid rental regulations, lack of concern about the growing indebtedness of households due to mort-
developable land, cumbersome zoning and building gages (see Access to housing). As of June 2016, mortgage loans over
regulations, and differing standards at municipal 50% of the value of the property have had to be amortised (i.e. paid
level. back) at 1% every year, while loans worth 70% or more of the property’s
value must be amortised at 2% annually. This measure was introduced
as a macro-prudential measure to offset a potential housing crisis63.
The government has recognised that the long building planning In 2017 Sweden’s financial supervisory authority Finansinspektionen
process can slow down the construction of new housing units, as proposed a new amortization requirement for new housing loans. The
municipalities used to be able to increase the requirements on permits, so-called “debt ratio brake” (skuldkvotsbroms) requires households
such as accessibility and energy efficiency requirements. This therefore that borrow more than 4.5 times their gross income to amortize their
led to greater costs and a reduction in profitability59. The Planning and debt at a faster pace. The authority estimates that about 15 percent of
Building Act passed in 2010 and further amended with Government new borrowers would be affected by the tightening of amortization
Bill 2013/14:126clarified that municipalities are no longer allowed to requirements. Apart from increasing households’ resilience to macro-
increase the requirements, thereby improving the efficiency of the economic disturbances, the measure is expected to lead to a slight
planning process. decline in housing prices, favouring buyers who want to enter the
housing market for the first time64. The Swedish Construction Industry
In June 2016, the government also introduced a series of 22 measures Association has warned that the measure will lead to slow down in
to increase housing construction. For instance, one of the measures housing construction65.
foresees the sale of public land for residential construction. More-
over, the exemption of certain construction works (e.g. construction The government has continued its reform efforts by commissioning
of shelters for public transport, roof replacement, façade works, etc.) a series of inquiries and reviews on the Planning and Building Act
from obtaining the building permit will be considered for extension and related regulations, the results of which will inform further policy
to other activities, and further simplifications to the planning process revisions that can address the remaining challenges in the Swedish
will be evaluated60. Indeed, in early 2017, the government presented a housing market and the needs for infrastructure development66.
proposal aimed at further streamlining and simplifying the Plan-
ning and Building Act. The proposal contains measures to help In parallel, the government has introduced a series of measures stim-
freeing up resources, including for instance a deadline for counties’ ulating investment in construction. In order to address the housing
waiver decision over municipal zoning matters and further exemp- shortage, the government introduced the Stimulus for increased
tions from the requirements of building permits for works such as construction (Stimulans för ökat byggande/ Investeringsstöd)
external cladding or smaller interventions such as construction of in 2015, as part of the 2016 budget. Under the responsibility of the
balconies or bay windows. These simplification actions are welcomed Ministry of Enterprise and Innovation, this initiative sought to provide
by the Swedish Construction Federation as a step forward, although incentives to increase construction of new properties destined for the
measures to improve the mobility in the housing market and support rental market, particularly in urban areas with high population growth/
home ownership for lower-income households whilst counteracting housing pressures (Stockholm, Göteborg and Malmo). The budget
household debt are necessary to tackle the housing shortage61.
16Country Fact Sheet Sweden
amounts to SEK 2.2 billion (EUR 227.1 million) for 2016, SEK 2.7 billion Building and Civil engineering and Installation Work” (AB04) or the
(EUR 278.8 million) for 2017, SEK 3.2 billion (EUR 330.4 million) for 2018 “General Conditions of Contract for Building, Civil Engineering and
and SEK 3.2 billion for 2019, reaching a total of SEK 11.3 billion (EUR 1.2 Installation work performed on a package deal basis” (ABT06). The
billion). An additional SEK 300 million (EUR 31 million) was intended liability covers the design, plan, build and guarantee period, which
specifically for the construction of student dwellings in 201667. The is usually 5 years for non-conformity to the contract and 10 years for
programme, which entered into force in January 2016, aims to achieve important defects if it is proved to be negligent74.
the construction of 15,000 new flats per year68.
The Law on Construction Defects Insurance requires that all buildings
In 2017, the government also introduced a state
that are intended for permanent habitation must carry this insurance,
subsidy to municipalities to increase housing which covers material damage caused by faulty materials, design or
construction in view of the population increase works execution within 10 years from the certificate of completion.
and new arrivals as well as the increased housing This Law was repealed in July 2014 through provisions in the Law
demand. on Completion Coverage, which requires contractors to be covered
through insurance or a bank guarantee. It applies to small buildings
intended for permanent habitation. In addition to the mandatory
The subsidy is administered by the National Board of Housing, Building insurance above, there are other securities and warranties offered on
and Planning (Boverket) and in 2017 was granted to 199 municipalities. a voluntary basis.
In 2017, the subsidies amounted to SEK 1.8 billion, with further allo-
cation of up to 1.3 billion in subsidies per year69. The contribution will
later be allocated between eligible municipalities. Interest in govern- Building regulations
ment support for housing construction has increased sharply, from 114
municipalities that applied 2016 to 204 municipalities in 201770. Sweden’s National Board of Housing, Building and Planning (Boverket)
governs the regulatory landscape for all building works. The main
regulations and legislation in the construction sector are detailed in
In order to improve the availability of dwellings
the Boverket’s Building Regulations (BBR)75. These cover mandatory
for the elderly in response to the predicted ageing requirements for accessibility, dwelling design, ceiling height and
population, in 2016 the government introduced a utility rooms, as well as general rules for buildings, mechanical resis-
scheme providing grants for the construction and tance and stability, fire safety, hygiene, health and environment, noise
adaptation of dwellings for the elderly population. protection and energy performance. The design regulations (BKR)
cover areas such as load bearing structures, geo-structures, timber,
masonry, concrete, steel, aluminium structures and fire resistance
For new constructions, the amount of the support can reach SEK 3,600 requirements.
per m2 (EUR 380.2) (with the maximum floor area depending on the
number of residents), whereas for renovation and adaptation works The BBR set mandatory performance requirements for both residential
the limit is SEK 3,200 per m2 (EUR 337.9) and SEK 200,000 (EUR 21,122) and non-residential buildings, depending on their location and type
per building, respectively. Beneficiaries include both private property of heating system involved76. The BBR cover requirements related to
owners, as well as municipalities, construction companies and housing the thermal transmittance of the building envelope and encourage
associations71. The budget of the programme amounts to SEK 300 efficient design of the energy consuming systems, including HVAC
million (EUR 31 million) for 2017 and SEK 400 million (EUR 41.3 million) (heating, ventilation, air conditioning), hot water, lighting, auxiliary
per year for the period 2018-202072, for a total of SEK 1.5 billion (EUR systems, as well as materials and products. Compliance with the
155 million). Another measure aimed at improving the housing situa- requirements is verified through measuring the actual energy use of
tion of the elderly is the increased housing allowance as of 1 January the finished building and showing it to be less than or equal to the
2018, which is available pensioners with pension and other income of allowable energy frame predicted at the design stage. Enforcement
less than SEK 15,000 per month after tax73. of the BBR is ensured by on-site inspections during construction
and post-occupancy. The building’s energy consumption should be
measured over a continuous period of 12 months, to be completed
Insurance and liability related regulations within 24 months after the building is put in use77. Through these
measurements, any gap between the designed and as-built perfor-
The liabilities of the different parties involved in a construction project mance of the building can be identified and corrected. In general, in
are principally defined in a contractual fashion. The standard forms of Sweden the awareness of performance issues at the construction site
contracts are drafted by the Construction Contracts Committee level is very good, although maintenance of an airtightness layer in
BKK (Byggandets Kontraktskommitte). A large percentage of high-performance buildings remains challenging78.
contracts in Sweden are based on “General Conditions of Contract for
17European Construction Sector Observatory
7
Current Status & National
Strategy to meet Construction
2020 Objectives
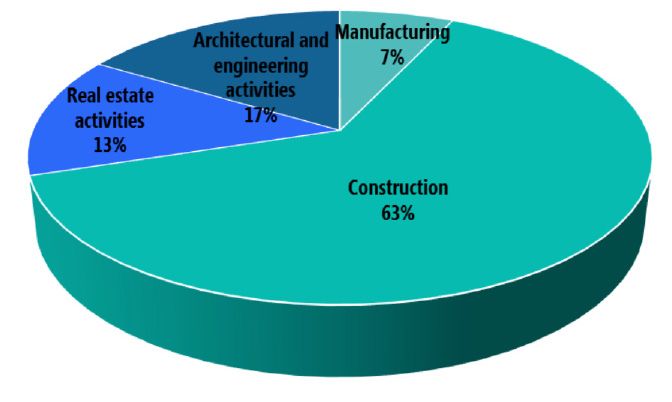
TO 1 - Investment conditions and volumes Following steady investment levels in 2010-2013, investment in
construction80 has been experiencing a strong growth ever since,
Total investment by the broad construction sector79 has shown surpassing the 2010 level by 30.1% in 2016 (Figure 14). In line with
diverging trends over the past years (Figure 13). Indeed, despite an the high demand for housing (see Access to housing), investment in
initial 15.8% drop between 2008 and 2009, investment by real estate dwellings grew by 51.1% om 2016 compared to 2010. Investment in
activities experienced a 10.1% increase over 2008-2015, growing from non-residential construction and civil engineering grew at a slower rate
EUR 22.1 billion to EUR 24.3 billion. Conversely, investment by the and its 2016 levels were 15.0% higher than 2010. In absolute terms,
construction sub-sector fell by 31.1% over 2008-2009 and, although investment in the construction sector totalled EUR 40.9 billion in 2014,
it has been recovering since, it reached EUR 2.7 billion in 2015, i.e. still out of which EUR 17.3 billion was invested in dwellings and EUR 23.6
5.3% below the EUR 2.8 billion recorded in 2008. In terms of invest- billion was devoted to non-residential and civil engineering81 82.
ment in intangible assets, the construction sub-sector invested EUR
76.9 million in intellectual property products in 2015, 6.7% lower than
2008 (EUR 82.4 million), whereas the real estate sub-sector invested Figure 14: Investment in the Swedish construction sector between
EUR 121.4 million, 35.0% higher than 2008 (EUR 89.9 million). 2008-2016 (2010=100)
Investment by real estate activities
evolution 2008-2015
Investment by the construction
sub-sector evolution 2008-2015
Figure 13: Investment by the Swedish broad construction
industry between 2008-2015 (EUR m)
Source: AMECO, 2017.
Total inland infrastructure investment as a share of GDP was 0.7%
in 2014, slightly lower than the 0.9% peak recorded in 2009. Despite
some fluctuations, annual investment in rail infrastructure in Sweden
was 3.2% lower in 2015 (EUR 1,387 million), compared to 2010 (EUR
1,433 million). On the contrary, the country saw a 11.6% increase in its
road infrastructure investment in 2015 compared to 2010, EUR 1,861
million and EUR 1,667 million respectively. Investments in air trans-
port infrastructure grew steadily over the period and in 2015 stood at
Source: Eurostat, 2017. 131 million, more than double the investments made in 2010 (EUR 78
million) In parallel, annual investment in infrastructure maintenance
has been growing, especially in the case of road infrastructure, which
was 35.3% higher in 2015 compared to 2010 and rail infrastructure
(+25.8%). However, there was a decrease in annual investment in air
Total inland infrastructure transport infrastructure, which in 2015 stood at EUR 12 million, about
investment as share of GDP half of the amount invested in 2010.
18Country Fact Sheet Sweden
Despite an initial 8.0% decline over 2008-2009, household reno- In addition, Sweden is also focusing on investments in healthcare,
vation spending has seen an increasing trend since then. Indeed, it due to the projected increase in the proportion of the elderly popu-
reached EUR 866.2 million in 2015, 26.1% above the EUR 686.9 million lation. Consequently, the government is investing in the construction
registered in 2008, and accounting for 0.4% of household disposable of hospitals, with recent projects including the New Karolinska Solna
income, comparable to 2008. University Hospital in Stockholm, due for completion in 2018 and with
a value of SEK 14.5 billion (EUR 1.6 billion)91. Moreover, Sörmland
Having identified the link between public sector investments in infra- County Council is also planning the refurbishment and extension of
structure and residential housing investments, the Swedish govern- three hospitals in Södermanland by 2023, under a SEK 3 billion (EUR
ment is actively investing in the civil engineering field. In particular, the 323.6 million) contract92.
transport network was the focus of investment under the 2014-2025
national transport plan, which had a budget of SEK 522 billion (EUR Finally, infrastructure investments in Sweden benefit from extensive EU
56 billion)83. This constitutes a 20% increase compared to the previous support, with EUR 1.4 billion from the Cohesion funds dedicated to
plan. Of these, SEK 86 billion (EUR 9 billion) was foreseen for the main- environment protection and resource efficiency and EUR 152.9 million
tenance and operation of the rail network and SEK 155 billion (EUR 17 to network infrastructures in transport and energy over the period
billion) for the operation and maintenance of roads. The remaining SEK 2014-202093. Moreover, the EIB invested EUR 1.7 billion in the Swedish
281 billion (EUR 30 billion) was allocated for new transport projects, economy in 2016 alone, with infrastructure projects accounting for
including a high-speed rail line between Stockholm and Linköping, 38% of the total commitments94. For instance, in 2016, under the Euro-
and the expansion of other railway tracks84. pean Fund for Strategic Investments (EFSI)95, the EIB supported the
construction of a wind farm through a EUR 16 million co-investment,
The 2017 budget further strengthens the government’s financial the first renewable energy infrastructure project to be backed by EFSI.
commitment to support investment in transport infrastructure. Indeed, In February 2017, under EFSI, the EIB also signed a SEK 900 million (EUR
the new infrastructure bill Infrastructure for the future – innova- 95.1 million) agreement to support investment in local infrastructure
tive solutions for strengthened competitiveness and sustain- in the Nordic countries through the “Infranode I” investment platform,
able development (Investering i framtiden- innovativa lösningar focusing mainly on utilities, renewable energy, social and transport
för stärkt konkurrenskraft och hållbar utveckling) was introduced infrastructure projects96.
in October 2016, proposing an increased financial framework for trans-
port infrastructure investments for the 2018-2029 period85. Thus, the
TO 2 – Skills
new budget amounts to SEK 622.5 billion (EUR 65.8 billion) i.e. SEK
100 billion more than the 2014-2025 plan. In particular, the allocation
for the operation and maintenance of the railway network will see a
47% increase compared to the previous plan, amounting to SEK 125 The employment rate of VET graduates
billion (EUR 13.2 billion). The allocation for the operation and mainte- stood at 81.6% in 2015, one of the highest in
nance of roads will be increased to SEK 164 billion (EUR 17.3 billion).
the EU. Nevertheless, participation of upper
The remaining SEK 333.5 billion (EUR 35.2 billion) will be devoted to
new transport projects86. In 2017, the government issued a mandate
secondary students in VET is decreasing,
for an analysis of the commercial conditions for traffic on new high- and the transition between the different
speed railways from Stockholm to Gothenburg and from Stockholm training pathways (e.g. upper secondary
to Malmö and the negotiations of the financing for the construction school, adult education, the apprenticeship
of the infrastructure87. system and training for the unemployed)
remains challenging97.
Indeed, investments in transport infrastructure, namely roads, rail-
ways and metro lines, can have positive repercussions on the housing
supply in the medium term. Improved connectivity within and between
urban areas facilitates commuting in these areas, thus opening up The Swedish vocational education (VET) system is well developed,
additional zones for new residential developments, relieving the with dual education programmes combining practical work experi-
competition and ensuing housing shortage in urban areas88. ence with theoretical teaching having been introduced and boasting
good participation among employers. The employment rate of
Within this context, the Swedish County Administrative Boards are VET graduates stood at 81.6% in 2015, one of the highest in the EU.
responsible for the development and adoption of regional transport Nevertheless, participation of upper secondary students in VET
infrastructure development plans. For instance, the plan to expand the is decreasing, and the transition between the different training path-
metro line network in Stockholm, which had already been supported ways (e.g. upper secondary school, adult education, the apprenticeship
by a SEK 3.5 billion (EUR 400 million) loan from the European Invest- system and training for the unemployed) remains challenging98. Under
ment Bank (EIB)89, is also expected to have a positive impact on the the 2017 budget, SEK 72.4 billion (EUR 7.7 billion) has been allocated to
housing supply in the medium term90. education and academic research, SEK 21.7 billion (EUR 2.2 billion) of
19You can also read