Evaluation of the LOTOS-EUROS NO2 simulations using ground-based measurements and S5P/TROPOMI observations over Greece
←
→
Page content transcription
If your browser does not render page correctly, please read the page content below
Atmos. Chem. Phys., 21, 5269–5288, 2021
https://doi.org/10.5194/acp-21-5269-2021
© Author(s) 2021. This work is distributed under
the Creative Commons Attribution 4.0 License.

Evaluation of the LOTOS-EUROS NO2 simulations using
ground-based measurements and S5P/TROPOMI
observations over Greece
Ioanna Skoulidou1 , Maria-Elissavet Koukouli1 , Astrid Manders2 , Arjo Segers2 , Dimitris Karagkiozidis1 ,
Myrto Gratsea3 , Dimitris Balis1 , Alkiviadis Bais1 , Evangelos Gerasopoulos3 , Trisevgeni Stavrakou4 , Jos van Geffen5 ,
Henk Eskes5 , and Andreas Richter6
1 Laboratory   of Atmospheric Physics, Aristotle University of Thessaloniki, Thessaloniki, Greece
2 TNO,   Climate, Air and Sustainability, Utrecht, the Netherlands
3 Institute for Environmental Research and Sustainable Development, National Observatory of Athens, Athens, Greece
4 Royal Belgian Institute for Space Aeronomy, Brussels, Belgium
5 Royal Netherlands Meteorological Institute (KNMI), De Bilt, the Netherlands
6 Institute of Environmental Physics and Remote Sensing, University of Bremen, Bremen, Germany

Correspondence: Ioanna Skoulidou (ioannans@auth.gr)

Received: 22 September 2020 – Discussion started: 30 October 2020
Revised: 10 February 2021 – Accepted: 23 February 2021 – Published: 6 April 2021

Abstract. The evaluation of chemical transport models,          simulations over both urban and rural locations represent the
CTMs, is essential for the assessment of their performance      diurnal patterns and hourly levels for both summer and win-
regarding the physical and chemical parameterizations used.     ter seasons satisfactorily. The relative biases range between
While regional CTMs have been widely used and evalu-            ∼ −2 % and −35 %, depending on season and relative NO2
ated over Europe, their validation over Greece is limited. In   load observed. Finally, the CTM was assessed also against
this study, we investigate the performance of the Long Term     space-borne Sentinel-5 Precursor (S5P) carrying the Tro-
Ozone Simulation European Operational Smog (LOTOS-              pospheric Monitoring Instrument (TROPOMI) tropospheric
EUROS) v2.2.001 regional chemical transport model in sim-       NO2 observations. We conclude that LOTOS-EUROS simu-
ulating nitrogen dioxide, NO2 , over Greece from June to        lates extremely well the tropospheric NO2 patterns over the
December 2018. In situ NO2 measurements obtained from           region with very high spatial correlation of 0.82 on average,
14 stations of the National Air Pollution Monitoring Net-       ranging between 0.66 and 0.95, with negative biases in the
work are compared with surface simulations over the two         summer and positive in the winter. Updated emissions for
major cities of Greece, Athens and Thessaloniki. Overall        the simulations and model improvements when extreme val-
the LOTOS-EUROS NO2 surface simulations compare very            ues of boundary layer height are encountered are further sug-
well to the in situ measurements showing a mild under-          gested.
estimation of the measurements with a mean relative bias
of ∼ −10 %, a high spatial correlation coefficient of 0.86
and an average temporal correlation of 0.52. The CTM un-
derestimates the NO2 surface concentrations during day-         1   Introduction
time by ∼ −50 ± 15 %, while it slightly overestimates during
night-time ∼ 10 ± 35 %. Furthermore, the LOTOS-EUROS            Nitrogen oxides (NOx = NO+NO2 ) adversely affect human
tropospheric NO2 columns are evaluated against ground-          health, the environment and the ecosystems. Exposure to
based multi-axis differential optical absorption spectroscopy   NO2 is linked with high mortality rates and premature deaths
(MAX-DOAS) NO2 measurements in Athens and Thessa-               (Crouse et al., 2015). NO2 dominates the formation of ozone
loniki. We report that the CTM tropospheric NO2 column          and inorganic aerosols in the troposphere (Seinfeld and Pan-

Published by Copernicus Publications on behalf of the European Geosciences Union.
5270                                                  I. Skoulidou et al.: Evaluation of the LOTOS-EUROS NO2 simulations

dis, 1998) with detrimental effects on the climate and human        ticular meteorological features such as sea and land breeze
health. The deposition of nitrogen leads to eutrophication and      and valley mountain winds affect the air quality of the
acidification (Bouwman et al., 2002). While NOx sources             city (Moussiopoulos et al., 2009). According to Poupkou et
can be either natural (soils, wildfires and lightning) or anthro-   al. (2011), road transport and industrial emissions are the two
pogenic (fossil fuel combustion, industrial emissions, and          main sources of NOx emissions at the greater area of Thes-
emissions from road and non-road transport) (Miyazaki et            saloniki, while the majority of industrial activity is concen-
al., 2017), it is estimated that human activities are respon-       trated in the west and north-west part of the city (industrial
sible for 65 % of the global annual NOx flux (Müller and            area). Furthermore, in the east of the city, the second largest
Stavrakou, 2005).                                                   airport of Greece, Macedonia International Airport (airport),
   Chemical transport models, CTMs, play an important role          is situated.
in air pollution assessment by providing interpretation and            In this work, the NO2 simulations of the Long Term Ozone
forecasting on air quality, based on emission inventories and       Simulation European Operational Smog (LOTOS-EUROS)
atmospheric processes. CTMs are widely used serving dis-            CTM are evaluated over Greece through detailed compar-
tinct purposes, for instance the study of regional air quality or   isons with ground-based measurements and space-borne
transboundary pollution (Terrenoire et al., 2015) and the es-       observations. To our knowledge, the performance of the
timation of updated emissions (Müller and Stavrakou, 2005).         LOTOS-EUROS model has not been evaluated over Greece
The evaluation of CTMs is critical in order to assess the qual-     before. In situ NO2 surface measurements over Athens and
ity of the model predictions. This is achieved by compar-           Thessaloniki are obtained for the time period between June
ing the model with different measurement datasets, includ-          and December 2018 and are compared against the surface
ing ground-based in situ measurements of pollutants (Ver-           simulations of the model. The availability of the measure-
straeten et al., 2018) and space-borne observations (Huijnen        ments before June is sparse, and so the study is conducted for
et al., 2010).                                                      the period between June and December. Additionally, NO2
   To date, most European air quality modelling studies have        tropospheric columns simulated by the model are compared
focused on western and central European countries, while            with NO2 columns retrieved from multi-axis differential op-
very few research efforts addressed Eastern Europe. Greece          tical absorption spectroscopy (MAX-DOAS) systems as well
is located in south-eastern Europe, at the tip of the Balkan        as satellite retrievals from the Sentinel-5 Precursor (S5P) car-
Peninsula, bordering the east Mediterranean Sea. Athens is          rying the Tropospheric Monitoring Instrument (TROPOMI)
the largest city in Greece and belongs to the administrative        in Athens and Thessaloniki. This study is structured as fol-
division of Attica that has around 3.8 million of inhabitants       lows: in Sect. 2.1 the model and the adopted setup are de-
(EL.STAT, 2012). Air pollution in Athens is caused by the           scribed, and in Sect. 2.2 and 2.3 the datasets used for the
combination of high anthropogenic emissions in this densely         evaluation are presented. In Sect. 3 we discuss the compar-
populated area (Pateraki et al., 2013) and the particular me-       isons of the simulations with the aforementioned datasets. In
teorological conditions characterized by strong winter tem-         Sect. 3.1 the simulations are compared against in situ mea-
perature inversions and sea breeze circulation in the summer        surements, Sect. 3.2 presents the results of the MAX-DOAS
(Kallos et al., 1993). Furthermore, the city is surrounded by       and LOTOS-EUROS column comparisons, and in Sect. 3.3
mountains in the north (Parnitha, Penteli), east (Hymettos)         the S5P/TROPOMI retrievals are used to further evaluate the
and west (Egaleo), and the Saronic Gulf in the south limits         NO2 simulated columns. A short summary of all compar-
the dispersion of air masses above the basin (Grivas et al.,        isons is given in Sect. 3.4 with conclusions being presented
2008); see Fig. 1, left. Major NOx emission sources in the          in Sect. 4.
area are the large number of vehicles in circulation, the in-
dustrial area of Thriassion Plain to the west of the basin and
the Mesogia Plain to the east (Fameli and Assimakopoulos,           2   Data and methodology
2016), shipping, and aviation. The largest airport in Greece,
                                                                    The performance of the LOTOS-EUROS model is studied
Athens International Airport Eleftherios Venizelos (airport),
                                                                    over Greece and its surrounding neighbouring countries, as
is also situated in the east of the basin and also forms a lo-
                                                                    well as in more detail around the two largest cities in Greece,
cal source of NOx emissions (Koulidis et al., 2020). Fur-
                                                                    namely Athens (37.9838◦ N, 23.7275◦ E) and Thessaloniki
thermore, the city of Piraeus in the south hosts one of the
                                                                    (40.7369◦ N, 22.9202◦ E). For this study Athens refers to the
largest freight and passenger ports in Europe (Fameli and As-
                                                                    Attica basin, which includes the city of Piraeus and the sub-
simakopoulos, 2016).
                                                                    urbs, while Thessaloniki refers to the whole metropolitan
   Thessaloniki is the second largest city of Greece, with
                                                                    area of Thessaloniki.
more than 1 million inhabitants in the metropolitan area
(EL.STAT, 2012), and is situated in the northern part of
the country. The topography of Thessaloniki comprises of
coastal (the gulf or Thermaic Gulf) and mountainous areas
(Mt Hortiatis); see Fig. 1, right. Similarly to Athens, par-

Atmos. Chem. Phys., 21, 5269–5288, 2021                                               https://doi.org/10.5194/acp-21-5269-2021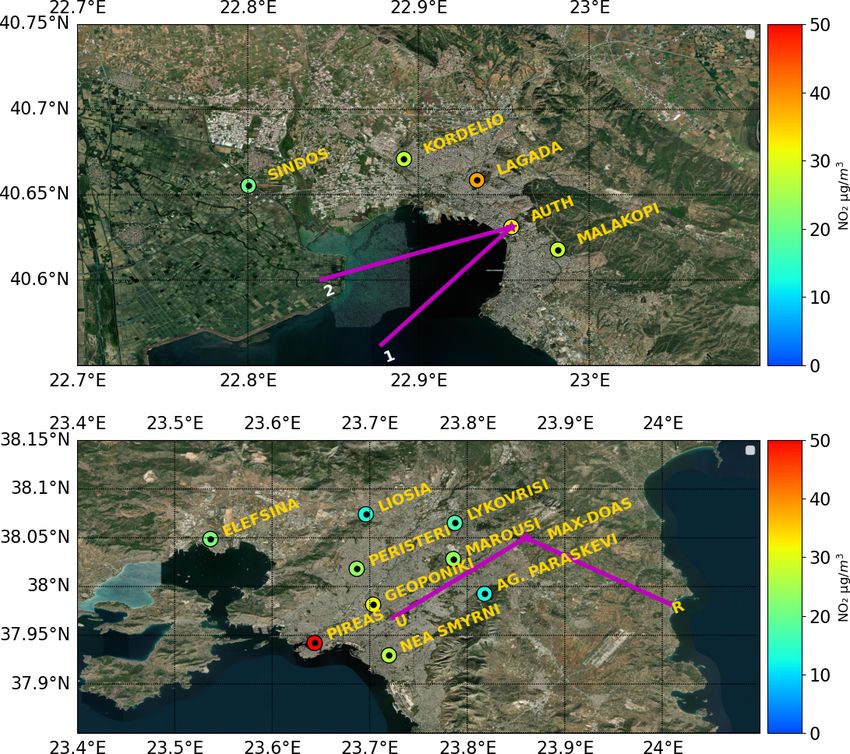
I. Skoulidou et al.: Evaluation of the LOTOS-EUROS NO2 simulations                                                                     5271

Figure 1. The topographic features that affect air pollution as well as the areas of known NOx sources in Athens (left) and Thessaloniki
(right); Mt refers to mountain, Pl to plain and Ar to area (created using https://land.copernicus.eu/imagery-in-situ/eu-dem/eu-dem-v1.1 (last
access: 24 March 2021) and QGIS software).

2.1   The LOTOS-EUROS CTM                                                domain and covers the period between June and December
                                                                         of 2018. The smaller domain in this case spans from 33 to
                                                                         46◦ N and 18 to 29◦ E, with a grid resolution following the
In this study we used the open-source CTM LOTOS-EUROS                    resolution of the emission inventory used for our setup (0.1◦
v2.2.001 (Manders et al., 2017, https://lotos-euros.tno.nl/,             longitude × 0.05◦ latitude), referred to hereafter as the Greek
last access: 24 March 2021). The model can simulate distinct             domain. Both simulations were driven by the operational
components (i.e. oxidants, secondary inorganic aerosols, pri-            meteorological data from the European Centre for Medium-
mary aerosol and heavy metals) in the troposphere (Schaap                Range Weather Forecasts (ECMWF) with a horizontal res-
et al., 2008). It has been extensively used in the past for              olution of 7 km × 7 km and a temporal resolution of 1 h for
air quality studies and forecasting. LOTOS-EUROS consti-                 the surface variables and 3 h for the multi-level parameters
tutes one of the state-of-the-art atmospheric chemistry mod-             (Flemming et al., 2009). The 10 vertical levels used for the
els used by the Copernicus Atmosphere Monitoring Service                 simulations of the atmospheric components were defined as
(CAMS, http://www.copernicus-atmosphere.eu, last access:                 a coarsening of the meteorological model levels and span the
24 March 2021) to provide daily forecasts of the main air                troposphere from the surface to a top around 175 hPa (about
pollutants (i.e. ozone, NO2 and PM10 ). With respect to its              12 km), while they coarsen upward. The model uses a combi-
overall evaluation, a good agreement was reported between                nation of the 137 hybrid sigma-pressure layer ECMWF defi-
NO2 LOTOS-EUROS simulations and MAX-DOAS obser-                          nition. Depending on the input meteorological data LOTOS-
vations in the Netherlands (Vlemmix et al., 2015). Schaap et             EUROS defines layer interfaces as pressures or heights above
al. (2013) used the NO2 model results to study the sensitiv-             the surface. The anthropogenic emission inventory used is
ity of the retrieved NO2 columns from the OMI/Aura satel-                the CAMS-REG (CAMS regional European emissions) ver-
lite instrument to anthropogenic emissions, pointing out the             sion 2 for the year 2015 at 0.1◦ × 0.05◦ (Kuenen et al., 2014).
need of model simulations along with satellite observations              Biogenic emissions (isoprene) are calculated online using the
in order to assess emission trends. Curier et al. (2014) used            meteorology and a detailed land use and tree species database
NO2 retrieved from OMI and LOTOS-EUROS to determine                      that contains 115 tree species and their biomass density and
the NO2 trends from 2005 to 2010 over Europe and found                   emission factors for terpene and isoprene, which allows the
significant decreases in industrialized areas. Simulations by            emission calculation per tree species type. Soil NO emissions
the CTM have recently been used in an effort to quantify                 are taken from a parameterization depending on soil type
the effects of the lockdown due to the COVID-19 pandemic                 and soil temperature (Novak and Pierce, 1993), while NOx
over Greece as observed by S5P/TROPOMI (Koukouli et al.,                 production from lightning is not included in the model. The
2021).                                                                   aggregated total NO emissions from anthropogenic and bio-
   In this study we performed two model simulations. The                 genic sources used from June to December 2018 are shown
first one, the outer area, includes central and southern Europe          in the left panel of Fig. S2, while the biogenic NO emissions
(15◦ W to 45◦ E and 30–60◦ N) with a horizontal resolution               for the same period are shown in the right panel. Biogenic
of 0.25◦ × 0.25◦ for the year 2018 (referred to hereafter as             NO emissions constitute 11 % of the total NO emissions in
the European domain); see Fig. S1 in the Supplement. The                 the area as seen in Fig. S2, which shows Greece, southern Al-
second run consists of an inner area of the coarser European

https://doi.org/10.5194/acp-21-5269-2021                                                   Atmos. Chem. Phys., 21, 5269–5288, 2021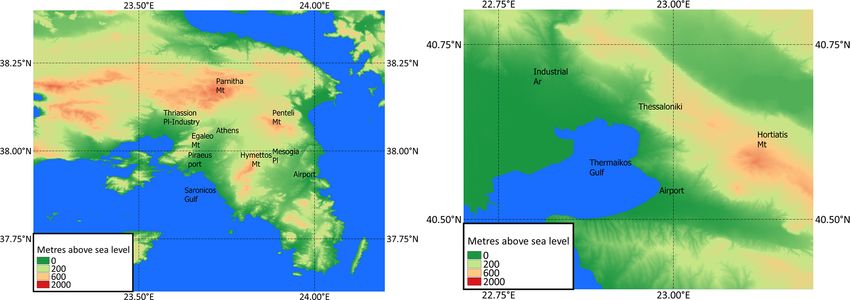
5272                                                I. Skoulidou et al.: Evaluation of the LOTOS-EUROS NO2 simulations

bania, the southern Republic of North Macedonia, southern         well distributed and to be representative of the local emission
Bulgaria and western Turkey, while in the LOTOS-EUROS             sources. The locations of the stations are given in Fig. 2 for
model 97 % of the NOx emissions are emitted as NO and the         Thessaloniki (top) and Athens (bottom). The marked colours
rest as NO2 .                                                     over the stations refer to the average NO2 measured at each
   The initial and boundary conditions for the European do-       station between June and December 2018. We should ac-
main are obtained from the Copernicus Atmosphere Mon-             knowledge possible representativity errors when comparing
itoring Service (CAMS, https://atmosphere.copernicus.eu/,         the measurements from urban traffic stations with the mean
last access: 24 March 2021). The CAMS global near-real-           value of a model grid cell (0.1◦ × 0.05◦ ) (Liu et al., 2018).
time (NRT) product is used for the gas and aerosol concentra-     For this reason, stations characterized as urban traffic sta-
tions with a spatial resolution of 35 km × 35 km and a tempo-     tions, localized close to busy traffic roads of the city and
ral resolution of 3 h. The initial and boundary conditions used   showing extremely high concentrations were excluded from
in the case of the Greek domain are provided from the out-        the validation, based on local knowledge of their actual lo-
puts of the coarser European domain, while the top bound-         cations. As a result, we include in our analysis stations that
ary conditions used in both domains are obtained from the         are officially characterized as “traffic stations” (e.g. Marousi
CAMS-NRT as well. The gas phase chemistry of the model            station, Athens) but which are not placed directly over the
is described using a modified version of the Carbon Bond          major thoroughfares. As a result, out of a total of 24 stations
Mechanism IV (CBM-IV) scheme (Gery et al., 1989), while           reporting to the repository, 5 and 9 stations for the region
the aerosol chemistry is represented by the ISORROPIA II          of Thessaloniki and Athens, respectively, are retained for the
(Fountoukis and Nenes, 2007). More details on the chem-           model evaluation. When more than one in situ station is lo-
istry module of LOTOS-EUROS can be found in Manders et            cated at one grid pixel, their average value is considered; as
al. (2017). For the biomass burning emissions and wildfires,      a result in the case of Thessaloniki the mean values of the
the Global Fire Assimilation System (GFAS), which assim-          urban background stations Malakopi and AUTH are calcu-
ilates fire radiative power (FRP) observations from satellite-    lated as well as in the case of the urban industrial stations
based sensors (Kaiser et al., 2012), is used in the LOTOS-        Kordelio and Sindos. Measurements from these stations have
EUROS simulations. In the Greek domain and during the pe-         been used in the past to investigate the NOx trends in Athens
riod of study some artificial fires were detected in the GFAS     (Mavroidis and Ilia, 2012), to assess the impact of the eco-
database, while no big wildfires were recorded in the area.       nomic crisis in Greece after 2008 (Vrekoussis et al., 2013)
As a result the GFAS inventory was not taken into account in      and to reveal how the surface NO2 concentrations are re-
the nested simulation.                                            flected on the OMI/Aura retrieval (Zyrichidou et al., 2013).

2.2     Ground-based measurements                                 2.2.2   MAX-DOAS tropospheric NO2 measurements

In order to validate the NO2 simulations derived from             Tropospheric NO2 columnar measurements from multi-axis
LOTOS-EUROS over Greece we compare model-derived                  differential optical absorption spectroscopy (MAX-DOAS)
surface concentrations with in situ air quality measurements      systems located in Thessaloniki and Athens are compared
performed in Athens and Thessaloniki. Furthermore, the sim-       with LOTOS-EUROS-simulated columns for July and De-
ulated NO2 tropospheric columns over the Greek domains            cember 2018. For the region of Thessaloniki, Phaethon, a
are compared against MAX-DOAS NO2 columns, also situ-             miniature spectrometer ground-based MAX-DOAS system,
ated in Athens and Thessaloniki.                                  is used. The system was developed in 2006 at the Labora-
                                                                  tory of Atmospheric Physics (LAP) in Thessaloniki, Greece
2.2.1    In situ NO2 surface measurements                         (Kouremeti et al., 2008). This system operates regularly on
                                                                  the roof of the Physics Department of the Aristotle Univer-
Hourly in situ measurements of NO2 concentrations over            sity campus which is located in the centre of Thessaloniki
Greece were obtained from the National Air Pollution              (Drosoglou et al., 2017). At the same location, an air quality
Monitoring Network (http://www.ypeka.gr/, last access:            measuring station, labelled AUTH in Fig. 2, is in operation
24 March 2021) from June to December 2018. The afore-             by the region of central Macedonia. For this study, we used
mentioned data are routinely reported to the European En-         the average value of the two azimuth angles: 220 and 255◦
vironmental Agency Air Quality database. A chemilumines-          designated in Fig. 2 by the purple lines 1 and 2, respectively.
cence measurement method, which is based on the reaction          In these viewing directions the MAX-DOAS system probes
of ozone with nitric oxide to form excited NO2 (Dunlea et         air over the centre of the city and the gulf of Thessaloniki,
al., 2007), is used for the measurement of nitrogen oxides.       an area which is usually supplied by air from the western
The in situ stations in Athens are operated by the Depart-        part and the industrial area of the city, i.e. directly from the
ment of Air Quality, while those for Thessaloniki are oper-       urban environment. During a campaign period, which took
ated by the regional administrations. The stations used for the   place in late autumn to spring, when the height of boundary
evaluation of the model were carefully selected in order to be    layer is low, Drosoglou et al. (2017) found that only 2 % of

Atmos. Chem. Phys., 21, 5269–5288, 2021                                             https://doi.org/10.5194/acp-21-5269-2021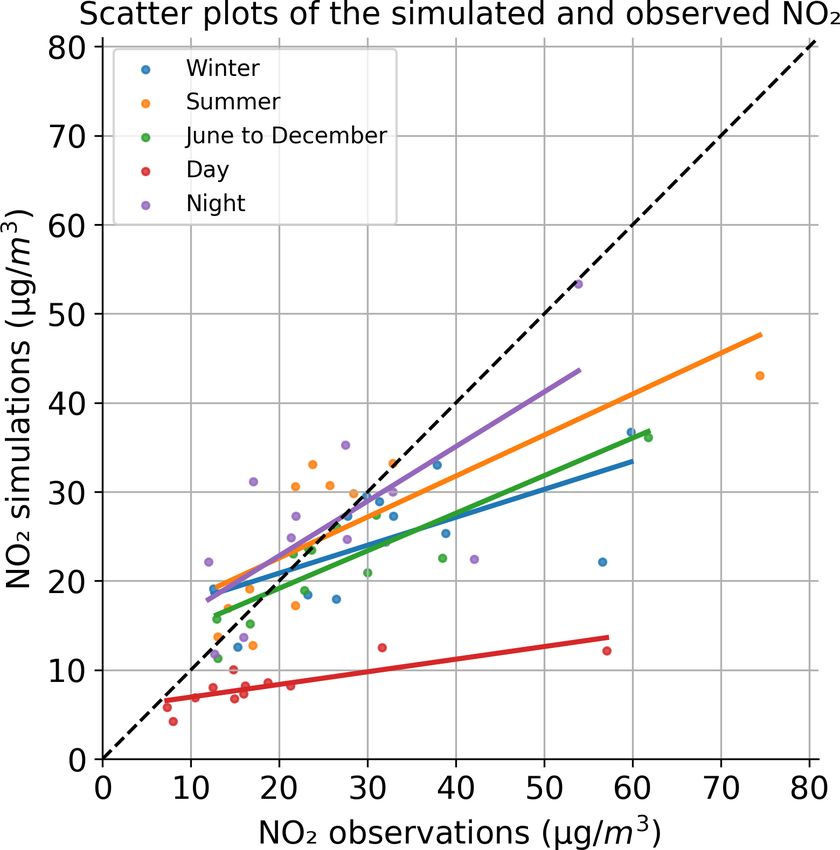
I. Skoulidou et al.: Evaluation of the LOTOS-EUROS NO2 simulations                                                                  5273

Figure 2. In situ air quality measurements in the region of Thessaloniki (top) and the region of Attica (bottom). The points represent the
stations, while the colour bar denotes the average NO2 measurements over June–December 2018. The purple lines represent the direction of
the MAX-DOAS measurements in the area (created using background from ArcGIS service).

the data exceed the 2 km horizontal distance. Consecutively,           120 and at 232.5◦ , and are represented by the purple lines in
in our analysis the simulation grid cell where the MAX-                Fig. 2. The first one, marked with “R”, is characterized as
DOAS is situated is considered as the most appropriate to              a rural unobstructed direction, while the other one is named
compare with the observations. The average tropospheric                “U” and views towards an urban direction, and as a result
columns from the two azimuth angles were calculated since              the simulations of the closest grid cells that are in the U and
both directions fall into the same grid pixel of the model sim-        R directions and are representative of urban and rural areas
ulations. The retrievals are based on geometrically approxi-           respectively are selected for the comparisons. The horizon-
mated air mass factor (AMF) (Wagner et al., 2010). In the              tal representativeness of the instrument is estimated to be
study of Drosoglou et al. (2017), the tropospheric NO2 values          ∼ 2 km, while comparisons with in situ NO2 measurements
derived from MAX-DOAS instruments positioned at three                  have shown that areas close to the instrument are better rep-
different locations around Thessaloniki and the OMI/Aura               resented, though this premise has not yet been quantified.
satellite were compared during a 6-month campaign, show-                  The Athens MAX-DOAS tropospheric NO2 vertical
ing good agreement over the rural and the suburban areas,              columns were derived, as in the case of the Thessaloniki
with a mean bias of −1.63 and −0.17 molec cm−2 respec-                 instrument, using the geometric approximation. The evalu-
tively. In Fig. 2 (bottom) the location of the MAX-DOAS in-            ation of the magnitude of the differences introduced by us-
strument used for the comparisons of the NO2 tropospheric              ing the geometric AMF instead of a full AMF calculation is
column in Athens is marked. The MAX-DOAS instrument                    ongoing for both of these instruments. We mention here the
is installed in the north-east of Athens, at Penteli mountain          work of Shaiganfar et al. (2011), who reported that tropo-
(527 m above sea level), and is a scientific instrument that be-       spheric NO2 columns deviate by approximately ±20 % for
longs to the BREDOM network (Bremian DOAS network for                  NO2 layer heights ≤ 500 m and a moderate aerosol optical
atmospheric measurements; https://www.iup.uni-bremen.de/               depth, when using the geometric approximation instead of a
doas/, last access: 24 March 2021) (Gratsea et al., 2016). Two         full AMF calculation.
azimuthal viewing angles are selected in this case as well, at

https://doi.org/10.5194/acp-21-5269-2021                                                 Atmos. Chem. Phys., 21, 5269–5288, 2021
5274                                                    I. Skoulidou et al.: Evaluation of the LOTOS-EUROS NO2 simulations

Figure 3. Time series of the hourly in situ measurements at two stations (black points) and the simulations of the model in the corresponding
pixel (red lines) between June and December 2018. The urban background AUTH/Malakopi stations in Thessaloniki (a) and the urban
background Peristeri station in Athens (b) are shown.

   For this study, MAX-DOAS observations at 15◦ elevation                TROPOMI tropospheric NO2 shows on average 30 % lower
angle are analysed in both sites in order to avoid uncertainties         levels (S5P MPC Routine Operations Consolidated Valida-
introduced due to aerosols at lower elevation angles (Sinreich           tion Report #9, 2020). The report demonstrates the high cor-
et al., 2005), to obtain a stronger signal-to-noise ratio and,           relation of the TROPOMI tropospheric NO2 with the inde-
since this elevation angle probes air closer to location of the          pendent observations and a nearly linear scaling of the error
emissions, to ensure a stronger signal overall.                          with the tropospheric column amount. Part of the reported
                                                                         bias is attributed to retrieval inputs, in particular cloud pres-
2.3    S5P/TROPOMI tropospheric NO2 observations                         sure retrievals and the surface albedo used as well as the a pri-
                                                                         ori NO2 profile, which is available globally at a resolution of
                                                                         1 × 1◦ . This resolution is not high enough to resolve the NO2
The Sentinel-5 Precursor, S5P, satellite was launched on
                                                                         profiles near point sources and over cities. As a result the
13 October 2017, carrying the TROPOspheric Monitoring
                                                                         tropospheric column is often underestimated at the hotspots
Instrument, TROPOMI (Veefkind et al., 2012). The satellite
                                                                         (and somewhat underestimated in rural regions). Note how-
flies in a near-polar, sun-synchronous orbit at an altitude of
                                                                         ever that because the averaging kernels are used in our case,
824 km with an equatorial crossing at 13:30 local solar time
                                                                         discussed further below, the comparison of TROPOMI ob-
(LST). TROPOMI is a passive, nadir-viewing spectrometer
                                                                         servations with LOTOS-EUROS is not influenced by the re-
measuring wavelengths between the ultraviolet and the short-
                                                                         trieval a priori and as a result is independent of the a pri-
wave infrared. The swath width of TROPOMI in the Earth’s
                                                                         ori profile shapes of TM5-MP (Eskes and Boersma, 2003).
surface is approximately 2600 km, and the ground pixel of
                                                                         Therefore, we expect a TROPOMI low bias of the order of
the instrument at nadir is 7×3.5 km2 , 5.5×3.5 km2 since Au-
                                                                         10 %–20 % to remain, influencing the comparisons.
gust 2019, achieving near-global coverage in 1 d. The wave-
                                                                            In this study we used the reprocessed daily TROPOMI
length range used for the NO2 column retrieval algorithm
                                                                         data, RPRO, version 01.02.02 TROPOMI for July and the
is between 405 and 465 nm, while detailed information on
                                                                         offline data, OFFL, for December 2018, which can be ob-
the algorithm and the data can be found in the TROPOMI
                                                                         tained via the Copernicus Open Data Access Hub (https://
NO2 Algorithm Theoretical Basis Document (van Geffen
                                                                         s5phub.copernicus.eu/, last access: 24 March 2021). The data
et al., 2019, 2020). The data are constantly validated by
                                                                         are filtered with a quality assurance value qa_value>0.75,
the Mission Performance Center Validation Data Analy-
                                                                         ensuring mostly cloud-free observations, and gridded onto
sis Facility, VDAF, http://mpc-vdaf.tropomi.eu/ (last access:
                                                                         the LOTOS-EUROS grid at 0.1◦ × 0.05◦ using a module
24 March 2021), as well as through several TROPOMI NO2
                                                                         that converts the TROPOMI data into a format suitable for
validation papers that have been recently submitted (for e.g.
                                                                         LOTOS-EUROS to process. The TROPOMI tropospheric
Ialongo et al., 2020; Judd et al., 2020; Verhoelst et al.,
                                                                         vertical column is compared with the simulated NO2 column
2021; Zhao et al., 2020). Compared with globally deployed
                                                                         derived from the LOTOS-EUROS after the averaging kernel
ground-based remote sensing MAX-DOAS instruments, the

Atmos. Chem. Phys., 21, 5269–5288, 2021                                                     https://doi.org/10.5194/acp-21-5269-2021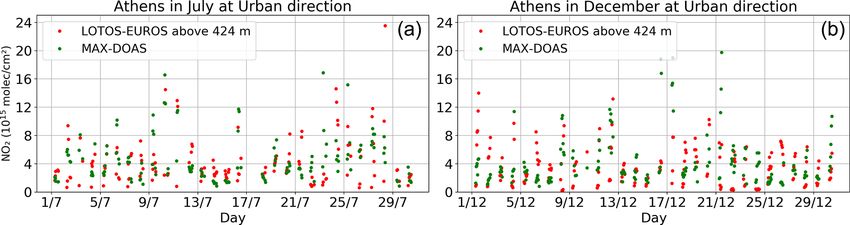
I. Skoulidou et al.: Evaluation of the LOTOS-EUROS NO2 simulations                                                                          5275

Table 1. Correlations and normalized root mean square error (NRMSE) values (in parenthesis) between the NO2 surface observations at the
in situ stations in Thessaloniki and the surface concentrations calculated at the corresponding model grid cell. Correlations higher than 0.6
are marked in bold, while the correlations lower than 0.4 are marked in italic. All correlation coefficients are statistically significant at the
95 % level.

                Station name         Type of station                 Correlation coefficient and NRMSE (in parenthesis)
                                                                    J-D       Summer           Winter            Day           Night
                Lagada               Traffic                0.49 (0.66)              –    0.50 (0.73)     0.58 (0.82)     0.34 (0.9)
                AUTH/Malakopi        Urban background       0.58 (0.63)    0.59 (0.70)    0.72 (0.53)     0.68 (0.81)    0.38 (0.61)
                Kordelio/Sindos      Urban industrial       0.57 (0.66)    0.50 (0.76)    0.67 (0.55)     0.56 (0.72)    0.58 (0.73)

Table 2. As Table 1 but for air quality stations in Athens. All correlation coefficients are statistically significant at the 95 % level.

                Station name      Type of station                     Correlation coefficient and NRMSE in parenthesis
                                                                    J-D       Summer           Winter            Day           Night
                Geoponiki         Suburban industrial       0.60 (0.71)    0.59 (0.80)     0.66 (0.47)    0.72 (0.71)    0.44 (0.80)
                Liosia            Suburban background       0.34 (1.25)    0.29 (1.54)     0.49 (0.88)    0.59 (1.04)    0.15 (1.39)
                Lykovrisi         Suburban background       0.59 (0.94)    0.44 (1.26)     0.65 (0.59)    0.62 (0.83)    0.52 (0.96)
                Marousi           Urban traffic             0.62 (0.87)    0.60 (1.03)     0.65 (0.55)    0.67 (0.70)    0.48 (0.90)
                Nea Smyrni        Urban background          0.62 (0.77)    0.66 (0.81)     0.39 (0.78)    0.44 (0.83)    0.53 (0.90)
                Pireas            Urban traffic             0.40 (0.61)    0.44 (0.62)     0.42 (0.51)    0.18 (0.88)    0.59 (0.43)
                Peristeri         Urban background          0.55 (0.88)    0.55 (1.21)     0.61 (0.55)    0.61 (0.81)    0.42 (1.16)
                Elefsina          Suburban industrial       0.51 (0.90)    0.35 (1.40)     0.54 (0.58)    0.50 (0.68)    0.46 (1.67)
                Ag. Paraskevi     Suburban background       0.32 (1.47)    0.26 (1.46)     0.33 (1.53)    0.51 (0.86)    0.17 (1.97)

of the TROPOMI vertical columns is applied to the simu-                      EUROS simulations follow the diurnal patterns, as well as
lations in order to ensure a consistent comparison between                   general patterns, revealed by the measurements satisfacto-
the modelled and measured columns (Eskes and Boersma,                        rily. During some periods the CTM NO2 simulations are low
2003). The TROPOMI averaging kernels are applied onto the                    compared to the measurements, and this in most cases coin-
LOTOS-EUROS profiles using an online module of LOTOS-                        cides with a daytime underestimation of the model, discussed
EUROS. After regridding the TROPOMI data onto LOTOS-                         further later on (see Fig. 4). This occurs, for instance, at the
EUROS gridding, the module maps the model profile to the                     AUTH/Malakopi station (upper panel) during the period of
retrieval a priori layers, while in order to cover the atmo-                 1 June to 15 July and at the Peristeri station in early June. On
sphere above the model’s vertical levels boundary conditions                 the other hand, there are some days for which much higher
are added from the CAMS NRT product. The averaging ker-                      NO2 levels are simulated than observed, mainly during night-
nels are applied to the simulations made at the closest time of              time, as seen for example during July at the Peristeri station
the observations. The entire process is fully automated within               (lower panel).
the LOTOS-EUROS post-processing analysis tools.                                 Tables 1 and 2 summarize the direct comparisons of
                                                                             LOTOS-EUROS NO2 surface concentrations to NO2 con-
                                                                             centrations measured at five stations in Thessaloniki and nine
3     Results                                                                in Athens, respectively. The stations are characterized by
                                                                             their official designated type – namely, traffic, urban back-
3.1    LOTOS-EUROS and in situ measurements                                  ground, urban industrial, suburban background and suburban
                                                                             industrial. The correlation coefficients based on the hourly
In the following, we compare the hourly modelled sur-                        values are calculated for five different time periods: the whole
face NO2 concentrations from the lowest layer of the sim-                    period from June to December 2018, the winter period where
ulations with hourly in situ measurements. As example of                     measurements from December are only taken into account,
this process, we present time series of hourly NO2 con-                      the summer period that includes July, the day period that in-
centrations at the urban background representative stations                  cludes only the daytime data between 12:00 and 15:00 local
AUTH/Malakopi in Thessaloniki (upper) and Peristeri in                       time during the whole period, and finally the night period that
Athens (lower) panels of Fig. 3, where the simulations are                   refers only to the hours between 00:00 and 03:00 local time
shown in red and the in situ observations in black for the pe-               during the whole period. The distinct periods are selected in
riod June to December 2018. For both stations, the LOTOS-

https://doi.org/10.5194/acp-21-5269-2021                                                        Atmos. Chem. Phys., 21, 5269–5288, 2021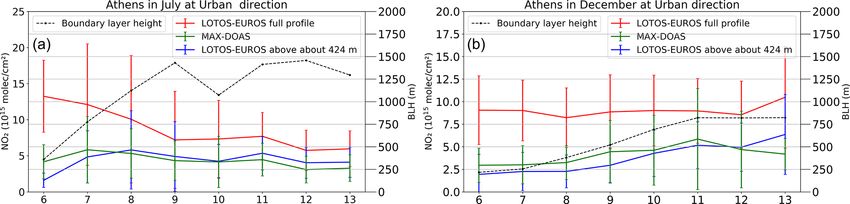
5276                                                     I. Skoulidou et al.: Evaluation of the LOTOS-EUROS NO2 simulations

                                                                        Figure 5. Box-and-whisker plot of the relative biases between the
                                                                        simulated and observed NO2 concentrations for the 14 stations used
                                                                        for the validation during the five different periods, from left to right:
                                                                        winter, summer, June to December, daytime and night-time. The
                                                                        different colours of the markers represent distinct types of air qual-
                                                                        ity stations, namely urban (in red), traffic (in blue) and suburban (in
                                                                        green). The boxes extend from the lower to upper quartile values
                                                                        of the biases, while the horizontal line in each box represents the
                                                                        median. The whiskers extend from the box to show the range of the
Figure 4. Scatter plot of the simulated and observed NO2 concen-        data and outliers past the end of the whiskers. The relative biases are
trations for the 14 stations used for the validation at the different   calculated according to (simulations – observations)/observations.
periods. Winter is the December month (blue line), summer is July
(orange line), June to December includes measurements for the
whole period of study (green line), day represents the daily hours      proved correlations during the winter period than in summer,
(between 12:00 and 15:00 local time) during the whole period (red
                                                                        with an average correlation of 0.53 and 0.46 respectively. On
line) and night represents the night hours (between 00:00 and 03:00
local time) during the whole period (purple line).
                                                                        the other hand, when limiting the analysis to the day time pe-
                                                                        riod, the majority of the correlations are improved compared
                                                                        to the June–December period and increased by about 5 %–
                                                                        55 % and 70 % for the suburban background station Liosia.
order to study the seasonal (summer and winter) and diur-               The urban background station Nea Smyrni and the urban traf-
nal (day and night) performance of the model when differ-               fic station near the port of Piraeus exhibit decreased corre-
ent parameters may affect the simulations. The comparisons              lations during the day period in comparison with the June
are made only for collocated measurements, while the cor-               to December period (−29 % and −55 % respectively). Fi-
relation coefficients are found to be statistically significant         nally, the correlations worsen during night-time (decreased
(p < 0.05) for all stations and temporal choices.                       by about 9 %–56 % compared to the whole period) in Athens
   In more detail, for Thessaloniki (Table 1) the correla-              except for the Piraeus urban traffic station, which is located
tion coefficients calculated for the entire period range from           in the city port (Table 2). The correlation at the suburban in-
r = 0.49 to r = 0.58. Overall, the mean correlation in sum-             dustrial station Geoponiki during daytime reaches 0.72, com-
mer is slightly lower (0.55) than in winter (0.63), while it            pared to 0.44 for the night-time period.
should be mentioned that significant gaps in the summer-                   The diurnal NO2 variability of both the LOTOS-EUROS
time measurements of the traffic station were found. During             simulations (in red) and the corresponding measurements for
daytime, the correlation generally increases by 18 % on aver-           three air quality stations (in black) are presented in Fig. S3,
age for the traffic station and the urban background stations,          where it is shown that the model simulates very well the ex-
while it decreases by 36 % on average during night in com-              pected highs and lows of the NO2 concentrations during the
parison to the whole period. In the case of the cluster of the          day, with some differences in the absolute levels, whose pos-
two urban background stations, AUTH/Malakopi, the corre-                sible origins are discussed in Sect. “Discussion on the vali-
lation is found to be best (r = 0.68 and r = 0.72) during day-          dation of surface NO2 concentrations”.
time and winter respectively.                                              In Fig. 4, the mean NO2 simulations for each temporal pe-
   For the city of Athens (Table 2) the average correlation             riod chosen are compared against the NO2 measurements for
for the June to December period is ∼ 0.5, with two subur-               all 14 stations. Each period is marked with a different colour:
ban background stations (Ag. Paraskevi and Liosia) showing              winter in blue, summer in orange, daytime in red, night-time
the lowest correlations (r = 0.32 and r = 0.34 respectively),           in purple and June-to-December in green. Overall, and irre-
while the urban background/traffic stations (N. Smyrni and              spective of the temporal choice, the simulations are found to
Marousi) show the highest ones (r = 0.62). As for Thessa-               underestimate the in situ measurements, as shown by the lin-
loniki, in the case of Athens as well, the model shows im-              ear regression slopes, coloured in tandem with the datasets.

Atmos. Chem. Phys., 21, 5269–5288, 2021                                                     https://doi.org/10.5194/acp-21-5269-2021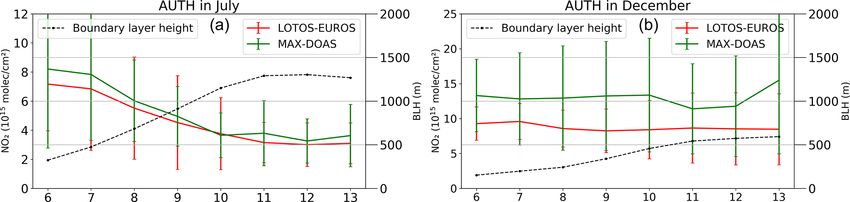
I. Skoulidou et al.: Evaluation of the LOTOS-EUROS NO2 simulations 5277
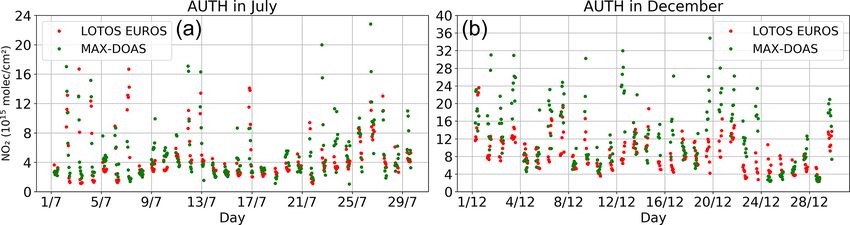
Figure 6. Time series of LOTOS-EUROS (red) and MAX-DOAS (green) NO2 columns over AUTH for July (a) and December (b) 2018.
Table 3. Statistics between the MAX-DOAS observations and the LOTOS-EUROS simulations for July and December in Thessaloniki.
MAX-DOAS mean and SD LOTOS-EUROS mean and SD Absolute bias Relative Correlation
(1015 molec cm−2 ) (1015 molec cm−2 ) (1015 molec cm−2 ) bias coefficient
July 5.15 ± 3.55 4.61 ± 3.18 −0.53 −10.37 % 0.50
December 12.99 ± 7.56 8.70 ± 3.92 −4.30 −33.08 % 0.63
The model behaves similarly in winter as in summer, while to the in situ measurements over the two major cities of
the spatial variability is better reproduced in summer when Greece between June and December 2018, showing a mild
the spatial correlation coefficient is 0.79. The difference be- underestimation of the measurements with a mean relative
tween day and night comparisons, shown in Tables 1 and 2, bias of −11 %, a median relative bias of −10 %, a high
is evident, whereas the strong model underestimation in day- spatial correlation coefficient equal to 0.86 and an average
time merits further analysis, even though the spatial corre- temporal correlation of 0.52. However, the separate evalua-
lations are similar (0.80 and 0.72 for day and night respec- tion during distinct temporal intervals periods shows that the
tively). During the night period, the model overestimates the model simulations have different behaviours depending on
low NO2 measurements and underestimates the higher con- season and time of day. Namely, the CTM underestimates the
centrations. NO2 surface concentrations during daytime, between 12:00
The relative biases between the simulated and measured and 15:00 pm local time, ∼ −50 ± 15 %, while it slightly
values of the each periods are shown in the box-and-whisker overestimates them during night-time, (between 00:00 and
plot in Fig. 5, where different colours denote three different 03:00 local time), ∼ 10 ± 35 %.
kind of stations; urban, suburban and traffic. The period over During summertime, the CTM agrees very well with the
June to December (middle box) shows a range of biases be- in situ measurements, at ∼ 5 ± 25 %, while in wintertime,
tween −40 % and 23 %, showing an underestimation of the a slight underestimation was calculated, at ∼ −15 ± 25 %.
measurements in most cases and a median bias of −10 %. These evaluations permit us to discuss which physical pa-
The relative biases in winter (first box) range between −60 % rameterizations or input datasets within the model might be
and −1 %, showing a clear underestimation of the measure- responsible for these differences, focusing mainly on the
ments. In summer, a reverse behaviour is observed, where daytime comparisons where most of the discrepancies were
the median relative bias is 5 % and the model mostly over- found.
estimates the measurements. The strong underestimations of A major source of uncertainty, according to the exten-
the measured NO2 during day hours are depicted by the high sive work of Huijnen et al. (2010), who compared numerous
negative biases at the daytime period (fourth box) and the CTMs, as well as their ensemble, with ground and space-
absence of positive biases. The night simulations (fifth box) borne observations, appears to be the calculation, and sub-
show very high overestimation at the suburban industrial and sequent mixing, of the boundary layer height. The boundary
urban stations, while traffic stations are underestimated. layer height in LOTOS-EUROS is taken from the ECMWF
operational weather analysis data and is based on the bulk
Discussion on the validation of surface NO2 Richardson number following the conclusions of the Sei-
concentrations del et al. (2012) review. Should the daytime boundary layer
height provided be too high, this would result in low NO2
From the comparison with measurements by air quality sta- surface concentrations, as we see in this work. Lampe (2009)
tions in Athens and Thessaloniki, we found that overall the further showed that during night the urban heat island can
LOTOS-EUROS NO2 surface simulations compare very well cause a larger boundary layer height and a stronger mixing
https://doi.org/10.5194/acp-21-5269-2021 Atmos. Chem. Phys., 21, 5269–5288, 2021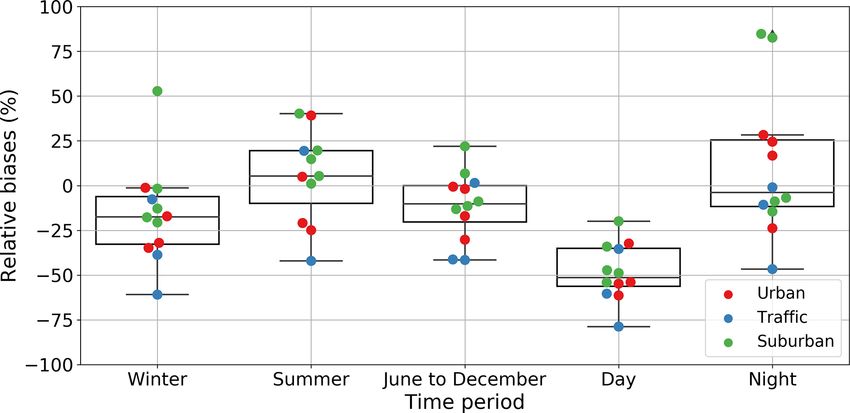
5278                                                   I. Skoulidou et al.: Evaluation of the LOTOS-EUROS NO2 simulations

Figure 7. Average diurnal cycle of the MAX-DOAS (green line), LOTOS-EUROS (red line) NO2 columns and boundary layer height (black
dashed line) during July (a) and December (b) in Thessaloniki. The error bars refer to the standard deviations of the averaged measurements
and simulations

Figure 8. Time series of LOTOS-EUROS (red) and MAX-DOAS (green) NO2 columns over Athens for July (a) and December (b) 2018 in
the urban direction.

that leads to the decrease in surface pollutants levels, an ef-         3.2     LOTOS-EUROS and MAX-DOAS observations
fect that may well roll over into our daytime comparisons as
well. A first investigation on this issue is shown further on in        In the following section, the tropospheric NO2 columns
Sect. 3.2.2.                                                            simulated by the LOTOS-EUROS CTM are compared to
   Another possible source of uncertainty would be partly               the MAX-DOAS systems of Thessaloniki (Sect. 3.2.1) and
due to representation issues related to the location of the sta-        Athens (Sect. 3.2.2). Common findings are discussed in
tions, which lie near urban city centres and industrial areas,          Sect. 3.2.3.
which cannot be well resolved by the model at 0.10◦ × 0.05◦
resolution, as in the case of Piraeus station near the port             3.2.1    Validation against the Thessaloniki MAX-DOAS
in Athens. This is an issue already identified by Liu et                         observations
al. (2018), who compared numerous in situ measurements
with CTM simulations over China. In our case as well, the               Collocated MAX-DOAS tropospheric NO2 observations for
spatial mismatch between the simulations and the measure-               the daytime hours of July and December 2018, for so-
ments is found to be more significant during night-time when            lar zenith angles less than 75◦ , were compared against the
the model strongly overestimates in some cases the surface              equivalent ones simulated by the LOTOS-EUROS CTM for
observations, and the resulting spatial correlation coefficient         the Thessaloniki MAX-DOAS system. Figure 6 shows the
is lower than during daytime (0.80 during day and 0.72 dur-             time series of the tropospheric NO2 vertical column densi-
ing night).                                                             ties from the MAX-DOAS system in the Aristotle Univer-
   Finally, we note that these alternating negative and positive        sity of Thessaloniki (AUTH) and the simulated NO2 tro-
biases can be further explained by the underestimation, or the          pospheric column from LOTOS-EUROS for July (left) and
overestimation, of the anthropogenic NOx emissions used in              December (right). Due to the solar zenith angle restriction,
the model, as they refer to the year 2015. In our simulations,          slightly fewer collocated measurements were found in De-
the default time profiles of the emissions are used, which can          cember (229) than in July (251). The MAX-DOAS, located
cause representativeness issues for the case of Greece and              in the centre of Thessaloniki, observes high-NO2 columns
which are an issue of current further study.                            during the winter month and lower levels during the sum-
                                                                        mertime, similar to the observations shown in Drosoglou
                                                                        et al. (2017) for the period 2014–2015. In July (hours be-
                                                                        tween 06:00 and 13:00 UTC), the measured and simulated

Atmos. Chem. Phys., 21, 5269–5288, 2021                                                    https://doi.org/10.5194/acp-21-5269-2021
I. Skoulidou et al.: Evaluation of the LOTOS-EUROS NO2 simulations 5279
Table 4. Statistics between the MAX-DOAS observations and the LOTOS-EUROS simulations for July and December in Athens at the urban
and rural azimuthal directions.
MAX-DOAS LOTOS-EUROS Absolute bias Relative Correlation
(1015 molec cm−2 ) (1015 molec cm−2 ) (1015 molec cm−2 ) bias coefficient
Urban July 4.44 ± 3.11 4.34 ± 3.77 −0.10 −2.23 % 0.41a
December 4.12 ± 3.55 3.53 ± 2.77 −0.60 −14.48 % 0.19a
Rural July 1.87 ± 1.94 1.19 ± 1.30 −0.68 −36.48 % 0.21b
December 3.69 ± 4.32 2.70 ± 2.98 −0.99 −26.78 % 0.81a
a Statistically significant at the 95 % level. b Statistically insignificant at the 95 % level.
Figure 9. Average diurnal cycle of the MAX-DOAS in Athens (green line), LOTOS-EUROS full-profile (red line) NO2 columns, LOTOS-
EUROS partial NO2 columns (blue line) and boundary layer height (black line) during July (a) and December (b) for urban direction. The
error bars refer to the standard deviations of the averaged measurements and simulations.
columns show a good agreement, while in winter (hours 0.5 and 0.63 for the two seasons. For both July and December
between 06:00 and 13:00 UTC) the measured columns are the regression analysis shows that the model overestimates
in many cases higher than the simulated ones. The mean the low and underestimates the high values of NO2 columns,
NO2 observations in July and December are 5.15 ± 3.55 which is more pronounced during December.
and 12.99 ± 7.56 × 10¹⁵ molec cm−2 , respectively, while the
mean model column over the same periods are 4.61 ± 3.18 3.2.2 Validation against the Athens MAX-DOAS
and 8.70 ± 3.92 × 10¹⁵ molec cm−2 (Table 3). In both sea- observations
sons the relative bias, calculated as (simulations – obser-
vations)/observations, is negative – higher in December, ∼ The same procedure followed for the case of Thessaloniki is
−33 %, and lower in July, ∼ −10 %. also followed for the MAX-DOAS in Athens; the two distinct
In order to investigate possible systematic temporal pat- azimuthal angles have been selected – the azimuthal viewing
terns, comparisons of the average diurnal cycles for July angle towards the urban area (U) and the azimuthal viewing
(left) and December (right) are shown in Fig. 7. Overall, angle towards rural area (R). All rural comparisons can be
LOTOS-EUROS (red line) reproduces very well the diurnal viewed in the Supplement. The MAX-DOAS instrument in
cycle over Thessaloniki in July, with the highest values be- Athens is located in a mountainous area around 500 m above
tween 06:00 and 07:00 UTC in the morning, as expected. The sea level. In order to succeed consistently in the compari-
modelled NO2 levels in December are about ∼ 30 % lower son between the measurements and the simulations, we in-
than the MAX-DOAS columns (green line), with no dis- tegrated the modelled NO2 columns above the model alti-
cernible diurnal pattern for either model or observations. As tude of ∼ 420 m. Figure 8 shows the time series of the tropo-
expected, the NO2 measurements are higher in winter than in spheric NO2 vertical column density from the MAX-DOAS
summer (note the different ranges in the y axes) because of in Athens and the simulated NO2 tropospheric columns from
higher household emissions in winter and the strong photo- LOTOS-EUROS (above 424 m) at the corresponding model
chemical loss of NO2 in summer (Boersma et al., 2009). The grid cells for July (left) and December (right) between 06:00
associated boundary layer height is also shown (black dotted and 13:00 in the urban direction. The model performs very
line.) Scatter plots of the daily average NO2 columns from well in simulating the urban viewing direction in Athens for
the MAX-DOAS against the LOTOS-EUROS simulations both seasons, similar to the findings for summertime in Thes-
for July (left) and December (right) are shown in Fig. S4. saloniki, and shows stronger relative bias differences at the
Overall, the comparisons perform well, with correlations of rural direction (Fig. S5), which are not dependent on strong
https://doi.org/10.5194/acp-21-5269-2021 Atmos. Chem. Phys., 21, 5269–5288, 20215280 I. Skoulidou et al.: Evaluation of the LOTOS-EUROS NO2 simulations absolute biases since the NO2 levels over the rural direction remaining hours the model underestimates the in situ mea- are quite low, especially during summertime. surements. The full set of statistics for both viewing directions of In the future, this line of investigation will be followed the Athens MAX-DOAS are given in Table 4. As discussed by comparing the MAX-DOAS NO2 profiles (currently not above, the LOTOS-EUROS simulations for the urban direc- available) against the ECMWF boundary layer heights and tion perform very well, with a minimal relative bias of less LOTOS-EUROS-simulated profiles to provide a clearer re- than ∼ −15 % for both seasons, slightly better during sum- lationship between how a low late-evening/early-morning mer than winter. For the rural direction, the absolute biases boundary layer affects the mixing processes within the CTM. remain low, below the 1 × 10¹⁵ molec cm−2 level; however, due to the small overall levels, the relative biases are stronger, Discussion on the validation of tropospheric NO2 at ∼ −35 % and ∼ −25 % for summer and winter accord- columns against ground-based MAX-DOAS ingly. observations We proceed with examining the diurnal cycle of the urban direction in July (Fig. 9, left) and December (Fig. 9, right) From the comparison with measurements by MAX-DOAS of the LOTOS-EUROS full profile (red line) and partial col- instrument stations in Athens and Thessaloniki, we find the umn above 424 m (blue line), the MAX-DOAS observations overall LOTOS-EUROS simulation of the tropospheric NO2 (green line), and the boundary layer height (black line) used columns over both urban and rural locations performs very for the simulations and obtained from the ECMWF, while well, representing the diurnal patterns and hourly levels for Fig. S6 shows the average diurnal cycle for the rural direc- both summer and winter seasons satisfactorily. The abso- tion. The importance of calculating a partial CTM profile lute biases for the month of July range between −0.1 and when comparing to the Athens MAX-DOAS observations, −0.7 × 10¹⁵ molec cm−2 for both urban and rural scenarios, due to their specific viewing geometry, is fully shown in this while a difference in the behaviour of the model for Decem- figure, where it can be easily observed that the partial profile ber between the urban observations in Thessaloniki against column of LOTOS-EUROS captures the daily variability of that of Athens is found, with the model underestimating by the measurements compared to the full column. Furthermore, ∼ −4 × 10¹⁵ molec cm−2 the levels measured over Thessa- the MAX-DOAS-observed diurnal cycle is highly overesti- loniki, mostly at the pollution peaks. The fact that for both mated by the LOTOS-EUROS full profile, while the same urban areas, in Thessaloniki and Athens, the model under- NO2 levels are given by the partial CTM column. estimates only slightly the measurements in July while pro- The CTM overestimation for low NO2 tropospheric levels, ducing a higher underestimation during the winter month, and underestimation for higher levels, is also revealed, same as in the case of the surface observations, could point at as for Thessaloniki (Fig. S4) with different magnitudes, by both underestimated NOx emissions as well as too short a the scatter plots of the daily mean loads for the urban direc- NOx modelled lifetime. The boundary layer height assump- tion (Fig. S7) and rural directions (Fig. S8), with the equiva- tion appears to play a pivotal role in the case of Athens, lent statistics shown in Table 4. where the NO2 columns are measured above the first 500 m, The temporal evolution of the boundary layer height contributing to a stronger mixing of pollutants below 500 m (Fig. 9, black line), directly determined within LOTOS- early in the morning and a subsequent underestimation of EUROS by the ECMWF data, could explain the differences NO2 at higher altitudes. The importance of the appropri- between the diurnal variability of the LOTOS-EUROS par- ate boundary layer height in comparisons is also strong for tial column and full column (Fig. 9, blue and red lines re- the case of Thessaloniki, where the ground-based instrument spectively). In Fig. S9, the relative biases between the sim- views from the surface upwards. Figure S11 shows the diur- ulated partial column and the measurements at the urban di- nal variations of the surface LOTOS-EUROS NO2 simula- rection in July against the boundary layer heights are binned. tions at the same grid cell as the Thessaloniki MAX-DOAS When the height of the boundary layer is relatively low (be- for July (upper) and December (lower) together with the sur- tween 0 and 500 m) the model highly underestimates the face measurements of the in situ stations in the area. They measurements with relative differences higher than −50 %. show a similar variation with the MAX-DOAS and simulated This could point at an underestimated boundary layer height columns, overall underestimating all hourly in situ measure- before 07:00 and a subsequent mixing in the model mostly in ments. However, during the early hours in July the model the lower heights, which leads to lower concentrations in the simulates higher NO2 , pointing to an overestimation of the morning hours above the 500 m. This assumption was further surface simulations that is not present in the columnar com- confirmed where the diurnal variation between the surface parisons and may be attributed to a low boundary layer as- LOTOS-EUROS NO2 simulations and the in situ measure- sumed in the simulations. ments of the suburban industrial station Geoponiki, located Other parameters that play a pivotal role in both measure- at the same pixel of the Athens MAX-DOAS urban direc- ments and the simulations are related to meteorology, namely tion, is examined (Fig. S10). The surface simulations over- temperature and cloud coverage. According to Schaub et estimate the NO2 concentrations at 06:00 UTC, while for the al. (2007), high temperatures and longer days result in shorter Atmos. Chem. Phys., 21, 5269–5288, 2021 https://doi.org/10.5194/acp-21-5269-2021
I. Skoulidou et al.: Evaluation of the LOTOS-EUROS NO2 simulations 5281
NOx lifetimes compared to lower temperatures and fewer tween the monthly average observations and the correspond-
daylight hours, while they also showed that a cloud fraction ing simulations in each grid cell of the region.
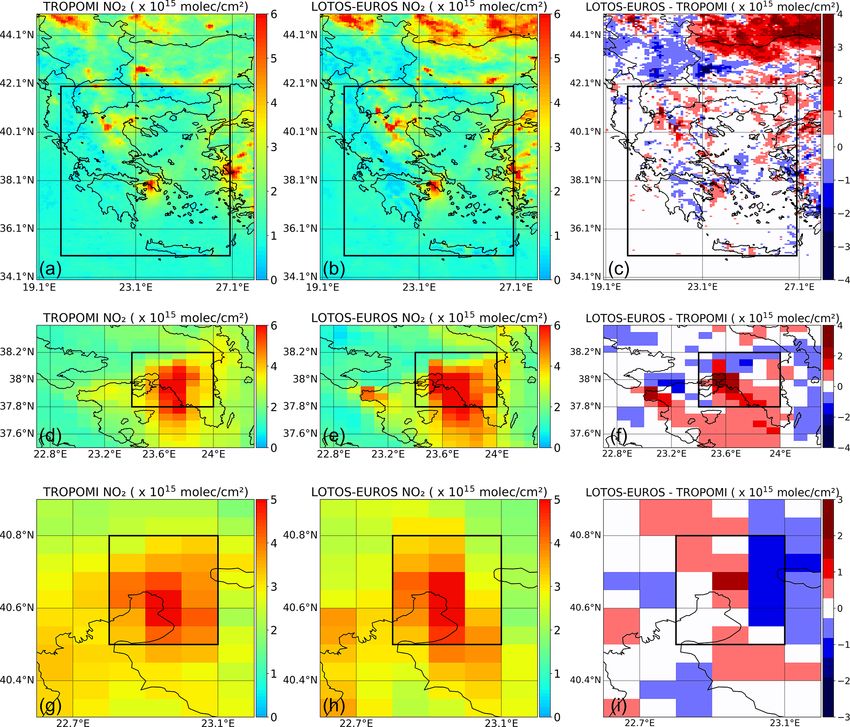
of 0.2 results in a longer NOx lifetime than a cloud fraction Over Greece, LOTOS-EUROS generally captures the ob-
of 0.1, as a result of the decreased amount of solar radiation served NO2 column abundances very well in July and De-
caused by the higher cloud fraction. Therefore, uncertainties cember (upper panels of Figs. 10 and 11, respectively), such
in the meteorological input data (cloudiness and temperature) as the densely populated area of Athens and the lignite-
in the model may induce uncertainties in the photochemi- burning power plants in the north-west of Greece, in the
cal conversion and lifetime of NOx . In addition, the MAX- area of Ptolemaida. The spatial correlation is quite high, at
DOAS tropospheric columns in both cities have been derived 0.78 for July and 0.87 in December, while the high back-
using the geometric approximation without taking into ac- ground levels of TROPOMI (a well-known feature to be
count the actual NO2 profile, therefore introducing additional updated in the next version of the official dataset) can be
uncertainty. easily distinguished in the difference plot (right column)
Finally, the pixel size used in the simulations, which is where the purple colour covering the entire region is ∼
constrained by the current CTM input parameters, should be −0.50 × 10¹⁵ molec cm−2 . This feature is mostly noticeable
discussed at this point. The 0.1 × 0.05◦ pixel covers a rel- during July when the mean bias is strongly negative, at
atively large area of the city of Thessaloniki and inadver- −0.59 × 10¹⁵ molec cm−2 , which leads us to estimate that,
tently includes some inhomogeneous air pollution patterns, for this issue, the relative bias between LOTOS-EUROS and
since it engulfs both the city centre as well as the surround- TROPOMI tropospheric NO2 columns over Greece is well
ing, cleaner, areas, while the MAX-DOAS probes air straight within the 10 % level.
from the city centre (Drosoglou et al., 2017). As a result, Over Athens, the spatial correlation is extremely high, at
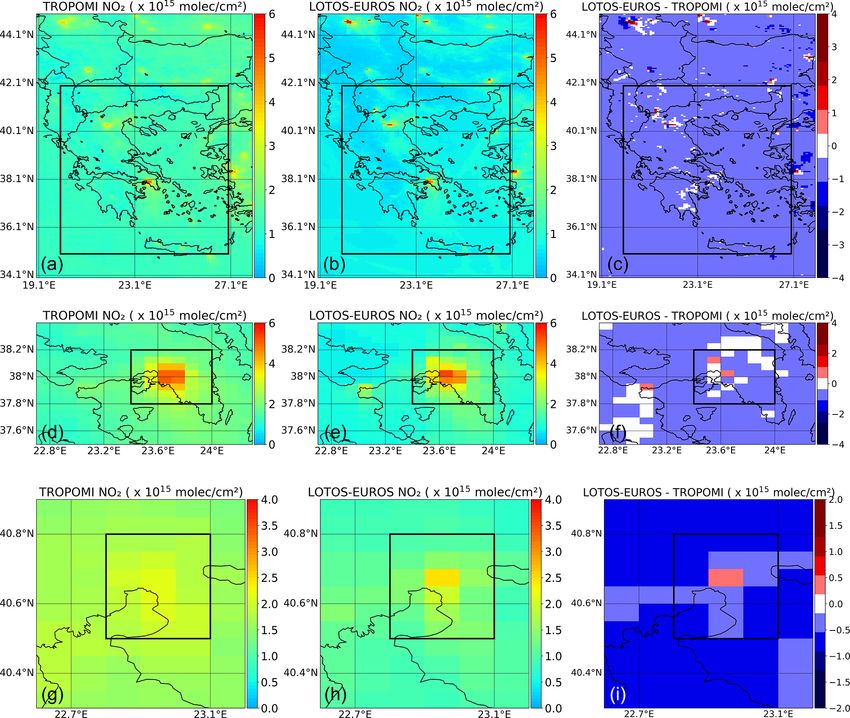
the relatively large grid pixel of the model simulation might 0.95 for summer and 0.82 for winter (Figs. 10 and 11, mid-
underestimate a possible horizontal plume from industrial ar- dle panels) while the absolute bias is extremely low, well be-
eas, such as that from chimneys. Vlemmix et al. (2015) found low the 1×10¹⁵ molec cm−2 level, resulting in relative biases
that MAX-DOAS low daily averaged NO2 columns are over- ∼ ±15 %. In December, the LOTOS-EUROS NO2 columns
estimated by LOTOS-EUROS, while higher columns are un- are higher mostly in the southern part of the sub-region of
derestimated, well in agreement with the results of this study Athens, over the sea area compared to TROPOMI, point-
at the rural directions. ing to a possible overestimation of the shipping emissions by
the CAMS 2015 inventory used in the simulations. Another
hot spot, shown by LOTOS-EUROS but not TROPOMI over
3.3 LOTOS-EUROS and Sentinel-5P TROPOMI
Athens, is at the Isthmus of Corinth, the narrow land bridge
vertical columns
which connects the Peloponnese peninsula with the rest of
the mainland of Greece, near the city of Corinth (approx.
Daily Sentinel-5P TROPOMI tropospheric NO2 columns 37.9◦ N, 23◦ E). Suggestions for possible NOx reductions in
were gridded onto the LOTOS-EUROS grid with the same the area will be studied when emission inventories for year
spatial resolution (0.1◦ × 0.05◦ ). The TROPOMI averaging 2018 are officially released.
kernels, which express the sensitivity of the instrument to Over Thessaloniki, the same conclusions can be drawn
the NO2 abundance within the distinct layers of the atmo- (lower panels of Figs. 10 and 11), with the comparisons
spheric column, are applied to the model profiles in order to within the 0.5 × 10¹⁵ molec cm−2 level for both seasons and
allow a consistent comparison between the modelled and ob- a higher spatial correlation in July (0.82) than in Decem-
served columns and to eliminate any possible errors in the ber (0.66). The spatial patterns created by the higher winter
TM5-MP a priori profile shapes (Eskes and Boersma, 2003). emissions may explain this seasonal difference in the com-
The averaging kernels are applied directly by the LOTOS- parisons, compared to the summertime where the main NO2
EUROS model as described in Sect. 2.3. Monthly averaged load is seen directly over the city centre.
tropospheric NO2 columns for the TROPOMI observations Compared to similar studies over urban sprawls, we re-
and LOTOS-EUROS simulations are shown in Figs. 10 and port on the comparison of the TROPOMI NO2 data with Pan-
11 for July and December, respectively, over Greece (upper) dora total columns in Helsinki which showed that TROPOMI
and the two sub-regions of Athens (middle) and Thessaloniki slightly overestimates the NO2 columns when they are rel-
(lower). The right columns in both figures show the abso- atively low and underestimates the high columns (Ialongo
lute difference between the TROPOMI and LOTOS-EUROS et al., 2020). This same feature was also shown by Zhao
columns. The regions to be statistically analysed in this work et al. (2020), who compared the TROPOMI total columns
are marked with black rectangles, and their resulting statis- with Pandora total columns in the Greater Toronto Area over
tics are shown in Table 5. Note that in this work tempo- an urban and suburban site and found negative biases while
ral correlation refers to the correlation between the average the same comparisons over a rural site showed positive bias.
daily values of TROPOMI and the simulations in each re- Dimitropoulou et al. (2020) validated TROPOMI NO2 tro-
gion, while spatial correlation refers to the correlation be- pospheric columns with MAX-DOAS measurements over an
https://doi.org/10.5194/acp-21-5269-2021 Atmos. Chem. Phys., 21, 5269–5288, 2021You can also read