Evaluation of the OMPS/LP stratospheric aerosol extinction product using SAGE III/ISS observations
←
→
Page content transcription
If your browser does not render page correctly, please read the page content below
Atmos. Meas. Tech., 13, 3471–3485, 2020
https://doi.org/10.5194/amt-13-3471-2020
© Author(s) 2020. This work is distributed under
the Creative Commons Attribution 4.0 License.

Evaluation of the OMPS/LP stratospheric aerosol extinction
product using SAGE III/ISS observations
Zhong Chen1,2 , Pawan K. Bhartia2 , Omar Torres2 , Glen Jaross2 , Robert Loughman3 , Matthew DeLand1 ,
Peter Colarco2 , Robert Damadeo4 , and Ghassan Taha5
1 ScienceSystems and Applications, Inc., Lanham, MA, USA
2 NASA  Goddard Space Flight Center, Greenbelt, MA, USA
3 Department of Atmospheric and Planetary Sciences, Hampton University, Hampton, VA, USA
4 NASA Langley Research Center, Hampton, VA, USA
5 GESTAR, Columbia, Maryland, USA

Correspondence: Zhong Chen (zhong.chen@ssaihq.com)

Received: 25 September 2019 – Discussion started: 7 November 2019
Revised: 19 May 2020 – Accepted: 20 May 2020 – Published: 30 June 2020

Abstract. The Ozone Mapping and Profiler Suite Limb Pro-         Version 1.5 dataset, which usually exist below 20 km in the
filer (OMPS/LP) has been taking limb-scattered measure-          Southern Hemisphere due to the lack of sensitivity to parti-
ments since April 2012. It is designed to produce ozone and      cles when the scattering angle (SA) is greater than 145◦ . We
aerosol vertical profiles at a 1.6 km vertical resolution over   also find that LP-retrieved extinction is systematically higher
the entire sunlit globe. The Version 1.5 (V1.5) aerosol ex-      than SAGE III/ISS observations at altitudes above 28 km and
tinction retrieval algorithm provides aerosol extinction pro-    systematically lower below 19 km in the tropics with signifi-
files using observed radiances at 675 nm. The algorithm as-      cant biases up to ±13 %. This is likely due in part to the fact
sumes Mie theory and a gamma function aerosol size dis-          that the actual aerosol size distribution is altitude dependent.
tribution for the stratospheric aerosol that is derived from     There are also other reasons related to cloud contamination,
results calculated by the Community Aerosol and Radia-           wavelength limitations, aerosol loading, and the influence of
tion Model for Atmospheres (CARMA). In this paper, we            the viewing configuration.
compare V1.5 LP aerosol profiles with SAGE III/ISS solar
occultation observations for the period from June 2017 to
May 2019, when both measurements were available to evalu-
ate our ability to characterize background aerosol conditions.   1   Introduction
Overall, LP extinction profiles agree with SAGE III/ISS data
to within ± 25 % for altitudes between 19 and 27 km, even        The stratospheric aerosol layer is an important component
during periods perturbed by volcanic eruptions or intense        of Earth’s atmosphere through its impacts on climate and
forest fires. In this altitude range, the slope parameter of     stratospheric ozone physico-chemistry (Vernier et al., 2011;
linear fitting of LP extinction values with respect to SAGE      Ridley et al., 2014; Bingen et al., 2017). The stratospheric
III/ISS measurements is close to 1.0, with Pearson correla-      aerosol layer was first observed by Junge in 1960 (Junge
tion coefficients of r ≥ 0.95, indicating that the LP aerosol    et al., 1961). Stratospheric aerosols that mainly originate
data are reliable in that altitude range. Comparisons of ex-     from volcanic sources are described as liquid droplets com-
tinction time series show that both instruments capture the      posed of a mixture of the sulfuric acid, H2 SO4 , and water,
variability of the stratospheric aerosol layer quite well, and   H2 O (Kremser et al., 2016). Recent measurements show that
the differences between the two instruments vary from 0 %        the background stratospheric aerosol layer is variable rather
to ±25 % depending on altitude, latitude, and time. In con-      than constant, and that changes in the stratospheric aerosol
trast, we find erroneous seasonal variations in the OMPS/LP      layer have caused observable changes in recent tropospheric
                                                                 warming rates (Solomon et al., 2011), indicating that it is

Published by Copernicus Publications on behalf of the European Geosciences Union.
3472                                     Z. Chen e al.: Evaluation of the OMPS/LP stratospheric aerosol extinction product

important to monitor the stratospheric aerosol layer over the         comparison with independent datasets from SAGE III/ISS.
long term. The importance of possible changes in the back-            The central scope of the paper is the evaluation of the LP
ground stratospheric aerosol layer led to the analysis of each        algorithm performance for background aerosol situations.
volcanically quiescent period (Deshler et al., 2006). For the         Here, we document a more comprehensive evaluation of
considered period from January 1979 through to the end of             this new version of the OMPS/LP aerosol product. The lat-
2004, the variability of stratospheric aerosol layer is explored      est versions, i.e., Version 1.5 of LP and Version 5.1 of
using measurements from space-based instruments such as               SAGE III/ISS, are used. The objective of this comparison
SAGE II (Thomason et al., 2008), CALIPSO (Winker et al.,              is to assess the reliability of the LP Version 1.5 algorithm
2010), GOMOS/Envisat (Vanhellemont et al., 2010), SCIA-               and to identify potential problems. The differences in the
MACHY (von Savigny et al., 2015), OSIRIS/Odin (Bourassa               aerosol extinction values observed by the two instruments are
et al., 2007), SAGE III/ISS (Chu and Veiga, 1998), and                analyzed and discussed. Our analysis of SAGE III/ISS data
OMPS/LP (Loughman et al., 2018).                                      specifically addresses possible biases with OMPS/LP results
   The Ozone Mapping and Profiler Suite (OMPS) Limb Pro-              arising from differences in vertical resolution and possible
filer (LP) is one of three OMPS instruments onboard the               ozone contamination. The impact of volcanic perturbations
Suomi National Polar-orbiting Partnership (S-NPP) satellite           on the retrievals is also investigated.
(Flynn et al., 2007). S-NPP was launched in October 2011,
into a sun-synchronous polar orbit with a 13:30 local Equa-
tor crossing time. The LP instrument collects limb-scattered          2   LP algorithm description
radiance data on a 2-D charge-coupled device (CCD) array
                                                                      The previous Version 1 aerosol retrieval algorithm for
over a wide spectral range (290–1000 nm) and a wide ver-
                                                                      OMPS/LP is described in detail by Loughman et al. (2018).
tical extent (0–80 km) through three parallel vertical slits.
                                                                      Here, we provide a brief description of key changes imple-
These spectra are primarily used to retrieve vertical pro-
                                                                      mented in the retrieval algorithm for processing the V1.5
files of ozone (Rault and Loughman, 2013; Kramarova et al.,
                                                                      dataset.
2018), the aerosol extinction coefficient (Loughman at al.,
                                                                        In the V1.5 algorithm, a gamma-function-based ASD is
2018; Chen et al., 2018), and cloud-top height (Chen et al.,
                                                                      assumed (Chen et al., 2018):
2016). The vertical sampling of LP measurements is about
1 km, and the vertical resolution of the retrieved profiles is                 dN   N0 β α r α−1
approximately 1.6 km. More details about the OMPS/LP in-              n(r) =      =              exp(−rβ),                        (1)
                                                                               dr     0(α)
strument design and capabilities are provided in Jaross et
al. (2014).                                                           where n(r) is the number of particles N per unit volume with
   Recently, a new aerosol size distribution (ASD) based on a         a size between radius r and r + dr (cm−3 µm−1 ), N0 is the
gamma function that is derived from results calculated by the         total number density of aerosols (cm−3 ), 0 is Euler’s gamma
Community Aerosol and Radiation Model for Atmospheres                 function, α is the shape parameter, and β (µm−1 ) is the scale
(CARMA) was introduced into the Version 1.5 OMPS/LP                   parameter. At small radii this function follows a power law,
aerosol extinction retrieval algorithm (Chen et al., 2018). The       whereas at large radii it follows an exponential function.
assumed ASD is designed to represent the long-term back-              The cross section and aerosol scattering phase function (PF)
ground stratospheric aerosol loading. We use the CARMA                are then calculated using Mie theory assuming liquid sul-
model output to take advantage of its large range of simulated        fate spherical particles with a refractive index from Russell et
particle size information, and we find that a gamma size dis-         al. (1996). The α and β parameters are determined by fitting
tribution represents a significantly better fit to its size distri-   the gamma distribution to size distributions for stratospheric
bution than a lognormal distribution. In a recent study, Nyaku        sulfate simulated by the Community Aerosol and Radiation
et al. (2020) confirmed that the CARMA model agrees well              Model for Atmospheres (CARMA) module running online in
with the Wyoming optical particle counter (OPC) measure-              the Goddard Earth Observing System (GEOS) global model
ments. Chen et al. (2018) tested the Version 1.5 algorithm by         (after English et al., 2011; Colarco et al., 2014). The fitted
comparing 7 months of data (June–December 2017) between               ASD yields an Ångström exponent (AE) of 2.08 and an ef-
the OMPS/LP and the Stratospheric Aerosol and Gas Exper-              fective radius (reff ) of 0.18 µm; these values are similar to
iment III instrument onboard the International Space Station          the average values determined from SAGE II Version 7.0
(SAGE III/ISS). The limited comparison showed the consis-             aerosol extinction data (Thomason et al., 2008; Damadeo
tency of the aerosol extinction measurements from both in-            et al., 2013) between 20 and 25 km (red and green dots in
struments, with a correlation coefficient of 0.97 and slope of        Fig. 1), from measurements at 525 and 1020 nm taken dur-
1.05. The Version 1.5 OMPS/LP aerosol products are now                ing the period from 2000 to 2005, which is characterized
being processed routinely, and additional SAGE III/ISS data           by a low volcanic background. This was a period when the
are available.                                                        stratosphere was relatively clean and roughly similar to the
   This work extends the previous results shown in Chen et            present-day stratosphere. Note that the average SAGE II AE
al. (2018) to evaluate LP aerosol extinction profiles through         values at 30 km (blue dots in Fig. 1) are larger than those

Atmos. Meas. Tech., 13, 3471–3485, 2020                                                https://doi.org/10.5194/amt-13-3471-2020
Z. Chen e al.: Evaluation of the OMPS/LP stratospheric aerosol extinction product                                               3473

                                                                       3     Evaluation analysis

                                                                       3.1    SAGE III/ISS data

                                                                       The SAGE III/ISS developed by the NASA Langley Re-
                                                                       search Center (LaRC) was launched to the International
                                                                       Space Station in February 2017. SAGE III/ISS makes sun-
                                                                       rise and sunset occultation measurements of aerosols and
                                                                       gas concentrations in the stratosphere and upper troposphere
                                                                       (Chu et al., 1998). The ISS travels in a low-Earth orbit at
                                                                       an altitude of 330–435 km and an inclination of 51.6◦ . With
Figure 1. Time series of the SAGE II Ångström exponent (AE) de-        these orbital parameters, solar occultation measurement op-
rived from the aerosol extinction coefficients measured at 525 and     portunities cover a large range of latitudes (between 70◦ S
1020 nm for altitudes of 30 km (blue), 25 km (green), and 20 km
                                                                       and 70◦ N). The instrument measures up to 31 combined sun-
(red). This figure shows SAGE II Version 7.0 data for the 0–10◦ N
                                                                       rise and sunset profiles each day. A general description of the
latitude band during the period from 1986 to 2005. While the
Pinatubo eruption in 1991 produced a significant decrease in the       solar occultation measurement technique is provided by Mc-
AE, the smaller volcanic eruptions, such as Ruang and Reventador       Cormick et al. (1979). Aerosol extinction at nine wavelengths
in 2002 and Manam in 2005, which are visible in the extinction         (384.2, 448.5, 520.5, 601.6, 676.0, 756.0, 869.2, 1021.2, and
time series (not shown), did not appreciably affect AE values. The     1544.0 nm) are provided by SAGE III/ISS from the surface
AE values appear to stabilize after 2000, suggesting that a back-      or cloud top to an altitude of 45 km, with a vertical reso-
ground state exists. The AE is quite scattered at 30 km compared       lution of 0.5 km at the tangent point location. The SAGE
with lower altitudes, which is related to the reduced quality of the   III/ISS series of aerosol occultation measurements have been
aerosol retrieval for low aerosol loading.                             extensively evaluated and compared with other space-based
                                                                       instruments, and they have been found to have relatively
                                                                       high precision and accuracy (Thomason et al., 2010, 2018;
at lower altitudes. Other time periods known to have low               Bourassa et al., 2012; Kovilakam and Deshler, 2015; von
aerosol loading (e.g., 1989–1990) show lower AE values be-             Savigny et al., 2015; Rieger et al., 2018). In this work, we
tween 20 and 25 km in the SAGE II dataset. Thus, the refer-            use SAGE III/ISS Version 5.1 data, including both sunrise
ence ASD adopted here for LP retrievals may produce a bias             and sunsets, which were collected during the period from
in the extinction values derived during medium or high vol-            June 2017 to May 2019. Figure 2 shows the spatial and tem-
canic aerosol loading. The variability in aerosol properties           poral coverage of the available datasets during the 2017–
with altitude observed by SAGE II is related to variability in         2019 period considered in this study.
temperature and humidity fields that affects the aerosol size
distribution and refractive index (Steele and Hamill, 1981;            3.2    Methodology
Russell et al., 1996), both of which have a direct effect on the
PF. This variability also (and more significantly) depends on          Chen et al. (2018) described previous LP–SAGE III/ISS
the aerosol load in the stratosphere, especially if a large time       comparisons using SAGE III/ISS Version 5.0 data for the
period is considered (as in Fig. 1). Assuming that the aerosol         7-month period from June to December of 2017. The first
signal in line of sight radiances is roughly proportional to           comparison was conducted in two steps: first, all data were
the PF, aerosol extinction profiles at 675 nm are retrieved us-        binned and averaged in 10◦ latitude bins for each altitude for
ing an iterative technique (see Sect. 4.2 of Loughman et al.,          groups of 1–3 consecutive days depending on the number of
2018), based on Chahine’s non-linear relaxation technique              SAGE III/ISS samples; second, the averaged extinction pro-
(Chahine, 1970). Atmospheric pressure and temperature pro-             files at 675 nm for LP and at 676 nm for SAGE III/ISS were
files used in this retrieval algorithm are obtained from the           compared directly. In this work, both datasets were averaged
GEOS atmospheric analyses produced by the NASA God-                    zonally for each 5◦ latitude band per day at each of their re-
dard Space Flight Center (GSFC) Global Modeling Assimi-                spective altitudes. The daily averaged data in the same lat-
lation Office (GMAO). For the LP aerosol product, retrievals           itude bin and on the same day were used for the compar-
are only performed for daytime observations (a solar zenith            ison with an assumption that the variation with longitudinal
angle, SZA, less than 88◦ ).                                           band is much smaller than the variation with latitudinal band.
                                                                       For background aerosol situations, the longitudinal variation
                                                                       of stratospheric aerosol could be small because of efficient
                                                                       mixing in the zonal direction and strong horizontal transport
                                                                       prevailing in the region (Sunilkumar et al., 2011). In cases
                                                                       of medium to large volcanic eruptions, however, longitudinal
                                                                       differences could be large and a restriction should be placed

https://doi.org/10.5194/amt-13-3471-2020                                                 Atmos. Meas. Tech., 13, 3471–3485, 2020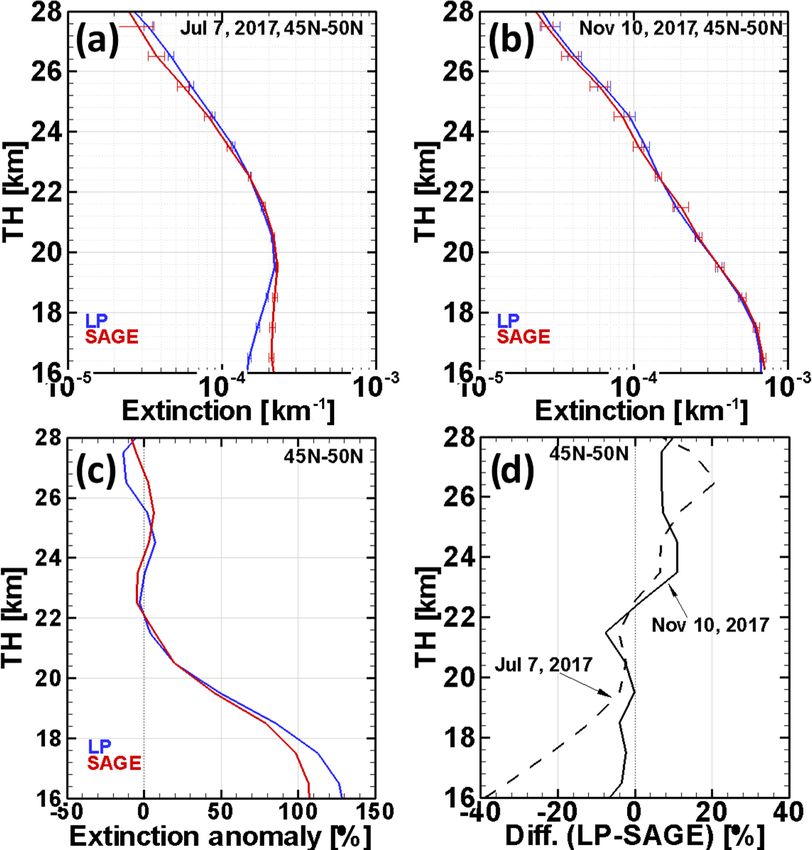
3474                                     Z. Chen e al.: Evaluation of the OMPS/LP stratospheric aerosol extinction product

Figure 2. Time–latitude sampling pattern for OMPS/LP (light blue) and SAGE III/ISS (red) during the period from June 2017 to May 2019.

                                                                      it derives from the “MLR” ozone product), and any bias in
                                                                      ozone would result in a bias in the aerosol extinction values
                                                                      in the vicinity of the Chappuis bands depending upon alti-
                                                                      tude and ozone concentration. To avoid possible biases in the
                                                                      676 nm aerosol extinction reported by SAGE III/ISS, asso-
                                                                      ciated with remaining ozone absorption effects, the aerosol
                                                                      channels at 449 and 756 nm were used in this study to in-
                                                                      terpolate to 675 nm SAGE III/ISS extinction profiles using a
                                                                      log-linear interpolation. Figure 3a shows SAGE III/ISS pro-
                                                                      files of the reported 675 nm aerosol extinction (black line)
                                                                      and the 675 nm aerosol extinction recalculated by spectral
                                                                      interpolation (green line) at 0.5 km vertical resolution. Large
                                                                      differences between the reported and recalculated SAGE
                                                                      III/ISS extinction values are apparent above 27 km. The ex-
                                                                      tinction minimum at 29 km in the original data is not present
Figure 3. An example LP–SAGE comparison of average extinc-            in the interpolated profile. Also shown is the corresponding
tion profiles in the 10–15◦ S latitude band for 1 d, 14 Septem-       LP profile (blue line) at a 1.0 km sampling grid. Since the
ber 2018. (a) Comparison of extinction profiles among original        SAGE III/ISS data are given at 0.5 km intervals, while the
SAGE (black), interpolated SAGE (green), and retrieved LP (blue).     vertical resolution of LP is around 1.6 km, the vertical res-
(b) Comparison of extinction profiles between the smoothed ver-       olution of SAGE III/ISS was then degraded to match the
sion of the recalculated SAGE profile (red) and the LP retrieval
                                                                      OMPS/LP vertical resolution using a seven-point binomial
profile. Applying a combination of the smoothing and interpola-
                                                                      smoothing function given by the following expression:
tion approaches to the original SAGE data improves the compari-
son above 19 km. The horizontal error bars on the √ mean extinction            X7
profiles indicate the standard error of the mean, σ/ N .              k(z) =     i=1
                                                                                       k(z + 1zi ) × w(i);
                                                                      1zi = −1.5, −1, −0.5, 0.0, 0.5, 1, 1.5;
                                                                      w(i) = [1, 6, 15, 20, 15, 6, 1]/64,                         (2)
on longitude to capture the signature of potential longitudinal
variation. Only LP data from the center slit were taken into          where k is the extinction, w is the weighing factor, and z is
consideration because the center slit has better stray-light and      the altitude grid point. This procedure approximates a Gaus-
tangent height corrections compared with the left and right           sian smoothing of continuous data with a full width at half
slits (Moy et al., 2017; Kramarova et al., 2018). The current         maximum of about 1.6 km. This spectrally interpolated and
cloud detection algorithm (Chen et al., 2016) detects cloud-          vertically smoothed SAGE III/ISS data are used for all com-
top height from the OMPS/LP measurements using the spec-              parisons in this paper. Figure 3b provides an example of the
tral dependence of the vertical gradient of radiances at 675          comparison of extinction profiles between the LP-retrieval
and 868 nm. Cloud-top height is identified when the gradient          profile (blue line) and the smoothed version of the recalcu-
difference increases above 0.15. All LP data below the cloud-         lated SAGE profiles (red line). The figure shows how LP and
top height were rejected because extinction changes abruptly          the smoothed+interpolated SAGE III/ISS profile are similar
at cloud top.                                                         above 19.5 km and have more disagreement below this alti-
   As the SAGE III/ISS science team pointed out (Larry                tude. In the upper troposphere–lower stratosphere (UTLS),
W. Thomason, personal communication, 2019; Wang et al.,               particularly in the tropics, the presence of thicker aerosol
2020), the reported SAGE III/ISS aerosol extinction is re-            layers may have an impact on the retrieved extinction lev-
trieved as a residual of using a spectrally focused fitting (i.e.,    els (Bourassa et al., 2012; Fromm et al., 2014; Kremser et

Atmos. Meas. Tech., 13, 3471–3485, 2020                                                  https://doi.org/10.5194/amt-13-3471-2020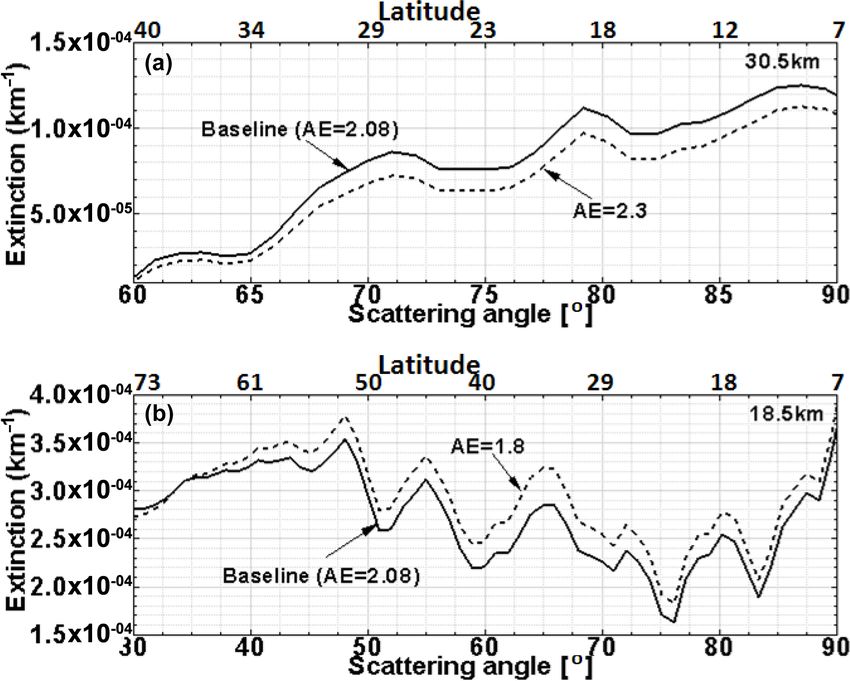
Z. Chen e al.: Evaluation of the OMPS/LP stratospheric aerosol extinction product                                             3475

al., 2016). In addition, sea salt can also increase the par-        measurements is the stray-light error which increases with
ticle size in the UTLS due to water uptake (Brühl et al.,           altitude. At higher altitudes where LP radiance is small, the
2018). Cirrus cloud contamination could be another issue in         stray-light error becomes most significant.
the lower stratosphere below about 19 km. Clouds appear as             Figure 5 shows the time series comparison between
discontinuities of the limb radiance vertical profiles, which       OMPS/LP and SAGE III/ISS measurements at 15.5 km (left
will tend to bias the retrieved result. Although most clouds        column), 20.5 km (middle column), and 25.5 km (right col-
are detected and filtered from the LP retrievals, it is not al-     umn) for different latitude bands outside the tropics where
ways possible to completely eliminate cloud contamination.          clouds are not an issue. The blue and black dots in Fig. 5 rep-
Furthermore, large differences (about 60 %) between the two         resent the LP extinction calculated at scattering angles (SA)
instruments are expected at lower altitudes near and below          of less than 145◦ and greater than 145◦ , respectively. Again,
the tropopause due to larger variability in the transport of air    the highly variable nature of the stratospheric aerosols with
masses.                                                             time and latitude is well represented by the two instruments.
                                                                    Canadian pyrocumulonimbus (PyroCb) was most probably
                                                                    responsible for the increasing aerosol extinction values at
4     Results and discussion                                        15.5 and 20.5 km in the 35–55◦ N latitude bands in late 2017,
                                                                    and the effect of Mt. Ambae can be seen in the 35–55◦ S time
4.1    Aerosol extinction variability                               series in late 2018. Good agreement is found between both
                                                                    instruments at 20.5 and 25.5 km, although there are some
Figure 4 depicts the time series of Version 1.5 OMPS/LP             negative biases in the Southern Hemisphere (SH). In con-
(blue symbols) and SAGE III/ISS (red symbols) at 20.5,              trast to the results for altitude at 30.5 km (right column in
25.5, and 30.5 km in the tropics from June 2017 through             Fig. 4), the LP values at 15.5 km are systematically smaller
May 2019. The time-dependent variability of each dataset            than those from SAGE III/ISS. A discussion of this system-
is similar, and data features associated with specific aerosol      atic difference is given in Sect. 4.3.
events observed by SAGE III/ISS are also present in the                A notable feature in Fig. 5 is that the comparisons in the
LP record. The observed large aerosol extinction increase           Northern Hemisphere (NH) are generally better than in the
at 20 km apparent in both data records by the end of 2018           SH. In the southern midlatitudes (35–55◦ S), the LP retrievals
is associated with the eruption of Mt. Ambae (June 2018 at          show significant seasonal variations at 20.5 and 25.5 km that
15◦ S). For the background aerosol condition based on the           are not seen by SAGE III/ISS. The obvious seasonal variabil-
June 2017 to June 2018 period, LP and SAGE III/ISS are              ity in the differences with the amplitudes of winter minima
within 20 % of each other at 20.5 and 25.5 km, indicating that      was observed to be about 25 % at 20.5 km and as much as
the assumed ASD in the LP V1.5 algorithm is adequate in             200 % at 15.5 km. The presence of erroneous seasonal vari-
this altitude range. The large temporal variability present in      ations in the OMPS/LP dataset is mostly caused by the lim-
both datasets at 30.5 km is suggestive of a quasi-biennial os-      itation of the wavelength at 675 nm when observing under
cillation (QBO) signal, although there is a shift in phase be-      backscattering conditions at extremely large scattering an-
tween latitude bands. At 30.5 km, the agreement is not quite        gles. These results lead us to recommend filtering LP data
as good, and LP retrievals are systematic higher than SAGE          below 20 km with an SA greater than 145◦ . The limitations
III/ISS extinctions for all latitude bins with positive biases up   of the LP retrievals at 675 nm will be addressed in Sect. 4.5.
to 50 %. The large biases reflect the very small aerosol load
at altitudes above 30 km. Under low aerosol conditions, both        4.2   Effect of volcanic eruptions and PyroCbs
instruments are less sensitive to smaller particles (Rieger et
al., 2018). For example, the AE values from SAGE II are             To investigate the impacts of volcanic eruptions and intense
quite scattered at 30 km compared with lower altitudes (see         wildfires on the LP retrievals, aerosol extinction profiles from
Fig. 1), which may be related to the reduced quality of the         OMPS/LP and SAGE III/ISS were intercompared in the af-
aerosol retrieval for low aerosol loading. In contrast, the sys-    termath of the eruption of Mt. Ambae (2018) and the Cana-
tematic positive bias between LP and SAGE III/ISS may be            dian wildfires (2017) sampled by these instruments.
due in part to the fact that the actual ASD and refractive in-         Volcanic eruptions are the largest source of long-lived
dex, which depend on temperature and humidity (Steele and           aerosols in the stratosphere (Vernier et al., 2011; Kremser
Hamill, 1981; Russell et al, 1996), are not truly independent       et al., 2016; Bingen et al., 2017). The Ambae eruption oc-
of height as currently assumed in the LP algorithm. While           curred on 27 July 2018, on Ambae Island, located near 15◦ S,
the SAGE III/ISS algorithm does not require any assump-             167◦ E, and had a clear impact on the stratospheric aerosol
tions about aerosol microphysics, aerosol extinction profiles       load. Figure 6a–d show comparisons of LP and SAGE III
from OMPS/LP suffer from uncertainties due to assumed               zonally averaged stratospheric aerosol profiles between 0–
ASD and refractive index. Additionally, uncertainties in LP         5◦ N on 3 d before the eruption (Fig. 6a, b, c), along with the
radiance measurements are assumed to be 1 % (Kramarova              relative differences on each day (Fig. 6d). Pre-eruption LP
et al., 2018), and the primary source of error in LP radiance       measurements agree within 5 % of SAGE III/ISS observa-

https://doi.org/10.5194/amt-13-3471-2020                                              Atmos. Meas. Tech., 13, 3471–3485, 2020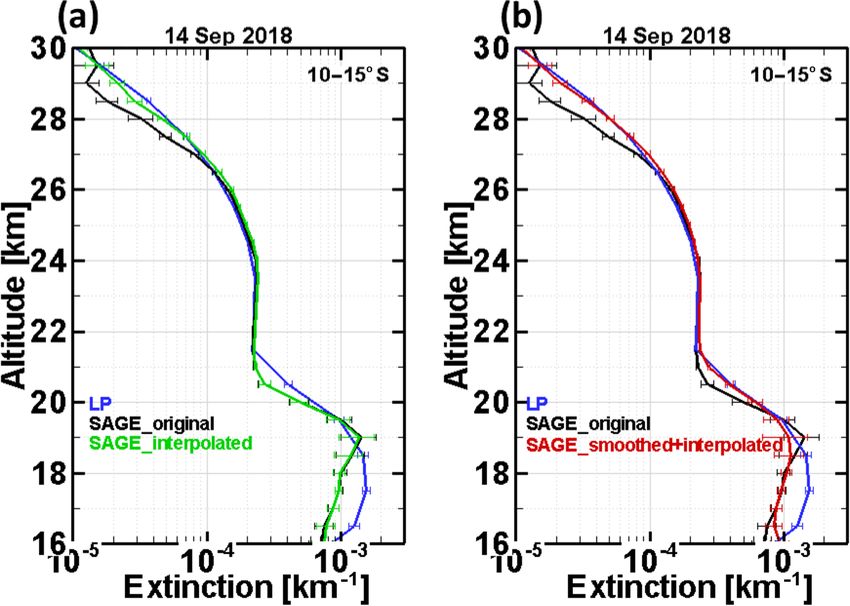
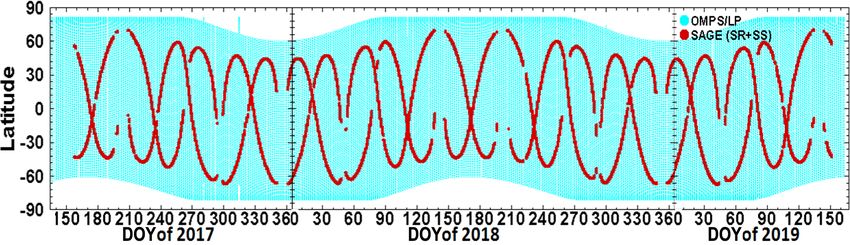
3476                                     Z. Chen e al.: Evaluation of the OMPS/LP stratospheric aerosol extinction product

Figure 4. Comparison of the daily zonal mean time series of LP V1.5 (blue) and SAGE III/ISS V5.1 (red) extinction values at 675 nm for
an altitude of 20.5 km (left column), 25.5 km (middle column), and 30.5 km (right column) for 5◦ latitude bands in the tropics (20–25◦ S,
10–15◦ S, 0–5◦ N, 10–15◦ N, and 20–25◦ N, from the top to bottom)√during the period from June 2017 to May 2019. Vertical error bars on
the SAGE measurements indicate the standard error of the mean, σ/ N.

Figure 5. Same as Fig. 4 but for altitudes at 15.5 km (left), 20.5 km (middle), and 25.5 km (right) for latitude bands outside the tropics
(50–55◦ S, 35–40◦ S, 35–40◦ N, and 50–55◦ N, from the top to bottom). The blue and black dots represent LP extinction values at scattering
angles (SA) less than 145◦ and greater than 145◦ , respectively. The LP extinction below 20 km at southern latitudes (35–55◦ S) shows the
presence of erroneous seasonal variations due to the lack of sensitivity to aerosol when the SA is greater than 145◦ .

Atmos. Meas. Tech., 13, 3471–3485, 2020                                                  https://doi.org/10.5194/amt-13-3471-2020
Z. Chen e al.: Evaluation of the OMPS/LP stratospheric aerosol extinction product                                                       3477

Figure 6. Comparison of daily zonal mean of OMPS/LP (blue) and SAGE III/ISS (red) aerosol extinction profiles in the 0–5◦ N latitude bin
for 6 individual days prior to (a)–(c) and after (e)–(g) the Ambae eruption on 27 July 2018. The corresponding relative differences between
          √ are also shown in panels (d) and (h). The horizontal error bars on the mean extinction profiles indicate the standard error of the
LP and SAGE
mean, σ/ N. Enhanced extinction values around 20 km after the eruption (e)–(g) are observed compared with before the eruption (a)–(c).

tions over the 20–25 km altitude range. SAGE III/ISS mea-                Both instruments clearly captured the stratospheric aerosol
surements were not available at 0–5◦ N until approximately               perturbation triggered by the reported PyroCb. We chose
3 weeks after the eruption, due to the complex sampling pat-             7 July 2017 as the “before” case (Fig. 7a). SAGE III/ISS ob-
tern shown in Fig. 2. OMPS/LP data show significant longi-               servations at high northern latitudes were not available un-
tudinal transport of the stratospheric aerosol plume during              til September 2017, during which time the enhanced strato-
this period; thus, we have also used zonal mean averages                 spheric aerosol spread rapidly in longitude. SAGE III/ISS re-
to compare post-eruption results. Larger differences (up to              sults in September–October 2017 at 50◦ N show significantly
20 %) are observed for post-eruption conditions as shown                 increased scatter. Therefore, we calculated the difference for
in Fig. 6e–h. The enhanced extinction around 20 km after                 LP and SAGE III/ISS separately using 10 November 2017 as
the eruption was captured by both OMPS/LP and SAGE                       the “after” case (Fig. 7b) to show the anomaly results. As ex-
III/ISS observations. Much larger differences between the                pected, Fig. 7c shows large positive extinction anomalies of
two datasets are apparent below 20 and above 25 km both                  up to 140 % below 22 km. The comparison also shows good
before and after the volcanic eruption.                                  agreement between LP-retrieved extinction profiles and ob-
   In addition to volcanic eruptions, intense wildfires can also         servations from SAGE III/ISS within ±20 % at 18–28 km.
cause aerosol perturbations in the UTLS. The occurrence of               Since the LP algorithm assumes a fixed refractivity index
PyroCbs triggered by intense wildfires in British Columbia,              which is dependent on aerosol type, the wrong aerosol type
Canada, were reported on 12 August 2017. Within 2 months                 (sulfate instead of carbonaceous aerosols) leads to an incor-
of injection, the plume can reach up to nearly 22 km (Peter-             rect phase function, which then produces an error in the re-
son et al., 2018; Torres et al., 2020) and can be transported            trieved extinction. For SAGE III/ISS, this assumption is not
globally (Kloss et al., 2019). A before and after analysis               needed, so there is less impact.
was carried out to evaluate the performance of the LP algo-
rithm following the stratospheric injection of carbonaceous              4.3    LP retrievals above 27 km and below 19 km
aerosols. Zonal averages of the SAGE III/ISS and LP aerosol
extinction retrievals for the 45–50◦ N latitude band before              All comparisons shown in Figs. 4–7 have some features in
and after the aerosol injection effect were compared. Fig-               common. The best agreement is found for the altitude range
ure 7 highlights the emergence of new stratospheric aerosol              roughly between 19 and 27 km, but systematic and signif-
layers before and after the fire event in Canada in late 2017.           icant differences are observed above 28 and below 19 km.

https://doi.org/10.5194/amt-13-3471-2020                                                     Atmos. Meas. Tech., 13, 3471–3485, 2020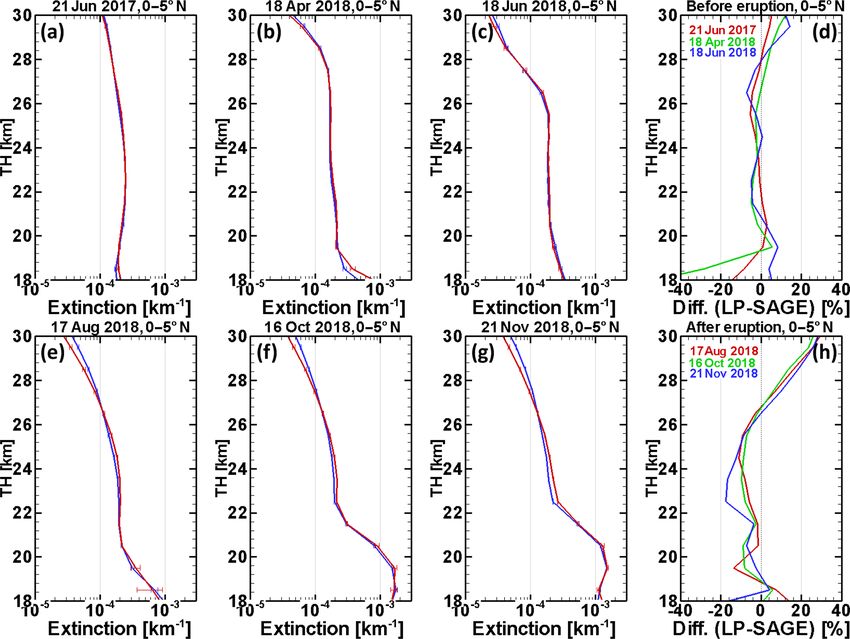
3478                                     Z. Chen e al.: Evaluation of the OMPS/LP stratospheric aerosol extinction product

                                                                      Figure 8. This figure shows how the aerosol phase function (PF) at
                                                                      675 nm changes when the AE is perturbed by ±10 % of the baseline
                                                                      value of 2.08.

                                                                      cate that changes in the assumed PF will result in significant
                                                                      changes in the retrieved aerosol extinction values.
                                                                         Figure 9 shows that the use of the baseline AE value (2.08)
                                                                      produces significant error (up to ±13 %) in the retrieved ex-
                                                                      tinction at 30.5 and 18.5 km relative to the outcome when
                                                                      using AE values comparable to those from SAGE II v7.0
Figure 7. Comparison of the daily zonal mean of OMPS/LP (blue)
                                                                      data. The results of this sensitivity analysis show that when
and SAGE III/ISS (red) aerosol extinction profiles in the 45–50◦ N
latitude bin (a) before (7 July 2017) and (b) after (10 Novem-
                                                                      taking the altitude dependency of stratospheric aerosol prop-
ber 2017) the Canadian PyroCb event in late 2017 as well as the       erties into account, the LP algorithm performance improves
(c) extinction anomaly (defined as the deviation from the before      at those levels. Figure 10 shows differences in aerosol ex-
case) and (d) the corresponding relative differences between LP and   tinction between OMPS/LP and SAGE III/ISS at 30.5 km
SAGE. The horizontal error bars on the mean
                                          √ extinction profiles in-   in the tropics (Fig. 10a) and at 18.5 km in northern midlat-
dicate the standard error of the mean, σ N . Enhanced extinction      itudes (Fig. 10b) plotted as a function of the LP scattering
values below 22 km after the fire are observed in panel (c).          angle (SA) for the entire comparison period to examine if the
                                                                      assumed ASD is reasonable. As discussed earlier, if the as-
                                                                      sumed ASD is correct, the difference in the extinction should
                                                                      be SA independent in the SA range from 50 to 100◦ . The
These systematic differences change with altitude and may             differences shown in Fig. 10 vary significantly with the SA
be associated with the algorithm assumption of a time- and            in the abovementioned range, suggesting that the currently
altitude-independent aerosol model (i.e., refractive index and        assumed ASD in the LP algorithm does not adequately rep-
ASD) and the corresponding PF. SAGE III/ISS cannot mea-               resent the actual ASD for altitudes of 30.5 and 18.5 km. As a
sure the PF, but the aerosol spectrum (in this case the approx-       result, the potential ASD error propagates into extinction un-
imation of the AE) can be used as an effective qualitative            certainties above 28 and below 19 km. Another important as-
indicator of particle size (Hayashida and Horikawa, 2001;             pect that influences the comparison below 19 km is the pres-
Schuster et al., 2006; Damadeo et al., 2013; Rieger et al.,           ence of clouds and thicker aerosol layers, as discussed earlier
2018).                                                                (Fig. 3). Near or below the tropopause, big disagreements be-
   To examine the LP algorithm performance of the aerosol             tween the two instruments can also be expected due to the
retrieval due to the assumed ASD, we perturbed the nomi-              variability in the transport of air masses.
nal gamma ASD fitting parameters so that the resulting AE                The sensitivities given in Figs. 8–10 suggest that the dif-
yielded values of 2.3 and 1.8 (about ±10 % of the algorithm’s         ferences in extinctions between the two instruments could be
baseline value of 2.08). The 2.3 value is close to the reported       partly explained by the variation in the AE. Figure 11 illus-
average SAGE II AE at 30 km for the period from 2000 to               trates how the AE varies. In the figure, the monthly mean
2005 (blue dots in Fig. 1), whereas the AE value of 1.8 re-           AE (Fig. 11a) derived from the vertically smoothed SAGE
sembles a similar SAGE II average at 18 km in the case of             III/ISS data calculated using Eq. (2) and the differences be-
reduced aerosol load. The perturbed ASDs, associated with             tween the SAGE III/ISS and OMPS/LP extinction values at
AE values of 1.8 and 2.3, were used to estimate the resulting         675 nm (Fig. 11b) are plotted as a function of altitude and
effect on the calculated 675 nm PF (as shown in Fig. 8). A            time at different latitude bands in the tropics. To draw a corol-
±10 % change in the AE can produce about a ±15 % change               lary to SAGE II, the AE is derived using the aerosol extinc-
in the PF. The results of the sensitivity analysis in Fig. 8 indi-    tion values at 520 and 1020 nm. However, to avoid potential

Atmos. Meas. Tech., 13, 3471–3485, 2020                                                 https://doi.org/10.5194/amt-13-3471-2020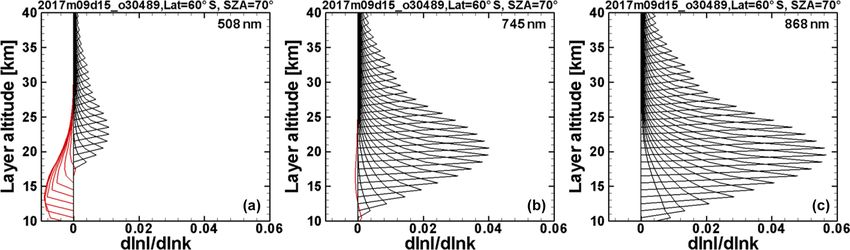
Z. Chen e al.: Evaluation of the OMPS/LP stratospheric aerosol extinction product                                                    3479

Figure 9. LP-retrieved extinction values from the baseline particle
size distribution (solid line) and from the same with the Ångström    Figure 10. Relative differences in the aerosol extinction between LP
exponent (AE) adjusted by ±10 % (dashed line) for an altitude of      and SAGE III/ISS along with the median difference (solid line) as a
30.5 km (a) and 18.5 km (b) as a function of scattering angle (bot-   function of the LP scattering angle for an altitude of 30.5 km in the
tom x axis) and latitude (top x axis) using OMPS/LP measurements      20◦ S–20◦ N (a) latitude bin and an altitude of 18.5 km in 25–50◦ N
for a single orbit on 12 September 2016. While extinction values at   latitude bin (b) during the period from June 2017 to May 2019.
30.5 km with an AE of 2.3 are lower than the baseline, extinction     The differences in aerosol extinction values vary significantly with
values at 18.5 km with an AE of 1.8 are higher than the baseline.     scattering angle between 50 and 100◦ .

bias, the aerosol extinction is first interpolated to 520 nm us-
ing a second-order polynomial in log–log space (extinction
versus wavelength) with extinction values at 448, 756, 869,           latitude-dependent variations in extinction differences with
and 1020 nm. The computed AE is plotted on a color scale              SAGE III/ISS.
with the baseline value of 2.08 used for the OMPS/LP al-
gorithm at its center. Thus, the red colors in Fig. 11a rep-
resent SAGE III/ISS AE values larger than the OMPS/LP                 4.4   Regression analysis
AE value, whereas blue colors represent AE values smaller
than the OMPS/LP value. AE values above the baseline are
possibly associated with the volcanic eruption of Mt. Am-             Figure 12 shows scatter plots of the individual daily zonal
bae below 25 km (note transport from the QBO in the lower             mean extinction values from OMPS/LP and SAGE III/ISS
center of the panels in Fig. 11a) and aerosol evaporation at          for 5◦ latitude bands for 60–30◦ S (Fig. 12a), 30◦ S–30◦ N
higher altitudes, particularly in the tropics (Schuster et al.,       (Fig. 12b), and 30–60◦ N (Fig. 12c). The corresponding com-
2006; Kremser et al., 2016; Rieger et al., 2018; Malinina et          parison statistics are written within the plot. While the over-
al., 2019). The AE values are typically below the baseline            all impression from these results is encouraging, the agree-
through the mid-stratosphere under non-volcanic conditions,           ment changes with latitude. In the tropics and northern mid-
although the smallest values in the upper troposphere are pos-        latitudes (30◦ S–30◦ N and 30–60◦ N, respectively), there is
sibly associated with clouds (and a minor influence from the          good agreement between the results from both instruments,
PyroCb in the lower stratosphere at the northern extent of            with most observations close to the 1 : 1 line and a corre-
the plotted data in late 2017). SAGE III/ISS data suggest that        lation coefficient greater than 0.96. This result gives fur-
the overall AE throughout most of the stratosphere is slightly        ther quantitative evidence that the assumed ASD is appro-
below the baseline value of 2.08 used by the OMPS/LP al-              priate for the OMPS/LP aerosol extinction retrievals in most
gorithm. The similar structure between AE variations shown            of the stratosphere for background aerosol. In the southern
in Fig. 11a and the extinction differences shown in Fig. 11b          midlatitudes, between 60 and 30◦ S, zonal means from LP
suggest that the use of an altitude-dependent ASD in the LP           and SAGE III/ISS are in fair agreement with a correlation
retrieval is a significant component of the observed extinction       coefficient of 0.95, but large systematic differences (SAGE
differences, although other factors may also contribute. Sec-         III/ISS greater than LP) are observed for the aerosol extinc-
tion 4.5 provides further discussion on how the assumed LP            tion, k > 0.0001 m−1 . These positive deviations of up to 25 %
phase function and LP measurement geometry can result in              could be related to wavelength limitations (see Sect. 4.5).

https://doi.org/10.5194/amt-13-3471-2020                                                 Atmos. Meas. Tech., 13, 3471–3485, 2020
3480 Z. Chen e al.: Evaluation of the OMPS/LP stratospheric aerosol extinction product
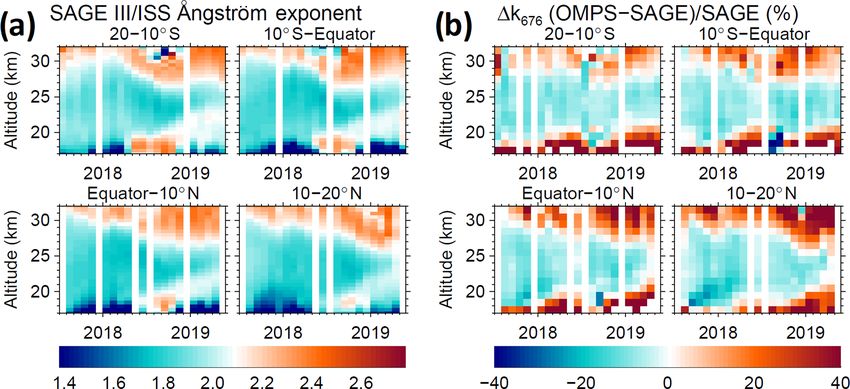
Figure 11. (a) Monthly mean AE and (b) the differences between the SAGE III/ISS and OMPS/LP extinction values at 675 nm (in %) as a
function of altitude and time for four latitude bands in the tropics. The AE is derived from vertically smoothed SAGE III/ISS data using the
aerosol extinction values at 520 nm (interpolated) and 1020 nm (reported) plotted on a color scale with the baseline value of 2.08 used for
the OMPS/LP algorithm at its center.
Figure 12. Scatter plot of the SAGE III/ISS and OMPS/LP daily zonal means of extinction values between 19.5 and 27.5 km for 60–
30◦ S (a), 30◦ S–30◦ N (b), and 30–60◦ N (c) for the entire time period from June 2017 to May 2019, illustrating the correlation between
the two instruments. The red line shows the linear regression between the data points, and the blue line represents a 1 : 1 relationship. The
correlation coefficient r, the standard deviation of the differences (x −y) σ , and the number of elements N used to compute r are also shown.
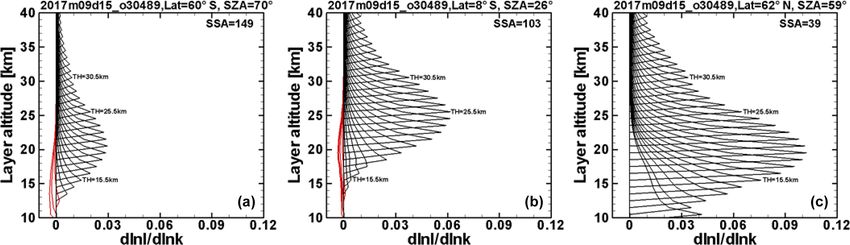
4.5 Wavelength dependence on OMPS/LP aerosol al., 2018). However, as indicated in Sect. 4.1 and 4.4, it is
sensitivity difficult to retrieve reliable aerosol extinction below 20 km
in the SH due to the lack of sensitivity to aerosol. Figure 13
In Figs. 5 and 12, the comparison shows asymmetry between shows an example of aerosol weighting functions at 675 nm
the hemispheres below 20.5 km, with much better agreement for three latitudes. The aerosol weighting function, which de-
in the NH than in the SH, and OMPS/LP extinction val- termines how the calculated radiance (I ) at a given wave-
ues are significantly biased at southern midlatitudes below length changes with a change in aerosol extinction (k), is de-
20 km due to erroneous seasonal variations in the OMPS/LP noted by
dataset. This suggests that the LP measurements are more
∂ ln(I )
sensitive to aerosols in the NH and less sensitive to those in (3)
the SH, especially at lower altitudes. Here, we shall examine ∂ ln(k)
the sensitivity of the LP radiances to aerosol. The derivatives are calculated for all altitudes for a change at
As mentioned before, the LP V1.5 algorithm uses each tangent height, and each curve in the figure shows the
OMPS/LP radiances at a single wavelength of 675 nm to re- sensitivity of the radiance at a given tangent height to extinc-
trieve the extinction profile. This wavelength was selected tion perturbations of a 1 km layer at a range of altitudes. It
primarily to minimize aerosol-related errors in the ozone re- can be seen that the sensitivity to aerosol varies with latitude
trieval and to reduce stray-light contamination (Loughman et and altitude. The LP radiance at 675 nm is most sensitive to
Atmos. Meas. Tech., 13, 3471–3485, 2020 https://doi.org/10.5194/amt-13-3471-2020Z. Chen e al.: Evaluation of the OMPS/LP stratospheric aerosol extinction product 3481
Figure 13. Example of aerosol weighting functions at a wavelength of 675 nm for an altitude of 60◦ S (a), 8◦ S (b), and 62◦ N (c). Each
curve represents the sensitivity of the modeled LP radiance, I , at a given tangent height, TH, altitude, to a typical aerosol extinction, k, at
each 1 km altitude layer from 10 to 40 km. The weighting functions are positive (black line) and peaked at different altitude ranges. At lower
TH altitudes and for larger SA, the 675 nm weighting functions become negative (red line) and lose sensitivity to aerosol extinction at lower
TH altitudes.
the aerosol extinction over the 20–30 km altitude range in the revealed in Fig. 5. This could explain the presence of erro-
tropics and the northern midlatitudes, but it is less sensitive neous seasonal variations in the OMPS/LP dataset.
to aerosol in the southern midlatitudes. Therefore, uncertain- Since the sensitivity to aerosol increases at longer wave-
ties in OMPS/LP aerosol retrievals at 675 nm increase with lengths (Taha et al., 2011), the uncertainties in the south-
reduced sensitivity to aerosol extinction because lower sensi- ern midlatitudes at lower altitudes may be reduced by us-
tivities to aerosol may result in noise amplification. This be- ing longer wavelengths. Figure 14 illustrates the sensitivity
havior is consistent with the results shown in Figs. 5 and 12 of the limb radiances to the aerosol extinction at three wave-
that the LP retrievals are in better agreement with the SAGE lengths for a latitude of 60◦ S (solar zenith angle, SZA, of
III/ISS data in the NH than those in the SH. 70◦ ). The sensitivity to aerosol is seen to increase with in-
In the limb-scattering technique, in contrast, the aerosol creasing wavelength. The increased sensitivity of the limb
signal in the limb radiance at a given tangent height is radiances to aerosol at longer wavelengths is partly due to
roughly proportional to the product of the aerosol extinction the fact that the Mie scattering from aerosol particles does
in that layer and the PF at the tangent point. OMPS/LP is in- not decrease as rapidly with wavelength as the Rayleigh scat-
stalled in a fixed orientation relative to the S-NPP spacecraft. tering from air molecules (Bourassa et al., 2007).
Therefore, southern midlatitudes are observed at backscatter-
ing geometries, whereas NH observations are carried under
forward scattering conditions (see Loughman et al., 2018, 5 Summary and conclusions
Fig. 2). The aerosol scattering phase function is at least 50
times smaller for OMPS limb viewing in the SH than in the To extend our previous validation of the OMPS/LP aerosol
NH. Due to the variation in the PF with latitude and sea- products, OMPS/LP Version 1.5 extinction profiles have
son, the LP observations are most sensitive to aerosols in the been compared against SAGE III/ISS Version 5.1 aerosol
NH winter and least sensitive to those in the SH. LP scat- data over the period from June 2017 to May 2019. For the
tering angles typically vary between 15 and 165◦ . For the comparison, both LP and SAGE III/ISS extinction profiles
selected wavelength of 675 nm and the assumed ASD, the in this paper are in the form of daily averages for a 5◦ lati-
PF has much smaller values at larger scattering angles (see tude bin at each altitude. To evaluate the 675 nm extinction
Chen et al., 2018; blue line in Fig. 2), corresponding to the profiles from OMPS/LP, the original SAGE III/ISS extinc-
larger solar azimuth angles at southern latitudes. This leads tion values at 449 and 756 nm are used to interpolate to the
to a smaller relative contribution of aerosol scattering with extinction profiles at 675 nm, in order to avoid contamina-
respect to Rayleigh scattering. At extremely large scattering tion from potential biases in the SAGE III/ISS “MLR” ozone
angles (> 145◦ ) where Rayleigh scattering is high and the product, and then degraded vertically to the same 1.6 km ver-
value of the aerosol phase function is close to its minimum, tical resolution as OMPS/LP. Using SAGE III/ISS aerosol
the LP radiances at 675 nm are nearly insensitive to aerosol channels away from the Chappuis bands and matching the
at lower altitudes. Therefore, the SA upper limit (of 145◦ ) vertical resolution of the instruments significantly improves
should be used to filter the data. Outside of this SA range, the comparisons.
LP extinction values will tend to bias the retrieved result, as Overall, results show very good agreement for extinction
profiles between 19 and 27 km, to within ±25 %, and show
systematic differences (LP–SAGE III/ISS) above 28 km and
https://doi.org/10.5194/amt-13-3471-2020 Atmos. Meas. Tech., 13, 3471–3485, 20203482 Z. Chen e al.: Evaluation of the OMPS/LP stratospheric aerosol extinction product Figure 14. Example of aerosol weighting functions at 60◦ S for wavelengths of 508 nm (a), 745 nm (b), and 868 nm (c). Each curve represents the sensitivity of the modeled LP radiance, I , at a given tangent altitude, TH, to a typical aerosol extinction, k, at each 1 km altitude layer from 10 to 40 km. The weighting functions are positive (black line) and peaked at different altitude ranges. At lower altitudes, the weighting functions at 508 and 745 nm become negative (red line) and lose sensitivity to aerosol extinction. below 19 km (> ±25 %). The results show that the LP re- assumed ASD. The analysis indicates that the baseline AE is trievals are in better agreement with the SAGE III/ISS data in underestimated (overestimated) above 28 km (below 19 km) the NH than those in the SH, and the agreements change with under background conditions; thus, the assumed ASD pro- time and altitude. Comparisons of time series show that both vides a less accurate representation at altitudes above 28 km instruments detect changes in stratospheric aerosol layer well (below 19 km), tending to overestimate (underestimate) ex- during the entire time period from June 2017 to May 2019. tinction values above (below) this level. Our sensitivity anal- To investigate the impact of volcanic perturbations on the re- ysis shows that the ASD error propagates into extinction un- trievals, the differences in extinction profiles measured by certainty by as much as 13 %. This suggests that a dynamic LP and SAGE III/ISS in the same latitude bin and on the model for ASD is needed to accurately retrieve aerosol ex- same day are analyzed before and after the occurrence of tinction profiles. There are three other possible causes for the Mt. Ambae volcanic eruption and the Canadian PyroCb. the discrepancies. First, most of the remaining discrepancies The results show that both instruments can capture the vol- in the comparison are possibly attributed to the inherent un- canic aerosol and PyroCb well, and their discrepancies are certainties associated with the measurement techniques. In small (< ±10 %), indicating that the LP-retrieved extinction principle, the differences in the measurement techniques af- profiles are reliable under these conditions. In order to bet- fect the instrument sensitivity to aerosols (Malinina et al., ter quantify the difference in the variability observed in the 2019). While SAGE III/ISS uses the solar occultation mea- OMPS/LP and SAGE III/ISS measurements, a total of 9862 suring technique which is self-calibrating and derives extinc- data points between 19.5 and 27.5 km were used to perform tion directly, OMPS/LP employs the limb-scattering tech- a linear regression analysis. The regression results show very nique where retrieved extinction depends on instrument cal- high correlations with a linear correlation coefficient greater ibration and tangent height registration as well as the inver- than 0.95, and most observations lie close to the 1 : 1 line, sion algorithm and its several assumptions, including the as- except for the southern midlatitudes where large positive dif- sumed aerosol microphysics. Uncertainties in these assump- ferences of up to 25 % are observed due to differences in re- tions can also affect the LP extinction product. Second, some trieval techniques and the sensitivity issue. These compar- discrepancies at higher altitudes could be also caused by re- isons are consistent with the previous analysis performed by duced aerosol loading and, hence, reduced retrieval accuracy Chen et al. (2018) that demonstrated a good agreement be- for both instruments. The limb radiance is also more suscep- tween the extinction profiles in the range from 19 to 29 km tible to additive stray-light contamination at high altitudes, and much larger differences above 30 km and below 19 km. where absolute radiance values are smaller. Third, large dif- At altitudes above 28 km (below 19 km), LP extinction val- ferences between LP and SAGE III/ISS at lower altitudes ues were systematically higher (lower) than SAGE III/ISS of as much as 60 % may also be associated with thin cirrus observations. These significant and systematic biases be- clouds, a thick aerosol layer, and air mass transport at various tween LP and SAGE III/ISS are partly due to the fact that locations and levels. the actual ASD is both altitude and time dependent. To eval- Another significant finding in this study is that the com- uate the LP performance of the aerosol retrieval from the as- parison shows asymmetry between the hemispheres below sumed ASD, the averaged Ångström exponent (AE) derived 20.5 km, with better agreement in the NH than in the SH, from SAGE II V7.0 data under background aerosol condi- and erroneous seasonal variations at southern latitudes in the tions was compared with the baseline AE derived from the OMPS/LP dataset with an estimated uncertainty of a factor Atmos. Meas. Tech., 13, 3471–3485, 2020 https://doi.org/10.5194/amt-13-3471-2020
Z. Chen e al.: Evaluation of the OMPS/LP stratospheric aerosol extinction product                                                    3483

of up to 2. The reason for this is identified as the fact that          Goddard Earth Sciences Data and Information Services Center
the LP radiances at 675 nm are nearly insensitive to aerosol            (GES DISC), https://doi.org/10.5067/GZJJYA7L0YW2, 2019.
at extremely large scattering angles. This problem can be             Bingen, C., Robert, C. E., Stebel, K., Brühl, C., Schallock, J., Van-
solved by using longer wavelengths to retrieve aerosol ex-              hellemont, F., Mateshvili, N., Höpfner, M., Trickl, T., Barnes,
tinction. In the meantime, we recommend filtering LP data               J. E., Jumelet, J., Vernier, J.-P., Popp, T., de Leeuw, G., and
                                                                        Pinnock, S.: Stratospheric aerosol data records for the climate
below 20 km with an SA greater than 145◦ . When the SA
                                                                        change initiative: Development, validation and application to
exceeds this limit, the LP algorithm starts to give obviously           chemistry-climate modelling, Remote Sens. Environ., 203, 296–
incorrect results.                                                      321, https://doi.org/10.1016/j.rse.2017.06.002, 2017.
                                                                      Bourassa, A. E., Degenstein, D. A., Gattinger, R. L., and
                                                                        Llewellyn, E. J.: Stratospheric aerosol retrieval with op-
Data availability. OMPS/LP Version 1.5 aerosol profiles are             tical spectrograph and infrared imaging system limb
freely available to the international research community at             scatter measurements, J. Geophys. Res., 112, D10217,
https://doi.org/10.5067/GZJJYA7L0YW2 (Bhartia and Torres,               https://doi.org/10.1029/2006JD008079, 2007.
2019).                                                                Bourassa, A. E., Rieger, L. A., Lloyd, N. D., and Degenstein,
                                                                        D. A.: Odin-OSIRIS stratospheric aerosol data product and
                                                                        SAGE III intercomparison, Atmos. Chem. Phys., 12, 605–614,
Author contributions. ZC performed the analyses and prepared the        https://doi.org/10.5194/acp-12-605-2012, 2012.
article with significant contributions from all co-authors. PKB led   Brühl, C., Schallock, J., Klingmüller, K., Robert, C., Bingen, C.,
the development of the algorithms for the OMPS/LP Level 2 prod-         Clarisse, L., Heckel, A., North, P., and Rieger, L.: Stratospheric
ucts and provided scientific guidance on the paper. OT and MD pro-      aerosol radiative forcing simulated by the chemistry climate
vided suggestions and edited the paper. GJ, RL, and GT provided         model EMAC using Aerosol CCI satellite data, Atmos. Chem.
expert advice on the OMPS/LP aerosol observation. PC provided           Phys., 18, 12845–12857, https://doi.org/10.5194/acp-18-12845-
the CARMA model output. RD produced Fig. 11 and participated            2018, 2018.
in scientific discussions.                                            Chahine, M.: Inverse problems in radiative transfer: A determina-
                                                                        tion of atmospheric parameters, J. Atmos. Sci., 27, 960–967,
                                                                        1970.
Competing interests. The authors declare that they have no conflict   Chen, Z., DeLand, M., and Bhartia, P. K.: A new algorithm for
of interest.                                                            detecting cloud height using OMPS/LP measurements, Atmos.
                                                                        Meas. Tech., 9, 1239–1246, https://doi.org/10.5194/amt-9-1239-
                                                                        2016, 2016.
Acknowledgements. We thank the OMPS/LP team at NASA God-              Chen, Z., Bhartia, P. K., Loughman, R., Colarco, P., and De-
dard and Science Systems and Applications, Inc. (SSAI) for              Land, M.: Improvement of stratospheric aerosol extinction re-
help with producing the data used in this study. We also thank          trieval from OMPS/LP using a new aerosol model, Atmos.
Larry Thomason at the NASA Langley Research Center for his in-          Meas. Tech., 11, 6495–6509, https://doi.org/10.5194/amt-11-
sights into the stratospheric aerosol problem and Philippe Xu and       6495-2018, 2018.
Tong Zhu for their technical support. SAGE III/ISS is a mission       Chu, W. and Veiga, R.: SAGE III/EOS, Proc. SPIE 3501, Op-
led by NASA Langley and funded by the NASA Science Mission              tical Remote Sensing of the Atmosphere and Clouds, 52–60,
Directorate within the Earth Systematic Missions Program. The en-       https://doi.org/10.1117/12.577943, 1998.
abling partners are the NASA Human Exploration and Operations         Colarco, P. R., Nowottnick, E. P., Randles, C. A., Yi, B.,
Mission Directorate, the International Space Station Program, and       Yang, P., Kim, K.-M., Smith, J. A., and Bardeen, C. G.:
the European Space Agency. Finally, we thank the editor and the         Impact of radiatively interactive dust aerosols in the NASA
reviewers for their helpful comments that improved this paper.          GEOS-5 climate model: Sensitivity to dust particle shape
                                                                        and refractive index, J. Geophys. Res.-Atmos., 119, 753–786,
                                                                        https://doi.org/10.1002/2013JD020046, 2014.
                                                                      Damadeo, R. P., Zawodny, J. M., Thomason, L. W., and Iyer, N.:
Financial support. Funding for this work was provided in part by
                                                                        SAGE version 7.0 algorithm: application to SAGE II, Atmos.
NASA through the OMPS/LP science team program.
                                                                        Meas. Tech., 6, 3539–3561, https://doi.org/10.5194/amt-6-3539-
                                                                        2013, 2013.
                                                                      Deshler, T. R., Sprecher, A., Jäger, H., Barnes, J., D. J.
Review statement. This paper was edited by Christian von Savigny        Hofmann, D. J., Clemesha, B., Simonich, Osborn, D.
and reviewed by three anonymous referees.                               M., Grainger, R. G., and Beekmann, S. G.: Trends in
                                                                        the non volcanic component of stratospheric aerosol over
                                                                        the period 1971–2004, J. Geophys. Res., 111, D01201,
                                                                        https://doi.org/10.1029/2005JD006089, 2006.
                                                                      English, J. M., Toon, O. B., Mills, M. J., and Yu, F.: Microphysical
References                                                              simulations of new particle formation in the upper troposphere
                                                                        and lower stratosphere, Atmos. Chem. Phys., 11, 9303–9322,
Bhartia, P. K. and Torres, O. O.: OMPS-NPP L2 LP Aerosol Extinc-        https://doi.org/10.5194/acp-11-9303-2011, 2011.
  tion Vertical Profile swath daily 3slit V1.5, Greenbelt, MD, USA,

https://doi.org/10.5194/amt-13-3471-2020                                                 Atmos. Meas. Tech., 13, 3471–3485, 2020
You can also read