EVERI HOLDINGS INC. INVESTOR PRESENTATION - Results of operations for the period ended December 31, 2018

Page created by Brian Chen
 
CONTINUE READING
EVERI HOLDINGS INC. INVESTOR PRESENTATION - Results of operations for the period ended December 31, 2018
EVERI HOLDINGS INC.
INVESTOR PRESENTATION
           Results of operations for the
       period ended December 31, 2018
EVERI HOLDINGS INC. INVESTOR PRESENTATION - Results of operations for the period ended December 31, 2018
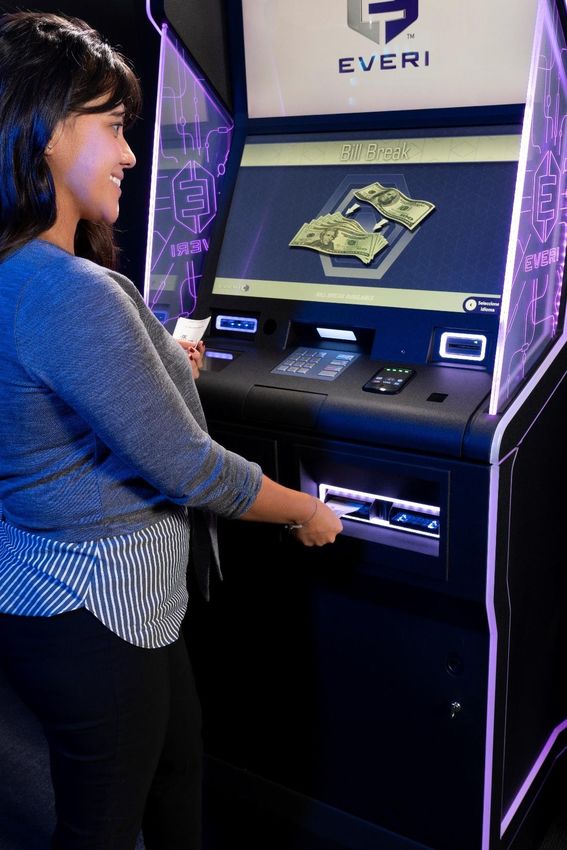
SAFE HARBOR DISCLAIMER
Forward-Looking Statements

This presentation contains “forward-looking” statements within the meaning of Section 27A of the Securities Act of 1933, as amended (the “Securities Act”),
Section 21E of the Securities Exchange Act of 1934, as amended (the “Exchange Act”), and the Private Securities Litigation Reform Act of 1995. From time to time,
we also provide forward-looking statements in other materials we release to the public, as well as oral forward-looking statements. We have tried, wherever
possible, to identify such statements by using words such as “anticipate,” “believe,” “expect,” “intend,” “estimate,” “project,” “may,” “should,” “will,” “likely,” “will
likely result,” “will continue,” “future,” “plan,” “target,” “forecast,” “goal,” “observe,” “seek,” “strategy” and other words and terms of similar meaning.

Forward-looking statements are neither historical facts nor assurances of future performance. Instead, they are based only on our current beliefs, expectations
and assumptions regarding the future of our business, future plans and strategies, projections, anticipated events and trends, the economy and other future
conditions. Because forward-looking statements relate to the future, they are subject to inherent risks, uncertainties and changes in circumstances that are often
difficult to predict and many of which are beyond our control. Our actual results and financial condition may differ materially from those indicated in forward-
looking statements. Important factors that could cause our actual results and financial condition to differ materially from those indicated in the forward-looking
statements include, without limitation, our history of net losses and our ability to generate profits in the future; our substantial leverage and the related
covenants that restrict our operations; our ability to generate sufficient cash to service all of our indebtedness and fund working capital and capital expenditures
and placement fees; our ability to compete in the gaming industry; our ability to maintain our current customers; our ability to execute on mergers, acquisitions
and/or strategic alliances, including our ability to integrate and operate such acquisitions consistent with our forecasts; expectations regarding our existing and
future installed base and win per day; expectations regarding development and placement fee arrangements; inaccuracies in underlying operating assumptions;
expectations regarding customers’ preferences and demands for future gaming offerings; expectations regarding our product portfolio; the overall growth of the
gaming industry, if any; our ability to replace revenue associated with terminated contracts; margin degradation from contract renewals; our ability to comply
with the Europay, MasterCard and Visa global standard for cards equipped with security chip technology; our ability to introduce new products and services,
including third-party licensed content; gaming establishment and patron preferences; the level of our capital expenditures and product development; anticipated
sales performance; employee turnover; national and international economic conditions; changes in gaming regulatory, card association and statutory
requirements; regulatory and licensing difficulties that we may face; competitive pressures in the gaming and financial technology sectors; the impact of changes
to tax laws; uncertainty of litigation outcomes; interest rate fluctuations; unanticipated expenses or capital needs and those other risks and uncertainties
discussed in our most recent Annual Report on Form 10-K filed with the U.S. Securities and Exchange Commission. In light of these risks and uncertainties, there
can be no assurance that the forward-looking information contained in this presentation will in fact transpire or prove to be accurate. Readers are cautioned to
not to place undue reliance on the forward-looking statements contained herein, which are based only on information currently available to us and speak only
as of the date hereof.

                                                                                                                                                                            2
EVERI HOLDINGS INC. INVESTOR PRESENTATION - Results of operations for the period ended December 31, 2018
EVERI: A BUSINESS FOCUSED ON THE FUN!

▪ Everi is a diverse gaming supplier operating in two core business segments:
   » Everi Games (“Games”) is a leading designer and supplier of electronic gaming machines, gaming
     systems and other products and services for the casino and gaming industry

   » Everi Payments (“FinTech”) provides crucial Financial Technology products and services that allow gaming
     operators to drive the maximum cash and revenue to their casino floors, while enabling their ability to
     create operating efficiencies and deepen their patron relationships

▪ FY 2018 Revenues of $470M and Adjusted EBITDA of $230M

                                                                                                                3
EVERI HOLDINGS INC. INVESTOR PRESENTATION - Results of operations for the period ended December 31, 2018
TECHNOLOGY POWERING THE CASINO FLOOR -
GAMES DIVISION OVERVIEW

Everi Games operates primarily in North American gaming markets and provides
state-of-the-art, value-add products and services with revenues derived from the
following business lines:
▪ Gaming Operations: lessor of gaming machines to tribal and commercial casino operators and
  operator of the central determinant system for the video lottery terminals (“VLTs”) installed in
  the State of New York

    » Interactive: operator of online B2B and B2C social casino and B2B real-money gaming

▪ Game Sales: vendor of gaming machines to tribal and commercial casino operators

▪ Other: TournEvent of Champions, the gaming industry’s largest annual slot tournament
  providing a $1M cash prize, which includes the regional qualifying events held at customer
  facilities

FY 2018 Revenues of $259M and Adjusted EBITDA of $127M

        Everi Games serves a broad base of casino operators across numerous jurisdictions
                     in the United States, Canada and international markets

                                                                                                     4
EVERI HOLDINGS INC. INVESTOR PRESENTATION - Results of operations for the period ended December 31, 2018
TECHNOLOGY POWERING THE CASINO FLOOR -
FINTECH DIVISION OVERVIEW

Everi FinTech operates primarily in North America with operations in gaming
markets in Asia, Europe and South America. FinTech is the largest and most
comprehensive provider of financial technologies and solutions to the gaming
industry with revenues derived from the following business lines:
▪ Cash Access: products provide gaming patrons access to cash in gaming establishments.
  Products drive greater cash to the gaming floor through frictionless transactions

▪ Compliance, Credit Information & Services: provides software and other information tools to
  enable operators to make informed business decisions while meeting regulatory compliance
  requirements. Products also create operating efficiencies for casino operators

▪ Kiosks & Other Equipment: provides casino operators proprietary, cutting-edge terminals
  designed to support cash access to patrons and deliver operating efficiencies

FY 2018 Revenues of $211M and Adjusted EBITDA of $104M

    Casino operators trust FinTech’s industry-leading IT, security and software systems to deliver
      solutions directly integrated into their core processes in a secure and safe environment

                                                                                                     5
EVERI HOLDINGS INC. INVESTOR PRESENTATION - Results of operations for the period ended December 31, 2018
BROAD NORTH AMERICAN PRESENCE
▪ Power casino floors with
  ~36,500 gaming units in
  37 states and 9 provinces
                                         BRITISH
                                        COLUMBIA
                                                                 ALBERTA

                                                                                                             MANITOBA

                                                                                   SASKATCHEWAN                                                                                                                       PRINCE

▪ Connected to 842 casinos
                                                                                                                                                                                                                      EDWARD
                                                                                                                                                                                   QUEBEC                             ISLAND

  throughout North America
                                                                                                                                       ONTARIO                                                           NEW
                                                                                                                                                                                                       BRUSWICK

                                       WASHINGTON                                                                                                                                                                      NOVA
                                                                                                                                                                                                                       SCOTIA

                                                                      MONTANA                     NORTH
                                                                                                                                                                                               MAINE
                                                                                                  DAKOTA          MINNESOTA

                                    OREGON                                                                                                                                                             NEW HAMPSHIRE

▪ Processing over 108M                                 IDAHO                                       SOUTH
                                                                                                  DAKOTA
                                                                                                                                 WISCONSIN

                                                                                                                                                                                   NEW YORK
                                                                                                                                                                                                       VERMONT

                                                                                                                                                                                                       MASSACHUSSETS

  financial transactions                                                   WYOMING                                                                   MICHIGAN
                                                                                                                                                                                                       RHODE ISLAND

                                                                                                                        IOWA

  annually for over $28B in
                                                                                                  NEBRASKA                                                                PENNSYLVANNIA                CONNECTICUT

                                              NEVADA                                                                                                         OHIO
                                                                                                                                                                                                       NEW JERSEY
                                                           UTAH                                                                      ILLINOIS     INDIANA

  dollars to the floor
                                                                               COLORADO                                                                               WEST                             DELEWARE
                                                                                                                                                                    VIRGINIA
                                                                                                     KANSAS                                                                     VIRGINIA
                                 CALIFORNIA
                                                                                                                        MISSOURI                                                                       MARYLAND
                                                                                                                                                      KENTUCKY
                                                                                                                                                                                NORTH
                                                                                                                                                                               CAROLINA
                                                                                                                                                  TENNESSE
                                                       ARIZONA
                                                                                                       OKALAHOMA                                                        SOUTH
                                                                           NEW MEXICO                                   ARKANSAS                                       CAROLINA

▪ Team of over 1,200 dedicated                                                                                                                     ALABAMA
                                                                                                                                                             GEORGIA                   UNITS IN INSTALLED BASED:

                                                                                                                                                                                     ■ 1,000+
  employees
                                                                                                                                    MISSISSIPPI

                                                                                                                                                                                     ■ 500-999
                                                                                                    TEXAS

                                                                                                                               LOUISIANA

                                                                                                                                                                                     ■
EVERI HOLDINGS INC. INVESTOR PRESENTATION - Results of operations for the period ended December 31, 2018
18,500
                  13,999                         20%                          NY Lottery
                                                                                 Units
                                              Premium % of
                  Installed Base              Installed Base                  Managed by
                                                                                Central
                                                                               System

                                   4,513                         425
EVERI HAS SCALE                    LTM Game
                                                            Casino-owned
                                                            TournEvent®
                                     Sales
                                                               Systems

                  $28B+                       12,000+                         10M+
                                                 Total                         Patrons
                  Annual Cash                  Network                          Served
                  to the Floor                Touchpoints                      Annually

                                     842                    108M+
                                                                   LTM
                                    Casinos on
                                                               Transactions
                                   our Network
                                                                Processed

                                                                                      7
EVERI HOLDINGS INC. INVESTOR PRESENTATION - Results of operations for the period ended December 31, 2018
GAMES DIVISION

                 8
EVERI HOLDINGS INC. INVESTOR PRESENTATION - Results of operations for the period ended December 31, 2018
GAMES: STRONG PRODUCT PORTFOLIO
DRIVES GROWTH
Expansive and complete product portfolio provides opportunities for expansion into
new markets and categories
                Cabinets                                   Banked Products

  Video        Mechanical            Premium    Banked               Premium Banked

                Add-Ons                                       Systems
   Top Boxes                Signs and Toppers                TournEvent

                                                                                      9
EVERI HOLDINGS INC. INVESTOR PRESENTATION - Results of operations for the period ended December 31, 2018
TOURNEVENT®
Everi’s Award-Winning Slot
Tournament System

▪ Launched in 2012 and still the
  leading tournament system

▪ 425+ casinos
   » More than 5,000 active units

▪ Now in 8 of 9 Canadian
  gaming provinces

                                    10
POST MERGER INVESTMENTS IN
PRODUCT IMPROVED CORE OFFERING…
Since the December 2014 MGAM acquisition, Everi Games has made significant
investments in R&D to enhance and modernize its core products
      Base Video                  Classic Mechanical            Premium Cabinets

       Legacy                          Legacy                        Legacy

       Current                         Current                      Current

                                                                                   11
…WHILE EXPANDING INTO NEW
    PRODUCT CATEGORIES…
    Along with improvements in hardware products, Everi Games now offers a more
    expansive suite of products to its customers to increase its addressable markets
    Local and Wide-Area Progressive             ▪   Premium Licensed Games                   ▪   Interactive Gaming

 » LAP introduced in 2016 and WAP          » Premium Licensed Games introduced in   » B2B social casino and real-money
   introduced in 2017                        2017                                     gaming and B2C social casino

 » WAP is the fastest growing segment of   » 20+ third party licenses   (1)              -   B2C business launched in 2017
   the premium game installed base with
                                                                                    » More than 35 premium online slot
   604 units (1)
                                                                                      games combined in both distribution
                                                                                      channels

(1) As of December 31, 2018
                                                                                                                             12
…TRANSLATING INTO MEANINGFUL GROWTH

             GAME OPS PROPRIETARY UNITS                                                                            UNIT SALES
                IN INSTALLED BASE(1)                                                   4,500
    15,000
                                                                                                                                 4,262
                                                                                       4,000
    14,000
                                                                                       3,500                             3,647

                                                                  13,498
    13,000                                                                             3,000
                                                                                                             2,954
                                              12,533
    12,000                                                                             2,500
                           11,931
                                                                                       2,000
    11,000
                                                                                        1,500
    10,000
                                                                                        1,000
      9,000
                                                                                           500

      8,000                                                                                    0
                          2016                2017                2018                                      2016         2017    2018
(1) Proprietary units excludes 3rd Party Class III of 1,333 units in 2016, 763 units in 2017, and 609 units in 2018.
                                                                                                                                         13
HOW DO WE MAINTAIN THE GROWTH?

  ANNUAL GAME THEMES                                          NEW PRODUCTS/MARKETS

           10                      15                             Interactive
                                                                                            Route/
           Premium                 Standard                                                  VLT
          Mechanical              Mechanical

 15                     30                        1                         International
Premium                Standard                TournEvent®
 Video                   Video                   Games

          NEW HARDWARE                                       EXPAND ON RECENT SUCCESS

                       1-2                                      Premium              Improved
                 New Gaming                                                           DWPU
                                                                 Leased               (Invest in
                   Cabinet                                      (WAP/LAP)
                 Form Factors                                                          Games)

                                                                                                     14
EVERI INTERACTIVE

Everi’s interactive gaming content delivered through two separate revenue
generating channels:

▪ B2C: Online social gaming directly leveraging Everi content in a direct-to-consumer model

         Super Jackpot Slots (SJS)                      High Rollin’ Vegas Slots (HRV)
▪ Provides brand exposure for Everi game themes   ▪ Leverages SJS infrastructure, but focused on classic
                                                    stepper slot content
▪ Full suite of top-performing Everi games
                                                  ▪ Exploits Everi’s land-based slots strength and depth
▪ 45+ slot titles in operation
                                                  ▪ 36+ slot titles in operation

▪ B2B: Delivery of Everi gaming content to third-party, real money gaming (“RMG”) and social
  gaming operators. These operators as well as other content aggregators may combine Everi
  content with other gaming supplier content and their own for direct delivery to consumers.

                                                                                                           15
FINTECH DIVISION

                   16
WHY ARE WE
   GAMING’S
   FINTECH LEADER?
▪ We generate more cash to the floor
  from fully integrated products and
  innovative functionality

▪ We deliver convenience, efficiency,
  and innovation to gaming operators
  and their patrons

▪ We provide applications and tools
  that allow operators to maintain the
  highest levels of compliance

▪ We operate a secure, trusted and
  proven network
                                         17
FINTECH: INDUSTRY-LEADING PROVIDER

      A comprehensive interconnected, suite of financial technology services and solutions
      integrated into casinos’ core operations
                            Cash Access                                      Compliance, Credit Information & Services
       ATMs                Cash Advance        Check Services
                                                                     Suite of software offerings equipping
 Facilitates ATM         Facilitates cash    Provides
                                                                      casinos with reporting and compliance
  cash withdrawals         advances              warranty service
                                                                      tools
                           through credit        on casino check
 Other non-
                           or debit card         acceptance and      Central Credit - credit bureau with tools
  financial
                           transactions          facilitates          enabling operators to make informed
  transactions such
                                                 patron self-         decisions on issuance of gaming credit
  as balance inquiry
                                                 service check
  and transfers                                                      Kiosk and equipment maintenance and
                                                 cashing
                                                                      support under recurring annual                          Quik Marketing
                                                                      agreements

                    Kiosks and Other Equipment                                            Comprehensive Solutions

                                                                          Gaming Operators                                Patrons
                                                                     Customer Identification                  Card Transactions
 Kiosk machines that
                                                                     Credit Check                             Balance Inquiry / Transfer
  enable streamlined
  cash handling and                                                  Cash Facilitation                        Redeem Winnings
  transaction                                                        Tax Form Generation                      Check Cashing
  processing                                                         AML Management                           Break Bills
 Self-service                                                       Cash Handling                            Request Gaming Credit
  solutions                                                          Credit Management                        Currency Conversion
                                                                     Compliance Tools                         Digital Wallet
                           CageXchange        RecyclerXchange
                                                                     Target Marketing                         Loyalty Programs

                                                                                                                                               18
TRANSACTION GROWTH

Growth from new customer wins, new property openings and the entrance into new markets combined with new
product extensions like QuikTicket the addition of new transaction types like American Express and dynamic
currency conversion have delivered meaningful growth in the core business base

                       TRANSACTION COUNT                                         TRANSACTION DOLLARS
               140.0                                                                  PROCESSED
                                                                         $35.0
               120.0
                                                 107.6
                                                                         $30.0                               $27.9
                                       99.6       3.7
               100.0                    3.6       10.9                                            $25.3       $1.3
                             87.4                                        $25.0
                                        9.8                                                        $1.2
                             3.6                                                       $21.6                  $6.9
 In millions

                                                         $ in millions
               80.0          8.8                                                       $1.1        $6.2
                                                                         $20.0
                                                                                       $5.3
               60.0
                                                                         $15.0
                                                  93.0
               40.0                    86.2
                             75.0                                        $10.0                               $19.7
                                                                                                  $17.9
                                                                                       $15.2
               20.0                                                       $5.0

                 0.0                                                      $0.0
                             2016      2017      2018                                  2016       2017        2018

                       ATM     Credit/Debit   Check                              ATM      Credit/Debit    Check

                                                                                                                     19
ONGOING FINTECH
INNOVATION

▪ Innovation drives Everi’s
  ability to adapt to market
  demands

▪ Innovation allows Everi to
  address international market
  opportunities

▪ Key areas of focus:
   » New core transaction types
   » New core product extensions

                                   20
PLAYER LOYALTY & MARKETING

▪ Acquired Atrient products and platforms focused on
  self-service player loyalty, enrollment and
  marketing/promotions

▪ Integration of Atrient products expands our interaction
  with gaming patrons and increases customer footprint,
  while deepening relationships with key customers

▪ Additional loyalty and marketing products supplement
  and expand current Everi FinTech solution offering
   » Integration with Cash Club Wallet allows for combination of
     mobile payments with a promotion engine
   » Opportunity to enhance existing touch points (i.e. fully
     integrated kiosks) to utilize newly acquired functionality

                                                                   21
BEST POSITIONED FOR A DIGITAL FUTURE

▪ Digital is integrated into our core
  foundation through our
  unparalled network
    » Core financial services
    » Regulatory Compliance
    » Patron touch points
    » Gaming systems connections
    » Settlement/Dispute resolution
    » Money Transmitter Licenses

▪ Purposefully built to aggregate
  omnichannel patron interactions to
  provide 360⁰ view

▪ Drive convergence of patron
  experience, engagement, and
  loyalty
                                        22
DIGITAL WALLET: INTERCONNECTING THE
GAMING ECOSYSTEM
                                                                                           ATM
                                                                            Table Games
▪ Integrated with major casino systems                                                                 Kiosk

                                                                Slots
    » Gaming: Slot, Table, Sportsbook, Interactive,
      Social
                                                                                                               CashClub®

    » Retail: F&B, Hotel, Retail
    » Loyalty Programs
                                                Restaurant

▪ Provides enhanced guest                                                          Everi
  experiences                                                                     Mobile
                                                                                  Wallet                              Mobile Gaming

    » When they want, how they want,          Hotel
      where they want
    » Provides increased visibility into
      guest activity and preferences
                                                Gift Shop

▪ Delivers operational efficiencies                                                                            Online Gaming
  leading to lower operational costs
                                                             Hotel

▪ Creates additional funding                                Amenities

  opportunities to the gaming                                           Tickets
  floor through faster transactions
                                                                                             Sports Wagering

▪ Potential for new transaction types to drive
  increased revenue

                                                                                                                               23
FINANCIAL

            24
HISTORICAL FINANCIALS - REVENUE

                                                                     Consolidated Revenue(1)

                               $490

                               $470
                                                                                                                                                           $470
                               $450
                 In millions

                               $430

                               $410
                                                                                                         $411
                               $390

                                                       $383
                               $370

                               $350
                                                        2016                                              2017                                              2018

NOTE:
1. To improve comparability to current reported revenues, consolidated revenues for all reporting periods prior to 2018 are presented on an “as adjusted” basis. This
   presentation reflects certain reclassifications that would have been required had the accounting provisions of ASC 606 been retrospectively applied to reporting periods
   before January 1, 2018.                                                                                                                                                    25
2019 OUTLOOK

             ▪ The Company expects to generate growth in revenue and in Adjusted EBITDA(1) in
               2018, with Adjusted EBITDA(1) of approximately $252 million to $255 million
                     » Games segment
                            - An increase in Gaming unit sales from the 4,513 units sold in 2018;
                            - Growth in gaming operations driven by growth in both the DWPU and an increase in the number of
                              units in the year-end installed base;
                                    o Increasing Interactive revenue;

                     » FinTech segment
                            - Higher cash access service revenue;
                            - An increase in sales of fully integrated kiosks and other FinTech equipment; and,
                            - Information services and other revenue increases primarily driven by growth in maintenance revenue
                              from equipment, higher compliance revenue, and the initial contributions related to the player loyalty
                              & marketing acquisition in 1Q 2019.

             ▪ Excluding the impact of the Q1 player loyalty & marketing acquisition, capital
               expenditures and placement fees in 2019 are expected to be approximately $118
               million to $122 million. Total placement fee payments in 2019 are expected to be
               approximately $17 million
NOTE:
The Company provided its initial 2019 Outlook in its earnings release dated March 12, 2019. The Company’s practice is to provide its outlook, and any applicable updates,
in connection with its quarterly earnings releases.

1. Adjusted EBITDA is a non-GAAP measure. Reconciliations to the most directly comparable GAAP measure for historical periods can be found in applicable earnings
   releases located on Everi’s website at ir.everi.com, and in the appendix to this presentation.                                                                           26
HISTORICAL & TARGET – ADJ EBITDA

                                                                    Consolidated AEBITDA(1)

                               $255
                                                                                                                                                              $253
                               $245

                               $235
               $ in millions

                               $225                                                                                      $230

                               $215
                                                                                    $213
                               $205

                               $195            $198

                               $185
                                               2016                                  2017                                 2018                                 2019 (2)

NOTES:
1. Adjusted EBITDA is a non-GAAP measure. Reconciliations to the most directly comparable GAAP measure for historical periods can be found in applicable earnings
   releases located on Everi’s website at ir.everi.com, and in the appendix to this presentation.
2. Adjusted EBITDA used in 2019 calculation is estimated at $253.5 million, or the midpoint of the Company’s updated outlook as of March 12, 2019 in connection with its   27
   4Q18 earnings release.
HISTORICAL FREE CASH FLOW
                                                                                                                                                (1)

                                $30.0

                                $25.0
                                                                                                                                                       $24.8

                                $20.0
                $ in millions

                                $15.0

                                                                                                       $13.8
                                $10.0                  $11.1

                                 $5.0

                                 $0.0
                                                       2016                                             2017                                             2018

NOTE:
1. Free Cash Flow (FCF) is a metric used by the Company to estimate the amount of cash generated from the recurring business operations. This is a non-GAAP measure.
   FCF is computed as Adjusted EBITDA less the sum of cash interest expense, cash paid for capital expenditures and placement fees, and cash taxes. A reconciliation of
   FCF to the most directly comparable GAAP measure for historical periods can be found in the appendix to this presentation.
                                                                                                                                                                          28
CURRENT CAPITAL STRUCTURE
            $ in millions                                                                                                                                                            BALANCE
                                                                                         MATURITY DATE                                 INTEREST RATE                             DECEMBER 31, 2018
           Revolving Credit Facility ($35 million)                                            May 2022                             L+450 (@ 12/31/18)                                                -

           First Lien Term Loan                                                               May 2024                       L+300 (5.52% @ 12/31/18)                              $            807.7

           Senior Secured Debt                                                                                                                                                     $            807.7

           Senior Unsecured Notes                                                         December 2025                              7.50% Fixed Rate                              $            375.0

                 Total Debt                                                           Weighted Avg Rate                            6.15% (@ 12/31/18)                              $           1,182.7

           Cash and cash equivalents                                                                                                                                               $            297.5

           Settlement Receivables                                                                                                                                                                82.4

           Settlement Liabilities                                                                                                                                                              (334.2)

           Net Cash Position                                                                                                                                                       $             45.7

           Equity Market Capitalization (3/13/19) (1)                                                                                                                              $            624.0

           Total Net Enterprise Value (2)                                                                                                                                          $           1,761.0

           FY 2018 Adjusted EBITDA (3)                                                                                                                                             $            230.4

           Consolidated Secured Leverage Ratio (4)                                                                                                                                               3.3x

           Consolidated Total Leverage Ratio (4)                                                                                                                                                 4.9x

NOTES:
1. Equity Market Capitalization computed as 70.2 million shares outstanding at December 31, 2018, multiplied by the $8.89 closing price of the common shares of EVRI on March 13, 2019.
2. Total Net Enterprise Value computed as the sum of total debt plus equity market capitalization less net cash position.
3. Adjusted EBITDA is a non-GAAP measure. Reconciliation to the most directly comparable GAAP measure for historical periods can be found in applicable earnings releases located on Everi’s
    website at ir.everi.com, and in the appendix to this presentation.
4. As provided in the Credit Facility for purposes of the calculation of the Consolidated Secured Leverage ratio and the Consolidated Total Leverage ratio, the Company nets cash and cash
    equivalents of up to $50 million against the respective debt outstanding to determine the appropriate Leverage Ratio.                                                                                29
IMPROVING CREDIT PROFILE
                                                                             Pre-May 2017 Refinancing                               December 31, 2018
                                                                                                                                                                                         Change
                                                                                   (LTM 1Q17)                                           (FYE 2018)

              Market Capitalization(1)                                                   $316.6 million                                  $626.0 million                         ↑             $309.4M

              LTM Revenue(2)                                                             $396.3 million                                  $469.5 million                         ↑       $73.2M (18.5%)

              LTM AEBITDA(3)                                                             $206.5 million                                  $230.4 million                         ↑       $23.9M (11.6%)

              Installed Base of Gaming Units                                                  13,022                                           13,999                           ↑                977

              FinTech Transactions Processed                                              89.7 million                                    107.6 million                         ↑               17.9M

              FinTech Dollar Volume                                                       $22.4 billion                                   $27.9 billion                         ↑               $5.5B

              Secured Leverage(4)                                                               3.6x                                             3.3x                           ↓                0.3x

              Consolidated Leverage(4)                                                          5.3x                                             4.9x                           ↓                0.4x

              Net Leverage(4)                                                                   4.9x                                             3.8x                           ↓                1.1x

              Term Loan Pricing(5)                                                            L +525                                          L + 300                           ↓             225 bps

              Unsecured Note Yield                                                             10.0%                                            7.5%                            ↓             250 bps

              Interest Coverage - Debt                                                          2.3x                                             3.0x                           ↑                0.7x

NOTES:
1. Equity Market Capitalization computed as 66.1 million and 70.2 million shares outstanding at March 31, 2017 and December 31, 2018, respectively multiplied by the $4.79 and $8.89 closing price
   of the common shares of EVRI on March 31, 2017 and March 13, 2019., respectively.
2. Revenues all periods prior to 2018 are presented on a comparable basis to retrospectively reflect a net versus gross reporting of revenues under ASC 606, which primarily impacts the Company’s
   Financial Technology Solutions business.
3. Adjusted EBITDA is a non-GAAP measure. Reconciliations to the most directly comparable GAAP measure for historical periods can be found in applicable earnings releases located on Everi’s
   website at ir.everi.com, and in the appendix to this presentation.
4. Cash netting for calculation of Consolidated Secured & Consolidated Total Leverage capped at $50 million as defined in the credit agreement. Net Leverage assumes no cap on the cash balances
   reducing net debt balance.                                                                                                                                                                            30
5. The one-month USD LIBOR has increased appx 150 bps over this time period from 0.983% on March 29, 2017 to 2.489% on March 13, 2019.
CONSOLIDATED TOTAL LEVERAGE
               2016 – 2018 ACTUAL & 2019 TARGET
             6.0x

                                             5.6x
             5.0x                                                                         5.4x
                                                                                                                                       4.9x

             4.0x                                                                                                                                                                   4.4x

             3.0x

             2.0x

              1.0x

             0.0x
                                                                                                                                                                                              (1)(2)
                                             2016                                         2017                                         2018                                       2019E

NOTES:
Computation based upon net debt, which assumes up to $50 million in net cash available to reduce consolidated debt outstanding
1.  Adjusted EBITDA used in 2019 calculation is estimated at $253.5 million, or the midpoint of the Company’s updated outlook as of March 12, 2019 in connection with its 4Q18 earnings release.
2.  Assumes the estimated $9 million of additional pay down of debt in 2019 from required prepayment of Excess Cash for 2018 per the Term Loan Agreement.
                                                                                                                                                                                                       31
APPENDIX

           32
NON-GAAP FINANCIAL MEASURES
In order to enhance investor understanding of the underlying trends in our business and to provide for better comparability between periods in different years, we are
providing in this presentation Adjusted EBITDA and Free Cash Flow (“FCF”) which are not measures of our financial performance or position under United States Generally
Accepted Accounting Principles (“GAAP”). Accordingly, these measures should not be considered in isolation or as a substitute for, and should be read in conjunction with,
our net income (loss), operating income (loss), basic or diluted earnings (loss) per share and cash flow data prepared in accordance with GAAP. Everi defines Adjusted
EBITDA as earnings (loss) before interest, loss on extinguishment of debt, taxes, depreciation and amortization, non-cash stock compensation expense, accretion of
contract rights, the write-off of certain inventory and fixed assets, the adjustment of certain purchase accounting liabilities, goodwill impairment charges, separation costs
related to the Company’s former CEO, non-cash write-down of note receivable and warrant, loss on the sale of aircraft, manufacturing relocation costs and non-recurring
professional fees. Everi defines Free Cash Flow as Adjusted EBITDA less cash interest, capital expenditures, placement fees, and cash taxes.

Everi presents Adjusted EBITDA as it uses this measure to manage its business and considers this measure to be supplemental to its operating performance. Everi also
makes certain compensation decisions based, in part, on its operating performance, as measured by Adjusted EBITDA; and its credit facility and senior unsecured notes
require Everi to comply with a consolidated secured leverage ratio that includes performance metrics substantially similar to Adjusted EBITDA. Everi presents FCF as a
measure of performance and the Company uses this measure as an indication of the strength of the Company and its ability to generate cash. Management believes this
measure provides investors with a better understanding of the opportunity to pay down debt. It should not be inferred that the entire free cash flow amount is available for
discretionary expenditures. A reconciliation of Everi’s most directly comparable GAAP measure to Adjusted EBITDA and FCF is included in this presentation and/or in Everi’s
earning releases located on Everi’s website at ir.everi.com. Management believes that this presentation is meaningful to investors in evaluating the performance of Everi’s
segments.

                                                                                                                                                                                 33
UNAUDITED RECONCILIATION OF NET LOSS TO ADJUSTED
           EBITDA AND FREE CASH FLOW
                                                              Actual            Actual             Actual          Actual             Actual
Adjusted EBITDA Reconciliation                             Consolidated      Consolidated       Consolidated       Games             FinTech
                                                                                                                                                       Management’s Adjustments
($ in millions)                                                2016              2017               2018            2018               2018
Net income (loss)                                        $         (249.5) $           (51.9) $           12.4                                         1. Stock Compensation: The non-cash expense
                                                                                                                                                          associated with the value of equity awards granted
Income tax provision(benefit)                                        31.7              (20.2)             (9.7)                                           to employees by the Company.
Loss on extinguishment of debt                                        -                 51.8               0.1
                                                                                                                                                       2. Accretion of contract rights: Amortization of the
Interest expense, net of interest income                             99.2             102.1               83.0                                            placement fees against gaming operations revenue
                                                                                                                                                          for terminals deployed at sites under placement fee
 Operating (loss)income                                  $         (118.6) $           81.8 $             85.8 $            3.1 $              82.7       agreements
                                                                                                                                                       3. Goodwill impairment: Based on annual goodwill
Depreciation and amortization                            $         144.6 $            116.8 $           126.5 $         110.2 $                16.3       impairment testing, the Company determined that
                                                                                                                                                          the carrying amount of its Games reporting unit
                                                                                                                                                          exceeded its estimated fair value
 Reported EBITDA                                         $          26.1 $            198.6 $           212.3 $         113.3 $                99.0
                                                                                                                                                       4. Separation costs of former CEO: Legal and
                                                                                                                                                          severance costs associated with the termination of
Management's Adjustments:                                                                                                                                 former CEO in February 2016
Non-cash stock compensation expense                      $           6.7 $              6.4 $              7.3 $            2.3 $               5.0
                                                                                                                                                       5. Write-down of note receivable and warrant:
Non-cash accretion of contract rights                                8.7                7.8                8.4              8.4                 -         Write-down to fair value of a warrant and note
Non-cash goodwill impairment                                       146.3                -                  -                -                   -         receivable that was extended by Multimedia
Separation costs for former CEO                                      4.7                -                  -                -                   -         Games, predecessor to Everi Games Holding Inc., to
Non-cash write-down of note receivable and warrant                   4.3                -                  -                -                   -         an Austin-based digital and interactive company
                                                                                                                                                          who defaulted on the note receivable
Loss on sale of the aircraft                                         0.9                -                  -                -                   -
Manufacturing relocation costs                                       0.4                -                  -                -                   -      6. Loss on the sale of the aircraft: Purchased an
                                                                                                                                                          aircraft in 2015; upon termination of the former
Non-cash write-off of inventory and fixed assets                     -                  -                  2.6              2.6                 -
                                                                                                                                                          CEO Company made decision to sell the aircraft
Non-cash adjustment to purchase accounting liabilities               -                  -                 (0.6)             -                  (0.6)
                                                                                                                                                       7. Manufacturing relocation costs: Costs to relocate
Non-recurring professional fees                                      -                  -                  0.4              0.2                 0.2       and integrate certain Games manufacturing and
                                                                                                                                                          warehousing functions from Las Vegas and WA to
Total Management Adjustments                             $         171.9 $             14.2 $             18.1 $            13.5 $              4.6       Austin, TX
                                                                                                                                                       8. Write-off of inventory and fixed assets: Non-
 Adjusted EBITDA                                         $         198.0 $            212.8 $           230.4 $         126.8 $           103.6           cash charge of $2.6 million related to the 2Q 2018
                                                                                                                                                          write-off of certain inventory and fixed assets.
Less:                                                                                                                                                  9. Adjustment of certain purchase accounting
                                                                                                                                                          liabilities: Non-cash benefit of $0.6 million related
 Cash paid for Interest                                             93.4               89.0              81.6
                                                                                                                                                          to the adjustment of certain purchase accounting
 Cash paid for capital expenditures                                 80.7               96.5             103.0                                             liabilities related to the acquisition of certain
 Cash paid for placement fees                                       11.3               13.3              20.6                                             Compliance assets acquired in 2015.
 Cash paid for income taxes                                          1.7                1.0               0.4                                          10. Non-recurring professional fees: Professional
 Cash refunded for income tax                                       (0.2)              (0.8)              -                                               fees totaling $0.4 million incurred for certain
                                                                                                                                                          projects not considered part of normal course of
 Free Cash Flow                                          $          11.1 $             13.8 $             24.8                                            business.

                                                                                                                                                                                                                  34
RECONCILIATION OF PROJECTED NET INCOME TO
PROJECTED EBITDA AND PROJECTED ADJUSTED EBITDA

   Consolidated Adjusted EBITDA Reconciliation       Target          Target
   ($ in millions)                                   2019E            2019E
                                                   Low Range       High Range
   Net income                                    $          17.0 $          23.0
   Income tax benefit                                       (3.0)           (5.0)
   Interest expense, net of interest income                 88.0            86.0

    Operating income                             $        102.0 $          104.0

   Depreciation and amortization                 $        132.0 $          136.0

    Reported EBITDA                              $        234.0 $          240.0

   Management's Adjustments:
   Non-cash stock compensation expense           $          8.0 $            7.0
   Non-cash accretion of contract rights                   10.0              8.0

   Total Management Adjustments                  $         18.0 $           15.0

    Adjusted EBITDA                              $        252.0 $          255.0

                                                                                    35
You can also read