Evidence for Gross Domestic Product growth time delay dependence over Foreign Direct Investment. A time-lag dependent correlation study.
←
→
Page content transcription
If your browser does not render page correctly, please read the page content below
Evidence for Gross Domestic Product growth
                                                 time delay dependence over Foreign Direct
                                               Investment. A time-lag dependent correlation
                                                                  study.
arXiv:1905.01617v1 [q-fin.GN] 5 May 2019

                                                                      ∗
                                               Marcel Ausloos1,2,3, , Ali Eskandary1 , Parmjit Kaur4 , Gurjeet Dhesi5
                                                            1
                                                          School of Business, University of Leicester,
                                                       Brookfield, Leicester, LE2 1RQ, United Kingdom
                                                                    Email: ma683@le.ac.uk
                                                            2
                                                         Department of Statistics and Econometrics,
                                                         Bucharest University of Economic Studies,
                                               Calea Dorobantilor 15-17, Bucharest, 010552 Sector 1, Romania.
                                                        3
                                                            GRAPES, rue de la Belle Jardinière, 483/0021
                                                             B-4031, Liège Angleur, Belgium, Euroland
                                                                 Email: marcel.ausloos@ulg.ac.be
                                           4
                                                De Montfort University, Leicester Castle Business School, Hugh
                                                       Aston, Leicester, LE1 9BH, United Kingdom
                                                                 Email: pkcor@dmu.ac.uk
                                           5
                                               School of Business, London South Bank University, 103, Borough
                                                         Road, London, SE1 0AA, United Kingdom.
                                                                  Email: dhesig@lsbu.ac.uk

                                                                          ∗
                                                                              corresponding author

                                                                                   Abstract
                                                      This paper considers an often forgotten relationship, the time delay
                                                  between a cause and its effect in economies and finance. We treat the
                                                  case of Foreign Direct Investment (FDI) and economic growth, - mea-
                                                  sured through a country Gross Domestic Product (GDP). The pertinent
                                                  data refers to 43 countries, over 1970-2015, - for a total of 4278 observa-
                                                  tions. When countries are grouped according to the Inequality-Adjusted
                                                  Human Development Index (IHDI), it is found that a time lag depen-
                                                  dence effect exists in FDI-GDP correlations. This is established through
                                                  a time-dependent Pearson ’s product-moment correlation coefficient ma-
                                                  trix. Moreover, such a Pearson correlation coefficient is observed to evolve

                                                                                       1
from positive to negative values depending on the IHDI, from low to high.
It is "politically and policy "relevant" that the correlation is statistically
significant providing the time lag is less than 3 years. A "rank-size" law
is demonstrated. It is recommended to reconsider such a time lag effect
when discussing previous analyses whence conclusions on international
business, and thereafter on forecasting.
1 Introduction
Foreign Direct Investment (FDI) concerns investments made by a company or
individual from one country into business interests in another country, in order
to establish either effective control of, or at least substantial influence over, the
decision making of the concerned (foreign) business. Literature has remained
indecisive regarding the impact of FDI upon the economic growth enjoyed by
the nations in which some business is targeted (Hoekman and Javorcik, 2004).
The crux of this debate lies in the inability to reach a consensus on (necessar-
ily asymmetric) causality (Javorcik and Saggi, 2010), but Barrell et al. (2017)
observed the main factors affecting bilateral FDI stocks (from 14 high income
countries to all OECD countries over the period 1995-2012). High market inte-
gration is a fundamental aspect (Barrell and Nahhas, 2018). One may expect
the same at an "average level" measured through a country Gross Domestic
Product (GDP).
Our paper explores such an area of research on FDI through original mea-
surements of time dependent econometrics effects.
Economies are measured in terms of outputs like the GDP. This output is
composed of the goods and services produced within the country in a given year.
Economic "growth" is thus measured in the annual change in this GDP as com-
pared to the previous year. The change between these two years can be positive
or negative. Any references to growth in this paper refer to this annualized
change in GDP (often measured in percents), after removing inflation.
Most observers detect a positive relationship between FDI and GDP, but
many counterarguments do exist. Research undertaken by Blomström and
Kokko (1996), de Mello (1999), Alfaro et al. (2004), for example, all observed a
positive correlation. However, Hymer (1960), Caves (1971), Lipsey and Sjoholm
(2006), among others, found a negative relationship; see a more extensive list of
disagreeing authors below in Sect. 2.
Given this disagreement, we seek to address one underlying assumption
which requires clarification. We stress that there is a conceptual difference
between causality and correlation (Liang, 2014; 2016). The purpose of our
study is not to make any statements in relation to establishing means of causal-
ity between FDI and Growth, as in Borensztein et al. (1998), Nair-Reichert
and Weinhold (2001), Zhang (2001), Choe (2003), Kuo et al. (2003), Hoekman
and Javorcik (2004), Li and Liu (2005), De Gregorio (2005), Hansen and Rand
(2006), Mah (2010) nor "strict local effects" (Brambilla et al., 2009; Hale and
Long, 2011, Wang et al., 2013), for example. This is much discussed elsewhere
as this non-exhaustive list of references may indicate. Rather, we assume that
the relationship exists regardless of its strength or (microeconomic) cause, to-
gether with spatial correlations (Blonigen et al., 2007). We focus on stressing
2that a seemingly hidden or even immediately accepted hypothesis, that is "time
independent correlations", may make the current body of research to be "less
inconclusive".
Thus, the present paper is written to demonstrate that the existence of a time
delay regarding the influence of FDI inflows upon stimulating economic growth,
as measured by GDP growth, might be a key in resolving the discrepancies.
Besides, one may wonder why such a time delay seems not to be taken into
account. Moreover, assuming that there is some relationship between FDI and
GDP growth, we ask how long it takes for this FDI growth to be reflected in
GDP growth. To find such a time span, a so called "memory relaxation time"
between inflow and output, in which a finite correlation value is found to be
significant, seems of interest from a policy (and also from a political) point of
view indeed.
"Finally", it can be intuitively admitted that the macroeconomic forces be-
hind some cash inflow could influence a mature economy differently that an
underdeveloped society. Thus, such a categorization seems also a pertinent
discussion. We use a UN’s recently invented index, the Inequality-Adjusted
Human Development Index (IHDI), devlopped from the Human Development
Index (HDI)1 . For completeness, let us recall that, quoting Harttgen and Klasen
(2010), "The HDI is a composite index that measures the average achievement in
a country in three basic dimensions of human development: a long and healthy
life, measured by life expectancy at birth; education, measured by the adult lit-
eracy rate and the gross school enrollment, and standard of living, measured
by GDP per capita (UNDP, 2006)." Thus, the (initially invented) Human De-
velopment Index (HDI) considers only average achievements and does (or did)
not take into account the distribution of human development within a coun-
try or by population sub-groups. Thereafter, the IHDI is invented in order to
combine a countryâĂŹs average achievements in health, education and income
with how those achievements are distributed among countryâĂŹs population
by âĂIJdiscountingâĂİ each dimensionâĂŹs average value according to its level
of inequality. In brief, the difference between the IHDI and HDI is the human
development cost of inequality.
If not noticed, we do not search nor study a Granger causality scheme; one
should warn the reader that correlation studies do not immediately uncover
causal links.
2 Literature Review: "the state of the art".
Causal time lags have been seen and discussed in many other fields, of course,
but we will be short on such references for the sake of conciseness. However,
from a more general viewpoint, we should mention that an extensive FDI and
economic growth literature review from 1994 to 2012 has been provided by
Almfraji and Almsafir (2014).
No need to elaborate on the notion that FDI are private capital flows from
a parent firm to an entity based in a foreign country (Griffin and Pustay, 2007);
Marin and Schnitzer, 2011). One may consider that FDI can flow in two direc-
tions, outwards as an investor and inwards as an investor. In this paper, any
1 http : //hdr.undp.org/en/content/inequality−adjusted−human−development−index−
ihdi
3reference to FDI will strictly refer to FDI inflows received by a country, usually
that with the lowest Gross Domestic Product (GDP). Economic growth is mea-
sured in the annual change in GDP (after removing inflation) as compared to
the previous year. The change between these two years determines the growth
or shrinkage of the GDP which is measured in percentages. Any references to
growth in this paper refer to this yearly change in GDP.
2.1 The relationship between Foreign Direct Investment
and Gross Domestic Product Growth.
Theoretically, FDI is believed to directly impact growth through increasing a
countries capital stock and through acting as a vehicle for the transfer of technol-
ogy and knowledge which in turn creates new job opportunities. For example,
an interesting work about FDI analysis on regional level (Strat, 2014) can be
quoted. These transfers cause substantial economy-wide spillovers, thus boost-
ing long term productivity economy-wide and not merely for the recipient firm
(Rappaport, 2000, Mencinger 2003). The net effect is an increase domestic
productivity and acceleration in economic growth (Borensztein et al. 1998; de
Mello, 1999; De Gregorio, 2005). With commercial bank lending increasingly
scarce in the 1980’s , many countries loosened FDI restrictions and offered ag-
gressive subsidies and tax incentives in order to attract foreign capital inflows
(World Bank, 1997). This led to a surge of private capital flows particularly
toward businesses in developing economies.
2.2 On the positive relationship between Foreign Direct
Investment and Gross Domestic Product growth.
Scholars taking the view that there is a positive relationship between FDI and
Growth based their conviction on macroeconomic studies which use aggregate
FDI flows (Abbes et al., 2015). In establishing causality, two distinct theories
emerge; the "FDI-led growth hypothesis" and the "market size hypothesis".
The former believes that FDI stimulates growth through increasing a country ’s
capital stock and allowing for the transfer of technology and knowledge which
in turn creates new job opportunities (De Gregorio, 2005). The latter believes
that GDP growth gives the host country new investment opportunities which in
turn lead to a large FDI inflow (Mah, 2010). Within this line many scholars seek
to establish the dominant factors affecting the growth. Romer (1993) dubbed
these factors as "idea gaps" between countries of different economic standing
which FDI can help bridge. The dominant factors are found to fall into four
categories; labour force skills (de Mello, 1999; Ali et al., 2016), technology trans-
fer (Boreinsztein et al., 1998; de Mello, 1999; Hansen and Rand, 2006; Tu and
Tan, 2011), infrastructure and institutional development (Balusubramanyam et
al., 1996; Hermes and Lensink, 2003; Durham, 2004), and trade liberalisation
(Bengoa and Sachez-Roble, 2003).
Although these studies all find different factor determinants of the effective-
ness of FDI, the results can be interpreted from the hypotheses that countries
seek to improve their domestic financial systems and processes in order to create
an environment which will allow FDI to thrive. It must be noted at once that
these macroeconomic studies do carry flaws. They do not control adequately
for simultaneity bias, country-specific effects and lagged dependent variables in
4growth regression. We consider that these flaws may create some bias in both
the coefficient estimates and standard errors, suggesting that we might also duly
criticize the "positive relationship" findings.
2.3 On the negative relationship between Foreign Direct
Investment and Gross Domestic Product growth.
A fair body of literature challenges the belief that FDI has a positive impact
upon growth, in view of firm level microeconomic studies.
One of the most renowned theories on the negative effect of FDI upon growth
is raised by Hymer (1960) and Caves (1974) in the form of "control theory",
For example, Saltz (1992) or Huang (1998, 2003) found a negative correlation
explained through monopolisation which causes a lag in domestic demand. An-
other reason as presented by Braunstein and Epstein (2002) is the lack of local
investments, resulting in a reduction in tax revenues, with driving down wages,
- due to reduced competition. Bos et al. (1974) even found an outflow of profits
which exceeded the level of new investment. This is also a conclusion which can
de drawn from Görg and Greenaway (2002).
In view of explaining some discrepancy, Lipsey (2002) suggests that most
of the evidence for wage spill overs is found in developed countries where there
is wider access to knowledge, capital and technology and as such multinational
entities are less likely to prevent spill overs. In fact, for emerging countries,
Ahmed’s (2012) study of Malaysia, for the 1999-2009 period, inspected the in-
fluence of FDI on human capital, labour force, absorptive capacity and GDP.
He found that FDI inflows contributed negatively to total productivity and thus
economic growth. This was mirrored by Mazenda’s (2014) study on South Africa
for the period 1960-2002.
Thus, such studies conclude that the effect of FDI on GDP growth is mostly
negative, and distinguish several ingredients, explaining some disagreement with
the findings of the "positive relationship" authors.
2.4 No relationship found between Foreign Direct Invest-
ment and Gross Domestic Product growth.
Let us be "complete": a third camp exists which believes that there is no con-
clusive evidence at all to establish that a correlation between FDI and Growth
exists: Germidis (1977), Mansfield and Romeo (1980), Haddad and Harrison
(1993), Aitken and Harrison (1999), Irandoust (2001), Louzi and Abadi (2011),
Carkovic and Levine (2005), Herzer et al. (2008), Belloumi (2014), Aga (2014),
Temiz and Gökmen (2014), all failed to find any robust conclusion on the ex-
istence of growth stemming from FDI inflow, - using different data analysis
techniques. However, no time lag was considered for the relationship process,
whence our present concern about time dependent correlations.
2.5 The study of time lags.
Of course, time dependence of correlations have been studied. In fact, stud-
ies about time lags, in intuitively causal processes, have been undertaken in
different financial, managerial, and accounting topics. A literature review of
5interest on audit report lags is provided by Abernathy et al. (2017). A "de-
layed expected loss recognition and the risk profile of banks" was considered by
Bushman and Williams (2015). Li and Mei (2012) analyzed the influences of a
time delay on the stability of a market model with stochastic volatility. Other
particular studies, Miskiewicz (2012) and Ausloos and Lambiotte (2007), sug-
gest to examine the key role of time lags, on "globalization", as also discussed
by Cerqueti et al. (2018).
Let us emphasize Miskiewicz (2012) who used a model of the stock market
coupled with an economy to investigate the role of the time delay span on the
information flow. An information flow was coupled into the stock market model
which interacted with the economy. The observation made was that through
the autocorrelation of absolute returns, cycles appeared as the time delays were
increased. This meant that increasing delays in the information flow resulted in
the increasing homogenization in the behaviors of actors in the stock market.
This collectivization was found to relate closely to the price bubbles and crashes
of real markets, explaining how bubbles and crashes form. The study also
found that after a certain time delay, further increasing this delay had no effect
on the behavior of actors. Interestingly, Miskiewicz (2012) study discovered a
relaxation time of flow influence: his model holds only until a certain time delay,
- after which further delay of information is found to have no effect.
Previously, Ausloos and Lambiotte (2007) studied correlations between the
GDP of rich countries where GDP proxied a nation ’s wealth. Yearly fluctua-
tions of the GDP were calculated which were checked for correlations with the
correlation measure (based on the Theil index). Time delays with the least cor-
relations were removed in order to generate a structure within the network of
countries. The study observed patterns being formed under the form of clusters
in the countries network. This structure adhered to geography and fell in line
with economic globalization which homogenized the economic development of
countries.
Our research takes a similar approach to Ausloos and Lambiotte (2007) and
seeks to form a network based on the country’s wealth. The correlation measure
is framed on an Index, here the Inequality-Adjusted Human Development Index
(IHDI).
Thereafter, the range of time lag effect, as discussed by Miskiewicz (2012),
can be deduced, for any "memory time span concern".
3 Data
The dataset consists of the observation from 43 countries over the period from
1970-2015, as obtained from the World Bank Databank2 . The country selection
depends on the completeness of the data. There are 4278 individual observa-
tions. The FDI data focused on net inflows over the aforementioned period
normalized in current USD. The GDP data gathered was annual GDP growth.
The Data was gathered subject to availability; countries were chosen based upon
the Inequality-Adjusted Human Development Index (IHDI). This is a measure-
ment of the living standards in a country adjusted for inequality. This data is
made available by the United Nations Development Project and is compiled on
an annual basis. The reasoning is to categorize developing nations effectively
2 www.databank.worldbank.org
6as to ensure fair comparisons given that vast variances in the distribution of
wealth will affect the economic multiplier effects of FDI across the economy and
as such in respects to GDP growth. The data is split into four panels which
follow the UN’s IHDI. These four panels are:
• Very High IHDI, which translates into an IHDI score between 1-0.80, the
(13) economies falling within this bracket are Australia, Austria, Canada,
Denmark, France, Finland, Germany, Netherlands, Sweden, Great Britain,
Norway, Iceland and Ireland, called sub-sample S1 below;
• High IHDI, which translates into an IHDI score between 0.799- 0.70, the
(11) economies falling within this bracket are Argentina, Israel, Spain,
Italy, United States of America, Portugal, Greece, Japan, Malta, Cyprus,
Korea, called sub-sample S2 below;
• Medium IHDI, which translates into an IHDI score between 0.699-0.55,
the (8) economies falling within this bracket are Uruguay, Sri Lanka,
Venezuela, Mexico, Peru, Mauritius, Chile and Turkey, called sub-sample
S3 below;
• Low IHDI, which translates into an IHDI score of 0.549 and below, the
(11) economies falling within this bracket are the Philippines, Paraguay,
Iraq, Bolivia, South Africa, Nigeria, Niger, El Salvador, India, Nepal and
Ghana, called sub-sample S4 below
Given the disparity between the number of Very High IHDI and Low IHDI
countries, the data exhausted the availability of Very High IHDI and High IHDI
countries, - but we selected a few Low IHDI countries at random, in view of
allowing an equivalent number of economies, in scale with the other categories
for some statistical coherence.
Nevertheless, one may question the barriers between various IHDIs, and
the subsequent ranking. Of course, the Pearson correlation coefficient belongs
to the [-1, +1] interval, but its exact value depends on the reliability of the
FDI and GDP data. On one hand, one may test the data reliability through
Benford’s law, or through Zipf’s law, and observe outliers, - which can thereafter
be neglected if thought to be unreliable. Another method, going beyond the
Zip’s power law, in particular allowing some better observation of extremes
and anomalous deviations, is the extended rank-size law (Ausloos and Cerqueti,
2016) when one or both ends of the distribution deviate from the ideal power
law. Grouping all the IHDI, we test the rank-size law in Section 5 for observing
if any scattering of data might be ambiguous.
4 Methodology.
As outlined here above, there exists a plethora of literature on the existence
(or lack thereof) of the relationship between FDI and growth. Complex regres-
sion models are drawn to establish the framework through which some result is
gathered. This paper takes a different approach; the model intentionally seeks
to limit assumptions unless necessary, essential or in the form of general state-
ments. The purpose of this methodology, at its most fundamental is to establish
7an empirical core which is set at the most rudimentary empirical level. The ob-
servation of trends and the establishment of accuracy of these observations is
the intention.
The methodology is based on an adjusted Pearson correlation to allow for
the introduction of time lags (The data is presented in time series format.). The
classical ("equal time") Pearson ’s product moment correlation coefficient, used
to measure the degree of linear dependence between two variables, is usually
defined through
Pn Pn P
cov(Xt , Yt ) n t Xt Yt − ( t Xt )( t Yt )
ρXt ,Yt = = p Pn 2 Pn p Pn Pn (4.1)
σXt σYt n i Xt − ( t Xt )2 n i Yt2 − ( i Yt2 )
where cov(Xt , Yt ) is the covariance between Xt and Yt ; σXt and σYt is the
standard deviation of the Xt and Yt distribution respectively, and where n refers
to the number of values. The lagged serial correlation between Xt and Yt−k of
order k is
cov(Xt , Yt−k )
ρXt ,Yt−k = . (4.2)
σXt σYt−k
In the following Xt corresponds to the GDPt and Yt to F DIt . Hence equation
(4.2) introduces lags in F DIt−k in the form Yt−1 , Yt−2 and Yt−3 . This allows
for the comparison of GDP with the corresponding F DI lagged by up to three
years.
The lag has been limited to three years, as the data analysis showed an
increasing lack of coherence beyond this time value. Indeed, further lags were
attempted but yielded no noteworthy results. Given the nature of statistics as
well as the emphasis of this study, - that is the observation of trends, increasing
this time frame provides a larger time frame in which the study showed this
correlation is lost., as was found and discussed by Miskiewicz (2012). Thus,
"long range correlation results", being meaningless, are not reported in this
study. It should be obvious at once that this "meaningful time lag" finding
should have much implication on economic policies and theories.
4.1 Results
The results are presented and discussed according to the clustering formation
based on the IHDI country value.
4.1.1 Very High IHDI: S1
The first subset of data involving the "Very High" dataset as grouped by their
IHDI is shown in Table 1. The data shows a significant skewness towards the
later lags. The data suggests a negative correlation between FDI and GDP
growth. However, Finland and Sweden are outliers„ presenting a mixed positive
and negative correlation depending on the lag; both countries present a positive
correlation coefficient for no lag (Lag0) and for Lag3. For Lag2, all correlation
coefficients are negative.
8S1 Pearson Correlation Coefficient
Country Lag0 Lag1 Lag2 Lag3
Australia -0.0891 -0.1057 -0.1658 -0.1544
Austria -0.0324 -0.0578 -0.2531 -0.1171
Canada -0.1116 -0.3343 -0.4100 -0.2259
Denmark 0.0731 -0.0698 -0.2549 -0.1092
France -0.2658 -0.4128 -0.4663 -0.4376
Finland 0.1477 -0.2007 -0.2216 0.0011
Germany -0.0492 -0.0832 -0.3272 -0.3945
Netherlands -0.1127 -0.2612 -0.5156 -0.356
Sweden 0.1827 -0.0798 -0.0671 0.0903
Great Britain -0.0281 -0.2873 -0.2852 -0.2979
Norway -0.292 -0.5401 -0.4867 -0.5135
Iceland 0.3606 0.2447 -0.0723 -0.4235
Ireland -0.051 -0.189 -0.3079 -0.3582
Table 1: Time lag dependent Pearson correlation coefficients for 13 Very High
Inequality-Adjusted Human Development Index (IHDI) countries
4.1.2 High IHDI: S2
The second data subset , "High" according to their IHDI is analyzed in Table 2
The pattern which emerges shows a significant skewness towards the later lags,
but in a smaller degree than seen in Table 1. for the "Very High". Although
the dominant lag is again Lag2, in this case the second dominant lag is Lag1
followed by Lag3 and Lag0. This data set too contains two outliers, Argentina
and Cyprus, presenting a positive correlation, at "no lag", in contrast to all
other countries. Notice that Portugal shows a high (negative) correlation at all
levels, with a systematic tendency.
4.1.3 Medium IHDI: S3
The Pearson correlation coefficient values for the medium IHDI are shown in
Table 3. They show some skewness towards lower lags with no lag the dominant
result, whatever the sign of the correlation, followed by Lag2, Lag1 and Lag3
respectively. The pertinent findings about the Very High and High datasets
is mirrored here: the correlation between FDI and Growth is no longer pre-
dominantly negative but has shifted towards an even split between positive and
negative correlations. The positive correlation rather decreases with increasing
lag.
4.1.4 Low IHDI: S4
Lastly, this process is repeated for the Low HDI dataset. The data in Table 4
skews towards the weaker lags with the absence of a lag again being the dominant
cases, followed by Lag1, Lag2 and then Lag3. The pertinent observation here
concerning the correlation shows that the Pearson coefficient is predominantly
positive with a few negative correlations.
9S2 Pearson Correlation Coefficient
Country Lag0 Lag1 Lag2 Lag3
Argentina 0.070 -0.0026 -0.1665 -0.2003
Israel -0.0814 -0.1962 -0.2664 -0.2507
Spain -0.1723 -0.3860 -0.4221 -0.3608
Italy -0.2451 -0.2707 -0.5857 -0.5027
USA -0.1703 -0.3730 -0.3959 -0.3118
Portugal -0.4676 -0.4155 -0.4101 -0.4005
Greece -0.1707 -0.3173 -0.4333 -0.5772
Japan -0.4620 -0.5979 -0.3580 -0.0681
Malta -0.2271 -0.3781 -0.1920 -0.2168
Cyprus 0.0037 -0.0115 -0.0653 -0.3012
Korea -0.4883 -0.4884 -0.4548 -0.4838
Table 2: Time lag dependent Pearson correlation coefficient values for 11 High
IHDI countries
S3 Pearson Correlation Coefficient
Country Lag0 Lag1 Lag2 Lag3
Uruguay 0.2719 0.2009 0.1545 0.0954
Sri Lanka 0.3837 0.2367 0.1429 0.1974
Venezuela 0.1176 -0.0214 -0.3486 -0.1883
Mexico -0.2526 -0.3069 -0.2489 -0.1737
Peru 0.3097 0.2389 0.1542 0.1571
Mauritius -0.0059 -0.0971 -0.1590 -0.1252
Chile -0.0805 -0.2090 -0.2509 -0.2252
Turkey 0.0113 -0.1529 -0.1281 -0.0046
Table 3: Time lag dependent Pearson correlation coefficient values for 8
Medium IHDI countries
S4 Pearson Correlation Coefficient
Country Lag0 Lag1 Lag2 Lag3
Philippines 0.2148 0.2372 0.1376 0.1110
Paraguay -0.1824 -0.1169 -0.0791 -0.1733
Iraq -0.0876 -0.0362 -0.0849 -0.0626
Bolivia 0.2487 0.1702 0.1313 0.1387
SouthAfrica 0.0587 -0.0702 -0.0065 0.1224
Nigeria 0.1376 0.2380 0.2015 0.1699
Niger 0.2407 0.2615 0.2344 0.2181
ElSalvador 0.1095 0.0032 -0.0744 0.0461
India 0.2701 0.3192 0.2934 0.2574
Nepal 0.0722 0.0668 0.0241 0.0352
Ghana 0.4223 0.3874 0.3618 0.3487
Table 4: Time lag dependent Pearson correlation coefficient values for 11 Low
IHDI.
104.2 Discussion of findings
In this subsection, a closer look can be taken at the findings of the numerical
analysis.
(1) The data shows that as a country ’s overall wealth increases, the effect
of FDI on stimulating growth becomes delayed.
In wealthy "Very High" and "High" countries, there is clearly a tendency
for the FDI to show its influence upon the growth rate in a stronger way when
considering lags. In the "Medium" and "Low" countries this influence is seen
to be weaker in the earlier stages, thus for no lags.
As such, conversely, we can conclude that countries with larger time delays
in their FDI/Growth relationship are those having higher GDP per capita.
(2) It can be also concluded that as a country overall wealth rises, an in-
creasing time lag becomes evident in its growth responsiveness from FDI. This
can be explained using macroeconomic theory.
Given the state of development in developing economies, FDI is used to in-
crease the productive output of the nation. On the other hand, investments
made into developing countries are often made in the form of "Green Field In-
vestment"3 . This policy takes advantage of the relatively lower costs of labour,
materials, production and access to consumer markets than those in a devel-
oped economy. This grants the parent firm a competitive advantage in the new
market, while also providing an entirely new audience to push their products
on. It is known that Western Europe and North America accounted for 70% of
Green Field investment into Africa in 2014 (African Investment Report, 2015).
When this FDI inflow is invested in labour, materials and construction of in-
frastructure, the FDI becomes reflected in the country’s GDP. This explains
why the FDI has a tendency to reflect itself in GDP (and thus growth) over
the short run for developing economies. Given the theoretical role of monopo-
listic power, this imperfect competition of course creates barriers to entry for
domestic firms, whence harming domestic production in the long run, thereby
perhaps explaining the short term causality which is observed.
In developed economies, the opposite holds. Although Green Field Invest-
ment plays a part, it is not the driving factor. Although there are many reasons
for FDI, inflows into developed economies occur for one or more of a few reasons,
like
• Stability: most FDI into developed countries flows into established orga-
nizations. For investment purposes, this provides a stable asset as part of
a portfolio. Diversification in this manner allows for hedging of risk and
provides access to established markets.
• Access to new technology: having access to new technology and organi-
zational systems allows the parent firm to export and implement these
technologies and techniques in their own companies (elsewhere).
It is also widely accepted that business markets in developed economies tend
to be saturated when compared to developing economies, - with less easy room
for growth. In these, investments are not mostly inspired by maintaining and
3 A "green field investment" is a type of foreign direct investment (FDI) where a parent
company builds its operations in a foreign country from the ground up, in contrast to other
methods of FDI, such as foreign acquisitions or buying controlling stakes in a foreign company.
11increasing competitiveness, - in contrast with Green Field Investment in devel-
oping economies. There is also some increased bureaucracy (and/or corruption)
which combined with the aforementioned causes, increases the barriers size to
FDI entry. Increased market penetration thus requires innovation and produc-
tive efficiency which intrinsically contribute towards the presence of a time lag,
as here above demonstrated.
(3) Developing countries have a predominantly positive correlation, whereas
the wealthier countries have a predominantly negative FDI to Growth corre-
lation. This can be explained using macroeconomic theory: although capital
inflows into developing countries quickly reflect into their GDP, it takes rela-
tively a longer time for returns on investments to flow back to the developed
nations. Thus, within the limit of 3 year lags, this relationship is predominantly
negative.
(4) The role of IHDI rankings. We use the IHDI in grouping the data sets; the
ranking can be seen as a reasonably reliable approximation of economic progress.
Given the consideration of inequality in income, consumption and wealth, the
IHDI prevents resource-rich economic oligarchies from over performing. In this
case a lower IHDI rank indicates a higher (better) position.
Given the role of the IHDI in categorizing our data and its reflection of eco-
nomic prosperity this result is reasonably expected. The rank-size analysis of
the Pearson correlation coefficients, in the next section, reflects such an appar-
ently logical but a priori grouping; it will demonstrate the IHDI influence as an
independent parameter to be considered in further work and modeling.
(5) The "relaxation time" or more positively the "memory effect" following
FDI. This can be observed through Fig. 1. Due to various expected differences
between economies, one cannot expect a finely defined evolution of the features
through the Pearson correlation coefficient. However, an average "time lag
evolution" can be searched. In order to do so, we have averaged a linear fit
(the "trend") to each correlation coefficient, in each sub-sample. The resulting
break at the 2-3 year time interval is remarkable, pointing to the verification of
our hypothesis on the possible observation of the existence of such a lag effect
between FDI and GDP growth. The sign also adds value to the comment (4)
4.3 Limitations
Despite the findings, it must be noted that given the nature of the methodology
adopted there remain several possible debates. One can note, and we admit
it, that the findings in no way imply causality. Purposefully, we avoid Granger
causality testing. We emphasize that although the results show that the vari-
ables FDI and GDP growth are correlated and do confirm the presence of a
lag, itself correlated with the state of a country ’s economic development, this
does not absolutely establish direct causality. The Pearson correlation mainly
measures the strength of a linear association, - not the cause. For going beyond
such a discussion, regression models should be used.
The limitations of the interpreting power of the Pearson correlation is par-
ticularly relevant for the secondary observations found in the data; developed
economies tended towards a negative Pearson coefficient between FDI and GDP
growth whereas for developing nations gravitated towards a positive coefficient.
In Table 1 "Very High IHDI" correlation coefficients are predominantly nega-
tive whereas in Table 4 the sign of the "Low IHDI" correlation coefficients is
120.2
0.1
Mean of Pearson Corr. Coeff.
0
-0.1
S4
S3
-0.2 S2
S1
-0.3
-0.4
0 1 2 3
Lag
Figure 1: Evolution of the "averaged" Pearson correlation coefficient trend as
a function of the time lags between FDI and GDP for the 4 clusters of countries.
13Fit Pearson correlation coefficient
parameters Lag0 Lag1 Lag2 Lag3
m1 0.8657±0.0526 0.7365±0.0770 0.9586± 0.0964 0.7194±0.0639
m2 0.0773±0.0059 0.0940±0.0097 0.1295±0.0093 0.0955±0.0082
m3 0.2180±0.0089 0.2733±0.0161 0.2374±0.0156 0.2706±0.0137
R2 0.9880 0.9771 0.9787 0.9832
Table 5: Parameters of the rank-size law fit, Eq.(5.1), to Pearson correlation
coefficient values at different time lags
somewhat evenly distributed. The Pearson correlation is a useful tool for the
spotting of trends. Economies however are incredibly complicated; the use of
a linear method might be considered too simplistic. Nevertheless, the time lag
effect seems indubitable, whence to be considered in causality tests.
Yet, one should think further on the time lag (Cerqueti et al., 2018). Al-
though this study significantly concludes on the existence of a finite size em-
pirical GDP dependent time lag, usually about not more than 3 years, its use
remains debatable and retrospective. Indeed, the GDP data is announced sev-
eral months after its relevant data collection. Moreover, the observations are
not continuously obtained, but occur at discrete time intervals. A finer ap-
proach, through trimester data for example, might be very valuable, surely
under presently globalization conditions.
As such this perhaps represents an area for future study in order to establish
relevance of the findings with regards to policy, ultimately seeking to aid in the
development of economies.
5 Rank-size Law
When the definition of data intervals can be debated, in the context of best-fit
procedures, the rank-size theory allows to explore the presence of regularities
among data and their a priori specified criterion-based ranking (Jefferson, 1989;
Vitanov and Ausloos, 2015). Such regularities are captured by a best-fit curve.
In presence of an inflection point in a visually smooth data distribution, one
could identify two regimes in the ranked data, meaning that the values are
clustered in two families at low and high ranks.
A warning is in order: it should be obvious that the ranking of a country
Pearson correlation coefficient may change from a time lag to another. No doubt
that the time dependence of the ranking should be of interest as well, but such
a subject is left for dynamic evolution studies, much outside the present aims.
One could also complement such an analysis through a Kendall τ measure in
order to observe the ranking consistency inside the IHDI groups or when moving
from one group to another.
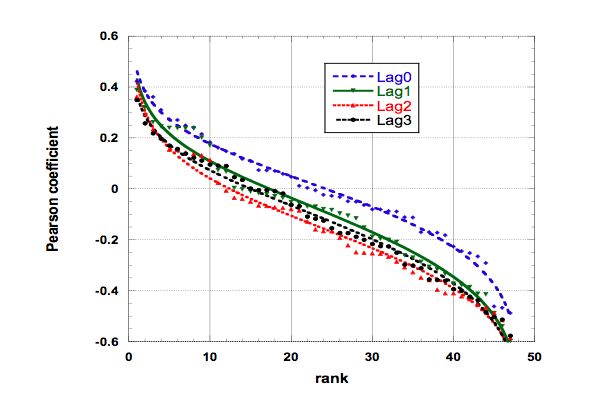
Therefore, a rank-size rule fit was attempted with a decreasing power law,
with different exponents at low and high ranks, - in order to obtain an inflection
point near the center of the data range, i.e. with the analytical form (Ausloos
& Cerqueti, 2016)
14y(r) = −1 + m1 N −m2 r−m2 (N + 1 − r)m3 (5.1)
where r is the rank and N = 43. The best 3-fit parameters have been so
obtained: m1 ∈ [0.720; 0.959]; m2 ∈ [0.077, 0.130]; m3 ∈ [0.218, 0.273]: for a
regression coefficient R2 ∼ [0.977, 0.988], indicating a quite good agreement
with Eq.(5.1); see Fig. 2 and Table 5. Notably, m3 > m2 is indicating a piling
at low rank, i.e. for the "Low IHDI" countries (Ghana is always the r = 1
country, whatever the lag), - for which there is indubitably a positive Pearson
correlation coefficient, thus for which FDI has markedly some influence on GDP.
Notice, for example from Fig. 2, that the number of positive correlations are
for roughly r ≤ 20, i.e. for the "Low IHDI" countries. The "Lag0" data is also
quite different from those for finite lag, indicating, from this rank-size analysis,
that to take into account time lags when searching for FDI on GDP effects, is
mandatory.
6 Conclusions and perspectives
This paper explores a novel area of research in the study of FDI. We have studied
the relationship between Foreign Direct Investment and economic growth with
regards to time lags. The study involved 43 countries over the period ranging
from 1970-2015 with a total of 4278 observations. Using the Inequality-Adjusted
Human Development Index as a proxy for an approximation of a country wealth,
it has been found that the relationship between Foreign Direct Investment and
the growth in Gross Domestic Product changes sign depending on the countries
approximate wealth. Wealthier countries as grouped in "Very High" and "High"
converge to an increased time lag for this relationship to exist: FDI takes a
longer time to influence economic growth. Developing countries as grouped in
"Medium" and "Low" present a shorter time lag in this efficiency relationship:
FDI takes less time to influence economic growth. This difference is explained by
the driving factors behind FDI: in developing economies FDI is predominantly
"market seeking", whereas, in developed economies, it is driven by demands for
access and the diversification of investment.
An interesting point seems to be the (about 3 years) "memory effect" or
"relaxation time effect", between FDI inflow and growth output, suggesting
some reflexion on policies and strategies efficiencies.
Acknowledgments
This paper is partially based upon AE’s M.Sc. dissertation at ULSB under
MA’s supervision.
We gladly thank all reviewers for their comments.
15Figure 2: Rank-size law and its empirical fit, Eq.(5.1), for the Pearson coeffi-
cient at different time lags between FDI and GDP
16References
Abbes, S.M., M.B. Mostefa, G.M. Seghir, & G.Y. Zakarya. (2015). Causal
interactions between FDI, and economic growth: evidence from dynamic panel
co-integration. Procedia Economics and Finance, 23, 276-290.
Abernathy, J.L., Barnes, M., Stefaniak, C., & Weisbarth, A. (2017). An
international perspective on audit report lag: A synthesis of the literature and
opportunities for future research. International Journal of Auditing, 21, 100–
127.
Aga, A.A.K. (2014). The impact of foreign direct investment on economic
growth: A case study of Turkey 1980-2012. Int. J. Econ. Finance, 6, 71-84.
Ahmed, E.M. (2012). Are the FDI inflows spillover effects on Malaysia s
economic growth input driven? Economic Modelling, 29, 1498-504.
Aitken, B.J. & A. Harrison. (1999). Do Domestic Firms Benefit from Direct
Foreign Investment? Evidence from Venezuela. American Economic Review,
89, 605-618.
Alfaro, L., A. Chanda, S. Kalemli-Ozcan, & S. Sayek. (2004). FDI and Eco-
nomic Growth: The Role of Local Financial Markets. Journal of International
Economics, 64, 113-134.
Ali, S.S., M.J. Anwer, H. Mustafa, & A.F. Sidiqqi. (2016). Measuring the
Dependence of Economic Growth (GDP) on Foreign Direct Investment, Labor
Force, and Literacy Rate: The Case of 30 Selected Countries. Int. J. Adv.
Multidiscip. Res, 3, 41–47.
Almfraji, M.A. & M.K. Almsafir. (2014). Foreign direct investment and
economic growth literature review from 1994 to 2012. Procedia-Social and Be-
havioral Sciences, 129, 206-213.
Ausloos, M. & R. Cerqueti. (2016). A universal size-rank law. PLoS ONE,
2016, 0166011.
Ausloos, M. & R. Lambiotte. (2007). Clusters or networks of economies? A
macroeconomic study through Gross Domestic Product. Physica A, 382, 16-21
Balasubramanayam V. N., M. Salisu, & D. Sapsford. (1996). Foreign Direct
Investment and Growth in EP and IS Countries, The Economic Journal, 106,
92-105.
Balasubramanyam, V.N., M. Salisu, & D. Sapsford. (1999). Foreign Direct
Investment as an engine of Growth. The Journal of International Trade & Eco-
nomic Development, 8, 27-40.14
Barrell, R., A. Nahhas, & J. Hunte. (2017). Exchange Rates and Bilateral
FDI: Gravity models of Bilateral FDI in High Income Economies. Economics
17and Finance Working Paper Series, Brunel University London, (17-07).
Barrell, R. & A. Nahhas, A. (2018). Economic integration and bilateral FDI
stocks: the impacts of NAFTA and the EU. LSE Research Online Documents
on Economics 90372, London School of Economics and Political Science, LSE
Library.
Belloumi, M. (2014). The relationship between trade, FDI and economic
growth in Tunisia: an application of the autoregressive distributed lag model.
Economic Systems, 38, 269-287.
Bengoa, M., & B. Sanchez-Robles. (2003). FDI, Economic Freedom, and
Growth: New Evidence from Latin America. European Journal of Political
Economy, 19, 529-545.
Blomström, M. & A. Kokko. (1996). Multinational Corporations and Spillovers.
Journal of Economic Surveys, 12, 247-277.
Blomström, M. & A. Kokko. (2003). The Economics of Foreign Direct In-
vestment Incentives. NBER Working paper 9489.
Blonigen, B.A., R. B. Davies, G. R. Waddell, & H.T. Naughton. (2007).
FDI in space: Spatial autoregressive relationships in foreign direct investment.
European Economic Review, 51, 1303-1325.
Borensztein, E., J. De Gregorio, & J-W. Lee. (1998). How Does Foreign Di-
rect Investment Affect Economic Growth? Journal of International Economics,
45, 115-135.
Bos, H.C., M. Sanders, & C. Secch. (1974). Private foreign investment in
developing countries. (Dordrecht, Holland: D. Reidel).
Brambilla, I., G. Hale, & C. Long. (2009). Foreign direct investment and
the incentives to innovate and imitate. The Scandinavian Journal of Economics,
111, 835–861.
Braunstein, E. & G. Epstein. (2002). Bargaining Power and Foreign Direct
Investment in China: Can 1.3 Billion Consumers Tame the Multinationals?,
Working paper (Amherst, MA: University of Massachusetts).
Bushman, R.M. & C.D. Williams. (2015). Delayed expected loss recognition
and the risk profile of banks. Journal of Accounting Research, 53, 511–553.
Carkovic, M. & R. Levine. (2005). Does Foreign Direct Investment Acceler-
ate Economic Growth? in T.H. Moran, E. M. Grahan, & M. Blomström (eds.),
Does Foreign Direct Investment Promote Development?, Washington D.C.: In-
stitute for International Economic, 195-220.
Caves, R.E. (1971). International corporations: the industrial economics of
foreign investment. Economica, 38, 1-27.
18Caves, R. (1974). Multinational Firms, Competition and Productivity in
the Host Country. Economica, 41, 176-193.
Cerqueti, R., L. Fenga, & M. Ventura, (2018). Does the US exercise conta-
gion on Italy? A theoretical model and empirical evidence. Physica A: Statis-
tical Mechanics and its Applications, 499, 436-442.
Chowdhury, A. & G. Mavrotas. (2005). FDI and growth: a causal relation-
ship, Research Paper, UNU-WIDER, United Nations University (UNU)
Choe, J.I. (2003). Do foreign direct investment and gross domestic invest-
ment promote economic growth? Review of Development Economics, 7, 44–57.
De Gregorio, J. (2005). The role of foreign direct investment and natural
resources in economic development. in : Graham E.M. (eds) Multinationals and
Foreign Investment in Economic Development. International Economic Associ-
ation Series. Palgrave Macmillan, London, 179-197.
De Mello, L.R. (1999). Foreign Direct Investment-Led Growth: Evidence
from Time Series and Panel Data. Oxford Economic Papers, 51, 133-151.
Durham, J.B. (2004), Absorptive Capacity and the Effects of Foreign Direct
Investment and Equity Foreign Portfolio Investment on Economic Growth, Eu-
ropean Economic Review, 48, 285-306.
Ericsson, J. & M. Irandoust. (2001). On the causality between foreign direct
investment and output: a comparative study, The International Trade Journal,
15, 1-26.
Germidis, D. (1977). Transfer of technology by multinational corporations.
Paris. Development Centre of Organization for Economic Cooperation and De-
velopment.
Görg, H. & D. Greenaway. (2002). Much ado about nothing? Do domestic
firms really benefit from foreign direct investment?. CEPR Discussion paper
DP3485.
Griffin, R. W. & M.W. Pustay. (2007). International Business: A Manage-
rial Perspective (5th ed.). (New Jersey: Pearson/Prentice Hall).
Haddad, M. & A. Harrison. (1993). Are There Positive Spillovers from Di-
rect Foreign Investment?: Evidence from panel data for Morocco. Journal of
Development Economics, 42, 51-74.
Hale, G. & C. Long. (2011). Did foreign direct investment put an upward
pressure on wages in China?. IMF Economic Review, 59, 404–430.
Hansen, H. & J. Rand. (2006). On the causal links between FDI and growth
in developing countries. The World Economy, 29, 21-41.
19Harttgen, K., & S. Klasen. (2012). A household-based human development
index. World Development, 40(5), 878-899.
Hermes, N., & R. Lensink. (2003). Foreign direct investment, financial de-
velopment and economic growth. Journal of Development Studies, 40, 142-163.
Herzer, D., S. Klasen, & F.N. Lehmann. (2008). In search of FDI-led growth
in developing countries: the way forward. Economic Modelling, 25, 793-810.
Hoekman, B. & B.S. Javorcik. (2004). Policies facilitating firm adjustment
to globalization. Oxford Review of Economic Policy, 20, 457-473.
Huang, Y. (1998). FDI in China: an Asian perspective. Singapore: Institute
of Southeast Asian Studies.
Huang, Y. (2003). One country, two systems: foreign-invested enterprises
and domestic firms in China. China Economic Review, 14, 4040-4016.
Hymer, S. (1960). On Multinational Corporations and Foreign Direct In-
vestment , in J. H. Dunning (ed.), The Theory of Transnational Corporations.
London: Routledge for the United Nations.
Irandoust, J. E. M. (2001). On the causality between foreign direct invest-
ment and output: a comparative study, The International Trade Journal, 15,
1-26.
Javorcik, B. S. & K. Saggi. (2010). Technological asymmetry among foreign
investors and mode of entry, Economic Inquiry, 48, 415–433.
Jefferson, M. (1989). Why geography? The law of primate city. Geographi-
cal Review, 79, 226- 232.
Kuo, K. C., C. Y. Chang, M. H. Chen, & W. Y. Chen. (2003). In search of
causal relationship between FDI, GDP, and energy consumption-Evidence from
China. Advanced Materials Research, 524, 3388-3391.
Li, X. & X. Liu. (2005). Foreign direct investment and economic growth:
an increasingly endogenous relationship. World development, 33, 393-407.
Li, J. C. & D.C. Mei. (2013). The influences of delay time on the stability
of a market model with stochastic volatility. Physica A, 392, 763-772
Liang, X. S. (2014). Unraveling the cause-effect relation between time series.
Phys. Rev. E, 90, 052150-1-11.
Liang, X. S. (2016). Information flow and causality as rigorous notions ab
initio. Phys. Rev. E, 94, 052201-1-28.
20Lipsey, R. E. (2002). Home and Host Country Effects of FDI, NBER Work-
ing paper 9293; ibid. (2002). Foreign direct investment, growth, and com-
petitiveness in developing countries. The global competitiveness report, 2003,
295–305,
Lipsey, R.E. & F. Sjöholm. 2006). Foreign Firms and Indonesian Manu-
facturing Wages: An Analysis with Panel Data. Economic Development and
Cultural Change, 55, 201-221
Louzi, B.M., & A. Abadi. (2011). The foreign direct investment on economic
growth in Jordan. International Journal of Research & Reviews in Applied Sci-
ences, 8, 253-258.
Mah, J.S. (2010). Foreign Direct Investment Inflows and Economic Growth
of China. Journal of Policy Modeling, 32, 155-158.
Mansfield, E. & A. Romeo, (1980). Technology transfers to overseas sub-
sidiaries by US-based firms. Quarterly Journal of Economics, 95, 737-750.
Marin, D. & M. Schnitzer. (2011). When is FDI a capital flow? European
Economic Review, 55, 845-861.
Mazenda, A. (2014). The effect of foreign direct investment on economic
growth: evidence from South Africa. Mediterranean Journal of Social Sciences,
5, 95-108.
Mencinger, J. (2003). Does foreign direct investment always enhance eco-
nomic growth?. Kyklos, 56, 491–508.
Miskiewicz, J. (2012). Analysis of time series correlation. The choice of dis-
tance metrics and network structure. Acta Physica Polonica A, 121, B89-B94.
Nair-Reichert, U. & D. Weinhold. (2001). Causality Tests for Cross-Country
Panels: a New Look at FDI and Economic Growth in Developing Countries. Ox-
ford Bulletin of Economics and Statistics, 63, 153–171.
Rappaport, J. (2000). How Does Openness to Capital Flows Affect Growth?,
Mimeo, Federal Reserve Bank of Kansas City, RWP 00-11.
Romer, P. (1993). Idea gaps and object gaps in economic development.
Journal of Monetary Economics, 32, 543-573.
Saltz, S. (1992). The Negative Correlation Between Foreign Direct Invest-
ment and Economic Growth in the Third World: Theory and Evidence. Rivista
Internazionale di Scienze Economiche e Commerciali, 39, 617-633.
Strat, V. A. (2014). What happened with the attractiveness of the Romanian
counties for FDI during the period 2001-2012?. Journal of Applied Quantitative
Methods, 9, 22-37.
21Temiz, D., & A. Gökmen. (2014). FDI inflow as an international business
operation by MNCs and economic growth: An empirical study on Turkey. In-
ternational Business Review, 23, 145-154.
Tu, Y. & X. Tan. (2012). Technology spillovers of FDI in ASEAN sourcing
from local and abroad. China Finance Review International, 2, 78-94.
UNDP. (2006). Human Development Report 2006. Beyond Scarcity: Power,
Poverty and the Global Water Crisis.UNDP, New York.
Vitanov, N.K., & M. Ausloos. (2015). Test of two hypotheses explaining
the size of populations in a system of cities. Journal of Applied Statistics, 42,
2686-2693.
Wang, D.T., F. F. Gu, D.K. Tse, & C. K. B. Yim, (2013). When does FDI
matter? The roles of local institutions and ethnic origins of FDI. International
Business Review, 22, 450–465.
World Bank (2016) World Bank Open Data. Available at:
http://data.worldbank.org/
Zhang, K.H. (2001). Does foreign direct investment promote economic
growth? Evidence from East Asia and Latin America. Contemporary economic
policy, 19, 175–185.
22You can also read