Evolutionary history of Sundaland shrews (Eulipotyphla: Soricidae: Crocidura) with a focus on Borneo
←
→
Page content transcription
If your browser does not render page correctly, please read the page content below
Zoological Journal of the Linnean Society, 2021, XX, 1–24. With 7 figures.

Evolutionary history of Sundaland shrews (Eulipotyphla:
Soricidae: Crocidura) with a focus on Borneo

                                                                                                                                   Downloaded from https://academic.oup.com/zoolinnean/advance-article/doi/10.1093/zoolinnean/zlab045/6327494 by guest on 24 September 2021
ARLO HINCKLEY1,*, , MIGUEL CAMACHO-SANCHEZ1,2, , MANUEL RUEDI3,
MELISSA T. R. HAWKINS4, , MADELEINE MULLON5, ANNA CORNELLAS1,
FRED TUH YIT YUH6 and JENNIFER A. LEONARD1,*
1
 Conservation and Evolutionary Genetics Group, Estación Biológica de Doñana (EBD-CSIC), Seville,
Spain
2
 Instituto Andaluz de Investigación y Formación Agraria, Pesquera, Alimentaria y de la Producción
Ecológica (IFAPA) Centro Las Torres, Alcalá del Río, Spain
3
 Natural History Museum of Geneva, Switzerland
4
 National Museum of Natural History, Department of Vertebrate Zoology, Smithsonian Institution, USA
5
 Harvard Museum of Comparative Zoology, USA
6
 Sabah Parks, Kota Kinabalu, Sabah, Malaysia

Received 2 December 2020; revised 18 May 2021; accepted for publication 15 June 2021

The hyperdiverse shrew genus Crocidura is one of few small mammal genera distributed across Sundaland and all of
its boundaries. This represents a rare opportunity to study the geological history of this region through the evolutionary
history of these shrews. We generate a phylogeny of all recognized species of Sundaland Crocidura and show that most
speciation events took place during the Pleistocene, prior to the inundation of the Sunda Shelf around 400 000 years
ago. We find east–west differentiation within two separate lineages on Borneo, and that the current taxonomy of its two
endemic species does not reflect evolutionary history, but ecophenotypic variation of plastic traits related to elevation.
Sulawesi shrews are monophyletic, with a single notable exception: the black-footed shrew (C. nigripes). We show that the
black-footed shrew diverged from its relatives on Borneo recently, suggesting a human-assisted breach of Wallace’s line.
Overall, the number of Crocidura species, especially on Borneo, probably remains an underestimate.

ADDITIONAL KEYWORDS: biogeography – cryptic species – divergence – phylogenetic systematics – South-
East Asia – species delineation – speciation.

                    INTRODUCTION                                    and the Isthmus of Kra divides Sundaland from
                                                                    Indochina (Fig. 1). The first two are oceanic
The biogeographic region of Sundaland (Borneo,
                                                                    biogeographic limits and the latter is a terrestrial
Sumatra, the Malay Peninsula, Java, Palawan and
                                                                    transition, possibly shaped by rainfall variation and
associated islands) is important to our understanding
                                                                    associated habitat differences (Woodruff & Turner,
of evolution. Sundaland inspired Alfred Russel Wallace
                                                                    2009; Lim et al., 2020).
to independently arrive at the theory of evolution by
                                                                      The geological structure of Sundaland, as a series of
natural selection, and has been instrumental in the
                                                                    currently isolated land masses that were previously
foundation of modern biogeography (Wallace, 1869).
                                                                    contiguous, makes the region excellent for testing
This region is defined by three biogeographic limits.
                                                                    alternative hypotheses that explain the observed high
Wallace’s Line is a sharp biogeographical break
                                                                    biodiversity in the tropics (Hall, 2013; Sheldon et al.,
that divides Sulawesi and the Lesser Sundas from
                                                                    2015). The continental Sunda Shelf was repeatedly
Sundaland (Wallace, 1869). Huxley’s line separates
                                                                    inundated when polar ice-sheets melted during warm
Sundaland and the oceanic islands of the Philippines,
                                                                    Pleistocene periods, with the resulting rise of sea
                                                                    levels isolating the land masses periodically since
*Corresponding authors. E-mail: arlo@ebd.csic.es; JLeonard@         about 400 thousand years ago (kya) (Husson et al.,
ebd.csic.es                                                         2020). Interestingly, recent studies on mammals

© 2021 The Linnean Society of London, Zoological Journal of the Linnean Society, 2021, XX, 1–24                                1
This is an Open Access article distributed under the terms of the Creative Commons Attribution-NonCommercial License
(http://creativecommons.org/licenses/by-nc/4.0/), which permits non-commercial re-use, distribution, and reproduction in any
medium, provided the original work is properly cited. For commercial re-use, please contact journals.permissions@oup.com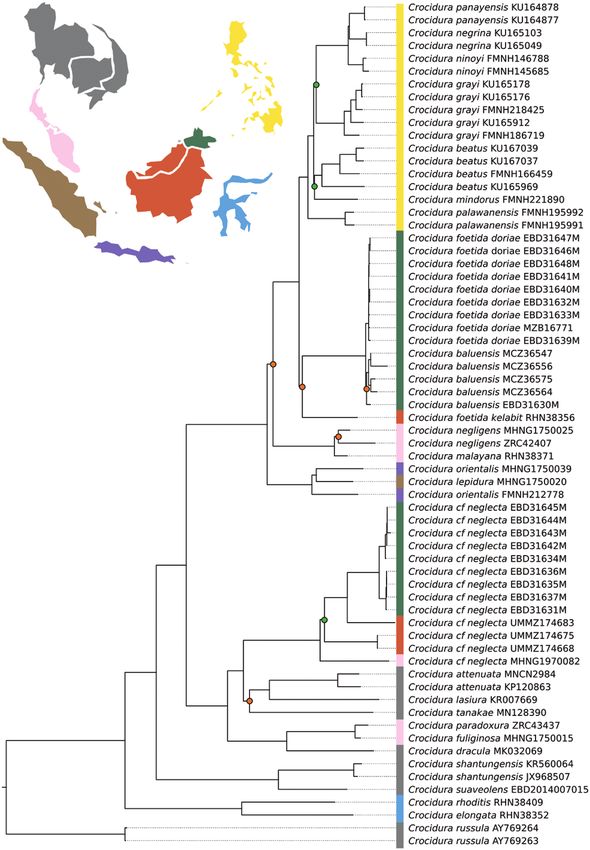
2   A. HINCKLEY ET AL.

                                                                                                                                 Downloaded from https://academic.oup.com/zoolinnean/advance-article/doi/10.1093/zoolinnean/zlab045/6327494 by guest on 24 September 2021
Figure 1. Map of tropical east Asia indicating biogeographic regions and sample localities in this study.

have found that populations on different landmasses             of low effective population sizes (ESS), increasing the
diverged during the Miocene and Pliocene, long before           intensity of genetic drift (Després, 2019; Mason et al.,
the shelf was first inundated, and so are too ancient           2019). Further, island populations experience greater
to be explained by the Pleistocene pump hypothesis              rates of extinction relative to continental ones, even
(Den Tex et al., 2010; Roberts et al., 2011; Mason              for small vertebrates in Sundaland (Heaney, 1984;
et al., 2019; Hinckley et al., 2020). Ecological isolation      Den Tex et al., 2010) so colonization or re-colonization
driven by open terrestrial habitats, such as grassland,         following local extinction could also have had an
swamp and/ or savanna, might have predated physical             important impact on biogeographical patterns
isolation by marine barriers (Cannon et al., 2009;              (Leonard et al., 2015). Incomplete taxonomy may
Slik et al., 2011). Alternatively, ancient divergences          obscure underlying patterns. This shortfall is more
could derive from rainforest refugia on or around               acute for smaller organisms, many of which have
mountains through the cooler and drier Oligocene and            narrow niches or restricted ranges (Riddle et al., 2011).
Pliocene (Sheldon et al., 2015). If isolation of these             An understanding of the species diversity is an
rainforest pockets was a main driver of diversification         important first step to a deeper understanding of
in Sundaland, it could also manifest between refugia            the evolution of biodiversity in this region. Unlike
within landmasses. The impact of these ancient                  other vertebrates, mammal species are generally
conditions will impact species differently, depending           distinguished by subtle morphological characteristics
on their habitat requirements and dispersal                     that hinder their proper taxonomic classification
capabilities (Mason et al., 2019; Cros et al., 2020; Lim        (Patterson, 2002). A particularly morphologically
et al., 2020). Forest specialists may have been subject         conserved group are shrews of the genus Crocidura
to more population fragmentation with longer periods            Wagler, 1832. This species-rich genus includes some

                               © 2021 The Linnean Society of London, Zoological Journal of the Linnean Society, 2021, XX, 1–24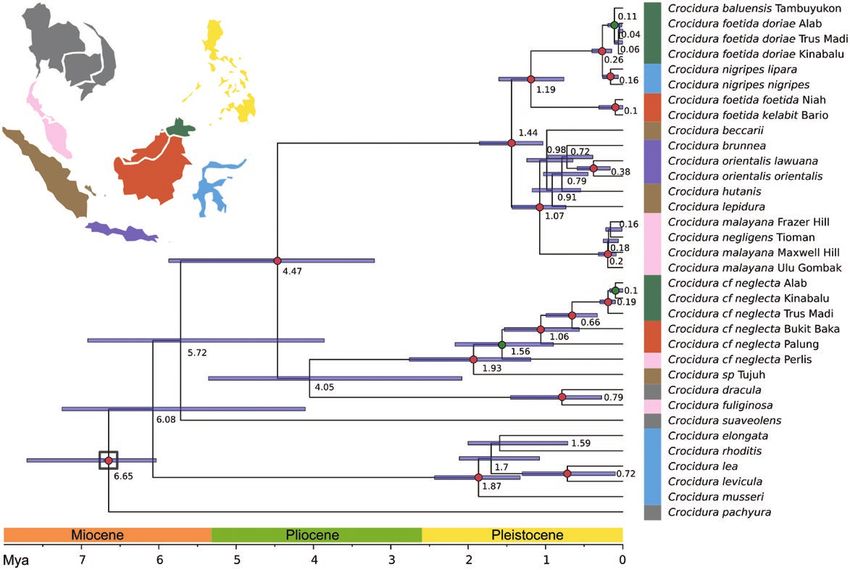
EVOLUTION OF SUNDALAND CROCIDURA                     3

widespread species and some narrow endemics                      times Crocidura has crossed the Isthmus of Kra has
(Burgin et al., 2018a). A combination of sampling from           not been addressed. However, a recent phylogeny could
new fieldwork and integrative taxonomy has recently              suggest multiple colonization events (Chen et al., 2020)
increased the number of species in this genus in                 from Indochina to Sundaland. Due to sparse geographic
tropical east Asia, both through splitting widespread            datasets and lack of appropriate genetic markers, the
species into multiple geographically restricted ones             timing of the crossings across biogeographic limits of

                                                                                                                              Downloaded from https://academic.oup.com/zoolinnean/advance-article/doi/10.1093/zoolinnean/zlab045/6327494 by guest on 24 September 2021
and the discovery of de novo species (Ruedi, 1995;               Sundaland are poorly understood.
Jenkins et al., 2007; Abramov et al., 2008; Jenkins                 In this study, we use molecular genetic data from all
et al., 2009; Esselstyn & Goodman, 2010; Jenkins                 recognized species of Crocidura of Sundaland, Sulawesi
et al., 2013; Esselstyn & Achmadi, 2014; Demos et al.,           and most of the Philippines, to construct a well-resolved
2017; Hutterer et al., 2018; Esselstyn et al., 2019;             dated phylogeny of the genus in this region. These
Chen et al., 2020; Yang et al., 2020). This progress is          results are placed into geographical context in order
not evenly distributed across the region, and Borneo             to compare the diversity and diversification of white-
has been notably absent in recent revisions.                     toothed shrews on the different major land masses
   Recently recognized or putative Crocidura species             and between them, with an emphasis on the species of
are generally restricted to a single habitat on a single         Borneo. Morphological data of the Bornean endemics
landmass in Sundaland (Esselstyn et al., 2013; Demos             C. foetida Peters, 1870 and C. baluensis Thomas, 1898
et al., 2016). Likewise, surprisingly high levels of             is integrated with genetic data in order to gain insight
divergence were found among two Sumatran peaks                   into the evolution of this lineage and assess the effect
separated by ~190 km and connected by continuous                 of elevation on phenotypic divergence.
montane or lower montane forest, which suggests an
important role of within-island diversification (Demos
et al., 2016). This pattern of high divergence between                                 Study system
highland taxa has also been found in other small                 Despite its old age, large size and geographic complexity
mammals on Sumatra (Den Tex et al., 2010; Achmadi                (Sheldon et al., 2015; Whittaker et al., 2017), only
et al., 2013; Camacho-Sanchez & Leonard, 2020;                   three Crocidura species are recognized on Borneo:
Hinckley et al., 2020) and Java (Demos et al., 2016). In         the widespread C. foetida and C. cf. neglecta Jentink
contrast to species-rich Sumatra and Java, with up to            1888, which are distributed across Borneo's lowlands
ten and 12 putative species of Crocidura, respectively           and hills Sundaland, respectively, and the narrow
(Demos et al., 2016), only four and three species are            highland endemic (C. baluensis). Species diversity
recognized on the Malay Peninsula and Borneo (Ruedi,             in other vertebrates, including small mammals, is
1995). However, these landmasses have been less                  frequently higher on Borneo than Sumatra (Roberts
sampled than Sumatra and Java (Ruedi, 1995; Omar                 et al., 2011; Achmadi et al., 2013; De Bruyn et al., 2014;
et al., 2013). In light of Demos et al.’s (2016) findings,       Hinckley et al., 2020). The high-elevation Kinabalu
it is possible that species diversity in Peninsular              shrew (C. baluensis) is thought to be restricted to the
Malaysia and Borneo are also underestimated.                     higher slopes of Mt. Kinabalu (4095 m), and perhaps to
   Crocidura is also interesting from a biogeographic            other nearby high mountains (Ruedi, 1995). This species
perspective, since it is one of few small mammal genera          shows strong morphological resemblance to Sumatran
distributed across the biogeographic breaks of Wallace’s         highland C. lepidura Lyon, 1908 (Ruedi, 1995), mirroring
and Huxley’s Lines, and the Isthmus of Kra, representing         the pattern of morphological convergence observed in
a rare opportunity to simultaneously compare the                 Rattus baluensis Thomas, 1894 (Mt. Kinabalu, Borneo)
permeability of all three Sundaland boundaries. All              and Rattus korinchi Robinson & Kloss, 1916 (Sumatra)
Crocidura shrews from Sulawesi are endemic and                   (Musser, 1986). Merckx et al., (2015) showed that Mt.
diversified in a single radiation, except the black-footed       Kinabalu endemics are a mix of immigrant, pre-adapted
shrew (C. nigripes Miller & Hollister, 1921), thought to         lineages (eccentric endemics) and descendants from local,
be a more recent colonizer (Ruedi et al., 1998; Esselstyn        lowland ancestors (centric endemics). Recently, Camacho-
et al., 2019). However, an increased gene sampling and           Sanchez & Leonard (2020) have shown that the origin of
geographic coverage across Borneo is needed to elucidate         the Bornean endemic R. baluensis is recent and its genetic
if its ancestor colonized Sulawesi from the Philippines          diversity is nested within the diversity of local lowland
or Borneo (Demos et al., 2016). Huxley’s line seems to           R. tiomanicus Miller, 1900. However, other Bornean
have been crossed a single time by Crocidura when                mountain endemic mammals are highly divergent
they colonized the Philippines. Such colonization is             from their lowland sister-taxa (e.g. Sundasciurus
thought to have been mediated through Palawan, which             everetti Thomas, 1890, Hawkins et al., 2016b; Tupaia
served as a biogeographic bridge from the Sunda Shelf            montana Thomas, 1892 Roberts et al 2011).
islands to the oceanic Philippine islands (Esselstyn                The Bornean shrew (C. foetida) is assumed to
et al., 2010; Giarla & Esselstyn, 2015). The number of           be widespread throughout the island, since it has

© 2021 The Linnean Society of London, Zoological Journal of the Linnean Society, 2021, XX, 1–24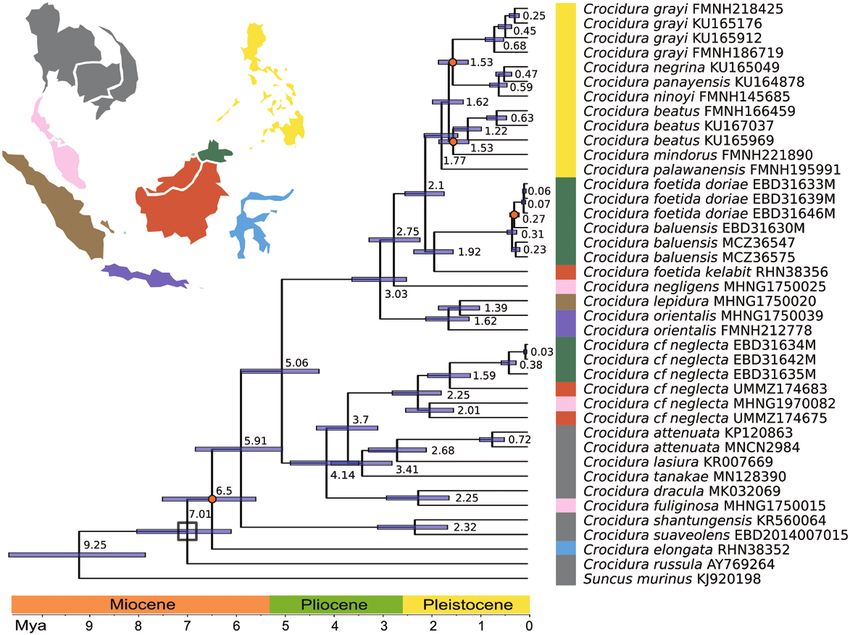
4   A. HINCKLEY ET AL.

been recorded in Sabah, Sarawak and east and west                 A similar scenario was found on Sumatra, where
Kalimantan from sea level to 1900 m a.s.l. (Burgin             Ruedi (1995) diagnosed six species, five of which
et al., 2018a; William-Dee, 2019). Three subspecies are        he considered endemic, including one he described
recognized. The nominal form was described from West           (C. hutanis Ruedi, 1995). While Demos et al. (2016)
Kalimantan and is potentially distributed throughout           recovered at least seven endemic species on Sumatra
the lowlands of west and central Borneo and perhaps            and a small neighbouring island (C. beccarii Dobson,

                                                                                                                                    Downloaded from https://academic.oup.com/zoolinnean/advance-article/doi/10.1093/zoolinnean/zlab045/6327494 by guest on 24 September 2021
also in the north; C. f. doriae was described from an          1887, C. hutanis, C. lepidura, C. neglecta Jentink,
unknown locality in Sarawak and is potentially                 1888, C. paradoxura, C. vosmaeri Jentink, 1888 and an
distributed throughout mountains of north Borneo (up           undescribed species, C. sp. nov. 2). In addition, species
to 1900 m a.s.l.); and C. f. kelabit, described from Bario     delimitation analyses also suggested additional
and restricted to the Kelabit Highlands (Ruedi, 1995;          potential species in the two lineages of C. paradoxura
Burgin et al., 2018a).                                         and C. beccarii, implying an increase of up to three
   The neglected shrew (C. cf. neglecta) from Borneo           species since Ruedi (1995).
was supported as a distinct species from C. neglecta on           Miller & Hollister (1921) described five species of
Sumatra in species delimitation analyses performed             Crocidura on Sulawesi. The next review of this genus,
by Demos et al. (2016). However, these analyses                involving extensive fieldwork (Ruedi, 1995), described
included only two specimens from Mt. Kinabalu and              one new species (C. musseri). Subsequently, Esselstyn
no intermediate populations between extreme north-             et al., (2019) described an additional one (C. caudipilosa),
east Borneo and Sumatra, which would be desirable              and suggested two additional undescribed species. These
to assess if this divergent lineage is distributed across      studies brought the final number of putative species
Borneo or if there is isolation by distance (Sukumaran         of Crocidura on Sulawesi to nine: C. caudipilosa, ‘pale
& Knowles, 2017; Mason et al., 2020).                          C. elongata Miller & Hollister, 1921’, ‘dark C. elongata‘,
   Four species of Crocidura are found on Peninsular           ‘pale C. lea Miller & Hollister, 1921’, ‘dark C. lea’, C. levicula
Malaysia, according to the latest systematic review            Miller & Hollister, 1921, C. musseri, C. nigripes Miller &
performed for this landmass (Ruedi, 1995). Two are             Hollister, 1921 and C. rhoditis Miller & Hollister, 1921. The
endemic (C. malayana Robinson & Kloss, 1911 and                Lesser Sundas also host two other species east of Wallace’s
C. negligens Robinson & Kloss, 1914); and two are              Line: C. maxi and C. tenuis Muller, 1840. The former is
thought to be widespread (Crocidura cf. neglecta               widespread and also present in east Java, while the latter
and C. fuliginosa Blyth, 1855). Recent sampling and            is endemic to Timor. An endemic and possibly extinct
genetic work suggest that both of these widespread             species, C. trichura Dobson, 1889 has been recorded from
species contain multiple, distinct lineages compatible         Christmas Island, around 350 km south of Java.
with multiple species (Bannikova et al., 2011; Omar               Many species of Crocidura in the political region
et al., 2013; Burgin et al., 2018a; Chen et al., 2020). The    of the Philippines were described in the last century:
occurrence of a fifth, long-tailed species in the higher       C. beatus Miller, 1910, C. grandis Miller, 1910, C. grayi
slopes of the Cameron Highlands, Peninsular Malaysia,          Dobson, 1890, C. mindorus Miller, 1910, C. negrina
has generated much taxonomic discussion. Different             Rabor, 1952, C. palawanensis Taylor, 1934. While others
authors have associated these long-tailed specimens            were described more recently: C. ninoyi Esselstyn &
with C. aequicauda Robinson & Kloss, 1918 (a junior            Goodman, 2010 and C. panayensis Hutterer, 2007. The
synonym of C. paradoxura Dobson, 1887; Burgin et al.,          Palawan endemic C. batakorum Hutterer, 2007 has
2018a), C. attenuata Milne-Edwards, 1870 (Robinson             been shown to be the only species not belonging to
& Kloss, 1918; Jenkins, 1976, 1982; Davison, 1984) or          the in situ Philippine radiation, besides peripherical
C. negligens (Ruedi, 1995). However, these specimens           C. tanakae present in Batan and Sabtang, two islands
have never been sequenced, so this population could            in between Taiwan and Luzon (Esselstyn & Oliveros,
also represent an undescribed highland endemic.                2010). In addition to C. batakorum, C. palawanensis is
   Demos et al. (2016, 2017) identified at least six           also endemic to Palawan, which is biogeographically
species on Java: C. abscondita Esselstyn et al.,               part of Sundaland. The species C. grandis has not
2014, C. brunnea Jentink, 1888, C. maxi Sody, 1936,            been recorded in over a century and its phylogenetic
C. monticola Peters, 1870, C. orientalis Weber, 1890 and       relationships are unknown (Giarla & Esselstyn, 2015).
C. umbra Demos et al., 2017, five of which are endemic.
Species delimitation coalescent analyses supported
six additional lineages on Java that may represent                          MATERIAL AND METHODS
distinct species: three lineages in C. brunnea, four in
C. monticola and two in C. orientalis. This represents                                   Material
a remarkable increase from three to nine species since         Molecular sampling of all recognized extant species
the previous taxonomic review (Ruedi, 1995).                   of Sundaland and Sulawesi Crocidura, and most from

                              © 2021 The Linnean Society of London, Zoological Journal of the Linnean Society, 2021, XX, 1–24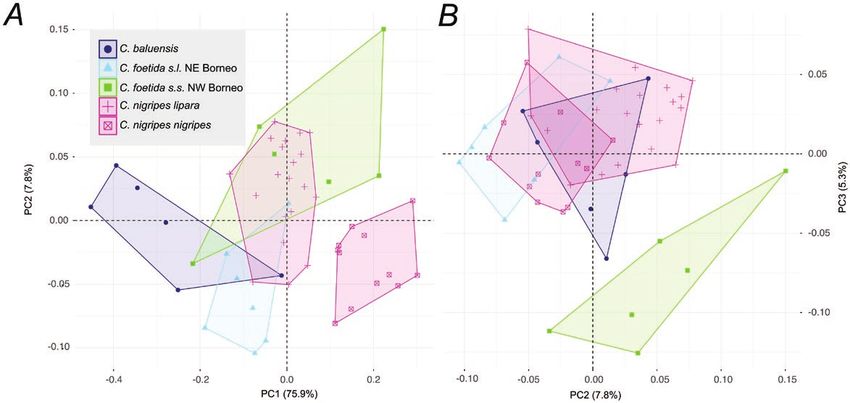
EVOLUTION OF SUNDALAND CROCIDURA                  5

the Lesser Sunda Islands, Philippines and Indochina              prepared as in Camacho-Sanchez et al. (2017), while
(Fig. 1), was achieved through a combination of                  historic ones followed the protocol described in Carøe
fieldwork, historic museum specimens and sequences               et al. (2018). These libraries were quantified with a
deposited in GenBank. Specimens were identified                  Qubit fluorometer or qPCR with Illumina Truseq dual
based on their morphology and distributions following            indexes prior to equimolar pooling and sequencing.
Ruedi (1995). Our fieldwork, together with tissue                   Polymerase chain reaction (PCR) conditions are

                                                                                                                           Downloaded from https://academic.oup.com/zoolinnean/advance-article/doi/10.1093/zoolinnean/zlab045/6327494 by guest on 24 September 2021
loans from American Museum of Natural History                    shown in Supporting Information, Table S2. In
(AMNH), Estación Biológica de Doñana-CSIC (EBD)                  addition, we designed a set of internal primers for
and A. Gorog, yielded 94 modern samples. Additionally,           four of these markers (GHR10, 103 bp; BDNF, 174 bp;
we obtained 15 tissue samples from historic specimens            BRCA, 100 bp; and vWF1, 129 bp) to amplify variable
housed in five different museums: Lee Kong Chian                 areas within these loci from the highly-fragmented
Museum (LKC), Museum of Comparative Zoology of                   historic DNA. GHR10 and BDNF were multiplexed,
Harvard (MCZ), Museo Nacional de Ciencias Naturales              while BRCA and vWF1, which have degenerate bases
(MNCN), Thailand National History Museum (TNHM)                  and a tendency to generate dimers, were amplified in
and Museum für Naturkunde (ZMB). In total, 109                   single reactions (Supporting Information, Table S2).
samples were included (Supporting Information, Table             Three replicate PCRs were run per sample in order
S1). Data from another 563 samples of 93 species/                to identify apparent mutations caused by damage
putative species was downloaded from GenBank                     or degradation of the DNA. All primers used in this
for comparison (Supporting Information, Table S1).               study were designed with a tail to add barcodes and
Samples were collected according to the guidelines of            sequencing primers in a second round PCR (Supporting
the American Society of Mammalogists (Sikes et al.,              Information, Table S2).
2016). Animal care and use committees approved                      Polymerase chain reaction (PCR) products were
protocols, sampling and field research permits for the           run on a 2% agarose gel viewed with BIO-RAD Image
different campaigns are specified in Ruedi (1995) and            LabTM software (Bio-Rad Laboratories) for relative
as approved by Sabah Parks (TS/PTD/5/4 Jld. 45 (33),             quantification of PCR products for equimolar pooling.
TS/PTD/5/4 Jld. 47 (25)), the Economic Planning Unit             Following this step, samples were indexed with a
(100–24/1/299), Sabah Wildlife Department (JHL:                  unique combination of forward and reverse barcodes.
(HQ):100–42/ 1 JLD.27) and the Sabah Biodiversity                Dual-indexed shotgun libraries were sequenced on
Council (Ref:TK/PP:8/8Jld.2).                                    Illumina HiSeq 2000 or NovaSeq machines at the
                                                                 Genetic Resources Core Facility (GRCF) at Johns
                                                                 Hopkins University (Baltimore, Maryland, USA).
                 Molecular methods                               Amplicon libraries were sequenced on a MiSeq at the
We targeted 13 nuclear loci previously found to be               same facility.
single copy in the genome and informative in soricid
(Esselstyn et al., 2013, Igea et al., 2015, Demos
                                                                                 Bioinformatic methods
et al., 2016) or eutherian phylogenies (Supporting
Information, Table S2; Jiang et al., 1998, Murphy                Preprocessing
et al., 2001, Housley et al., 2006). Eight markers were          Adaptor removal and quality trimming was performed
amplified in single reactions: six exons ApoB (549 bp),          with Trimmomatic (Bolger et al., 2014) with the sliding
BRCA1 (579 bp), GHR10 (561 bp), PTGER4 (471 bp),                 window parameter set to 5:20, read minimum length
RAG2 (444 bp) and vWF1 (656 bp); and two introns                 parameter to 50 bp (Hiseq modern sample libraries) or
PRPF31 (481 bp) and HIF1AN (389 bp). Five other                  30 bp (Novaseq modern and historic sample libraries)
markers were amplified in multiplexed PCR reactions,             and leading and trailing to 5 bp. Single quality scans
including one intron (HAT1, 497 bp), one exon (BDNF,             were run on the raw fastq files before and after
396 bp), and three intron + exon (GBG, 376 bp; DVL1,             trimming with FastQC (Andrews, 2010), and viewed
402 bp, and POU2F2, 341 bp). In addition, whole                  with MultiQC (Ewels et al., 2016) enabling global
mitochondrial genomes were targeted for a subset of              trends and biases to be quickly identified.
species that had not been previously sequenced.
   DNA was extracted using phenol-chloroform
and purified with an ethanol precipitation. Amicon               Mitochondrial genomes
Ultra 0.5 mL filters were used instead of ethanol                Quality trimmed reads were mapped to two reference
precipitation to purify extracts from historic samples.          mitochondrial genomes (Crocidura attenuata
Museum samples were processed in an isolated ancient             NC026204 or Crocidura palawanensis NC027243)
DNA laboratory following strict protocols to control for         with BWA-MEM algorithm (Li, 2013) or with
contamination. Modern sample shotgun libraries were              Geneious Mapper iterative algorithm for up to five

© 2021 The Linnean Society of London, Zoological Journal of the Linnean Society, 2021, XX, 1–24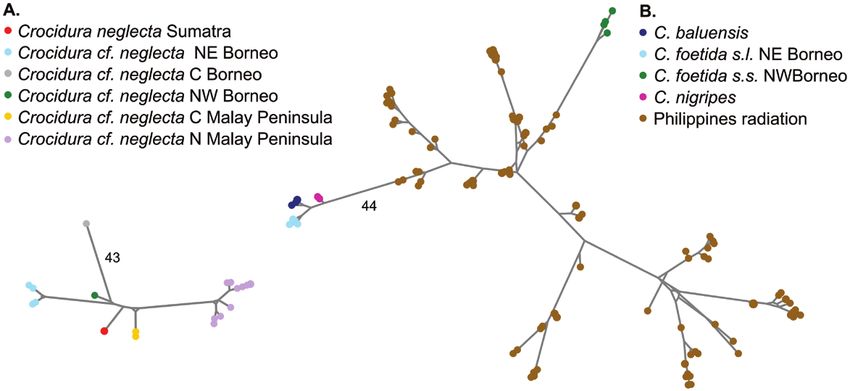
6   A. HINCKLEY ET AL.

iterations and medium-low sensitivity. The output                 sizes exceeded the read length for six loci, leaving
of BWA was converted to BAM files with SAMtools                   missing data in the centre of those sequences: ApoB
(Li et al., 2009). These were later sorted, merged and            (40bp), BRCA1 (83bp), GHR10 (50bp), HAT1 (48bp),
PCR duplicates removed. Finally, BAM files were                   HF1AN (18bp) and vWF (211bp), which were trimmed.
imported to GENEIOUS 11.0.5, where consensus                      Finally, a poorly aligned region of 22 bp with a high
sequences were called with minimum 2x and 75%                     occurrence of indels was trimmed from DVL1.

                                                                                                                                  Downloaded from https://academic.oup.com/zoolinnean/advance-article/doi/10.1093/zoolinnean/zlab045/6327494 by guest on 24 September 2021
thresholds. Duplicates were removed from libraries                   All nuclear sequences were resolved into statistically
mapped in GENEIOUS with the Dedupe plugin                         probable haplotypes using PHASE 2.1.1 (Stephens
of the BBTools package v.35.82 (Bushnell, 2014).                  et al., 2001) with an acceptance threshold of 0.70.
An alignment of our sequences with all Soricidae                  This threshold has been shown to be optimal, given
mitochondrial genomes available in GenBank                        that it decreases the number of unresolved genotypes
(Supporting Information, Table S1) was made using                 with little to no increase in false-positives (Garrick
the MAFFT v.7.450 GENEIOUS 11.0.5 plugin                          et al., 2010; Demos et al., 2016). The online application
(Katoh & Standley, 2013) under default parameters.                SeqPHASE (Flot, 2010) was used to convert FASTA
The control region was removed from mitogenome                    files to PHASE input files, as well as to convert
assemblies because it was poorly assembled in many                PHASE output back to FASTA format. Genotypes that
historic samples and has been shown to provide                    were still unresolved following PHASE were phased
low phylogenetic resolution and overestimation of                 manually based on the original BAM alignment
divergence times (Duchêne et al., 2011). Poorly aligned           (Hinckley et al., 2020). Heterozygous sites were only
regions in rRNAs and tRNAs were trimmed with                      called in historic samples when present in at least two
TrimAl to increase phylogenetic inference accuracy                of the three PCR replicates.
(Capella-Gutierrez et al., 2009). Positions with gaps
in more than 10% of the sequences (708 bp in total)
were removed, leaving a final alignment of 15 360 bp.             Phylogenetic analyses and divergence dating
NADH dehydrogenase subunit 6 is present on the                    Analyses were conducted on the following four datasets:
light strand and was thereby reverse complemented.                (1) a Cytb dataset, including all recognized species of
Protein-coding regions were translated and inspected              Sundaland and Sulawesi Crocidura (cytbDNA); (2)
for frameshift mutations and for the presence of                  13 nuclear loci from the main landmasses, but not all
unexpected stop codons. Summary statistics of the                 species (nDNA13); (3) a subset of six nuclear loci (ApoB,
alignment were computed with AMAS (Borowiec,                      BDNF, BRCA1, GHR10, PTGER4 and vWF), including
2016; Supporting Information, Table S1). Sample                   all recognized species of Sundaland and Sulawesi
MNCN2979 was removed from the alignment due to                    Crocidura, and most of Philippine species (nDNA6);
suspicion of contamination during DNA extraction                  and (4) mitochondrial genome dataset, including
and the presence of spurious reads.                               Malay Peninsula, Bornean and Philippine species and
                                                                  a reduced subset of other Sundaland/Sulawesi taxa
                                                                  and outgroups for divergence dating (mitoDNA).
Genotyping of nuclear data                                          The optimal partitioning scheme for each dataset,
For nuclear sequences, we imported the trimmed reads              and substitution models for both mitochondrial
to GENEIOUS 11.0.5 and mapped these to the closest                maximum-likelihood analyses, were selected
homologous sequences found in GenBank (Crocidura                  with ModelFinder (Kalyaanamoorthy et al., 2017;
elongata: KY771390, KY771390, KX470110, KY771782,                 Supporting Information, File S3). The number of initial
KY772103, K Y 7 7 2 4 1 1 ; C r o c id u r a fu li g i n o sa :   partitions for mitoDNA was 53, while for cytbDNA,
GU981450; Crocidura russula (Hermann, 1780):                      nDNA6 and nDNA13 protein-coding genes we input
LK936959, LK936967; Sorex araneus Linnaeus, 1758:                 three codon positions (Supporting Information, File
NW_004545858, NW_004546023, NW_004545881;                         S3). We followed a free rate model algorithm with up to
Condylura cristata (Linnaeus, 1758): NW_004567156)                ten gamma categories for IQTREE analysis (cytbDNA
with Geneious Mapper, low-medium sensitivity and                  and mitoDNA), and without free rate for BEAST
up to five iterations. We called consensus sequences              (mitoDNA and nDNA13) analyses, BIC criteria and
in GENEIOUS with a minimum 5x coverage and                        relaxed clustering of 10%. To save computations,
75% consensus threshold. Each locus was aligned                   only the top 10% partition schemes were considered
independently with MAFFT v.7.450 GENEIOUS                         for searching the best-fit partitioning scheme and
plugin automatic algorithm (Katoh & Standley,                     substitution models. The best-fit partitioning scheme
2013) under default parameters. We translated exon                was the exact same seven partitions in both runs for
alignments to amino acids and inspected them for                  mitoDNA, three partitions in Cytb and a single partition
insertions, deletions and premature stop codons to                per nuclear locus (Supporting Information, File S3).
prevent inclusion of paralogous sequences. Amplicon               For the mitoDNA dataset we performed a likelihood

                                © 2021 The Linnean Society of London, Zoological Journal of the Linnean Society, 2021, XX, 1–24
EVOLUTION OF SUNDALAND CROCIDURA 7
ratio test (LRT) with MEGA 7 (Kumar et al., 2016) to population size integration model. We removed from
test the clock-like behaviour of the sequences, and a the initial mitoDNA alignment 8 sequences with more
strict molecular clock was rejected. Given the higher than 30% missing data, resulting in 83 sequences. As in
evolutionary rate of the mitochondrial sequences, Demos et al. (2016), for Sundaland/Sulawesi species for
we tested for saturation by plotting transitions and which samples from more than one disjunct population
transversions of each alignment partition against exist, each population was considered a terminal taxon
Downloaded from https://academic.oup.com/zoolinnean/advance-article/doi/10.1093/zoolinnean/zlab045/6327494 by guest on 24 September 2021
each other and against raw/uncorrected pairwise resulting in 66 and 34 tips in mitoDNA and nDNA13,
genetic distances with the dist.dna function from ape respectively. Two independent runs of Markov chains
(Paradis & Schliep, 2019) in R. We also performed Xia (MCMC) for Monte Carlo simulations were run for
substitution saturation tests in Dambe 7 (Xia, 2018) 50 000 000 (mitoDNA) and 250 000 000 generations
for each partition as a complementary line of evidence. (nDNA13), with parameters and trees sampled every
The results were consistent between both approaches, 5000 generations. Convergence was checked using
five partitions containing third-codon positions of TRACER 1.7.1 (Rambaut et al., 2018). For each run,
protein-coding genes showed high levels of saturation the first 20% of sampled trees were discarded as
and were excluded, leaving two partitions of 3715 and burn-in. Two dating constraints were used to calibrate
7864 bp for downstream divergence dating analyses the mitoDNA phylogeny following previous Soricidae
(Supporting Information, File S3). We conducted studies (Jacquet et al., 2015; Bover et al., 2018; Hutterer
phylogenetic inference through a maximum-likelihood et al., 2018; Chen et al., 2020): (1) the split between
framework with IQTREE (Nguyen et al., 2015) on Soricinae and Crocidurinae–Myosoricinae, estimated
the cytbDNA and mitoDNA datasets. We selected to have occurred about 20 Mya (Reumer, 1989; normal:
an Edge-linked partition model with proportional mean = 20 Mya, standard deviation [SD]= 1), and (2)
branch lengths, and free rate model algorithm the oldest Crocidura fossil (C. kapsominensis), dated
(Supporting Information, File S3). We included the to 6 Mya (Mein & Pickford, 2006; lognormal: mean = 0,
Western Palaearctic Crocidura russula as an outgroup stdve = 1, offset = 6 Mya). Both constraints were set
in these analyses. Majority rule consensus trees were using hard minimum bounds and soft upper bounds,
generated from each analysis. using a lognormal prior, as suggested by Parham et al.
Divergence times and a species tree were estimated (2012). For the nDNA13 phylogeny, only calibration (2)
with mitoDNA and nDNA13 datasets in BEAST2 and could be applied. Maximum credibility consensus trees
*BEAST2 (Bouckaert et al., 2014). The mitochondrial were generated from each analysis.
genome alignment was split into the best partition We estimated an additional species tree in *BEAST
schemes, as identified by ModelFinder with AMAS 2.1.1 for the nDNA6 dataset. We followed Demos et al.
(Borowiec, 2016). We performed site modelling through (2016) and assigned samples from separate localities
a Bayesian approach with bmodeltest (Bouckaert & as terminal taxa, resulting in 72 tips. For this six-
Drummond, 2017), with empirical frequencies, and gene analysis the loci were reduced to between three
time-reversible models for mitoDNA or transition- and seven sequences per lineage to keep analyses
transversion split for nDNA13, given that none of the tractable and facilitate convergence (Demos et al.,
ModelFinder tests for this dataset had supported GTR 2016). We unlinked substitution models and trees, but
models. Following MEGA7 LRT tests, a lognormal linked clock models among partitions. We performed
(uncorrelated) relaxed clock was selected for mitoDNA, simultaneously site model averaging and phylogenetic
so partition site and clock models were unlinked, but only inference with bmodeltest, selecting mutation rate
clock rates were estimated. For nDNA13, a shared strict estimation transition-transversion split and empirical
clock with unlinked and estimated substitution rates frequencies priors. We followed an analytical population
was assumed after testing the performance of shared size integration model, birth–death speciation prior
or unlinked relaxed clocks. Poor convergence regarding and assumed a strict clock for the same reasons as
branch rate standard deviation (unlinked relaxed clock) in nDNA13. Three independent runs were conducted
or a branch rate standard deviation close to 0 (linked for 300 000 000 generations Markov chains (MCMC)
relaxed clock) suggested that rate variation among the for Monte Carlo simulations, with parameters and
different branches was small and that a strict clock was trees sampled every 5000 generations. These runs
more appropriate (Bromham et al., 2018). A birth–death were assessed for convergence with TRACER v.1.7.1
process was specified in both analyses given that there (Rambaut et al., 2018). Maximum credibility consensus
is evidence for extinction due to the inclusion of extinct trees were generated from each analysis.
species in the tree (Nesiotites hidalgo Bate, 1945) or
fossil calibrations (C. kapsominensis Mein & Pickford,
2006). We kept default operators and linked tree priors Private alleles and species delimitation
for the mitoDNA dataset, but kept these unlinked Species delimitation was performed based on
for the nDNA13 dataset and followed an analytical mutual allelic exclusivity through haplowebs
© 2021 The Linnean Society of London, Zoological Journal of the Linnean Society, 2021, XX, 1–248 A. HINCKLEY ET AL.
and conspecificity matrices, as implemented in (Supporting Information, Table S3). The types of
HaplowebMaker and CoMa web tools (Spöri & C. foetida foetida and C. foetida doriae (Supporting
Flot, 2020). We considered two separate datasets of Information, Table S1) that are hosted in Berlin could
Bornean lineages: the C. neglecta complex, and the not be measured due to travel restrictions during the
clade including C. foetida, C. baluensis and C. nigripes. Coronavirus pandemic. Bivariate plots of craniodental
Given that the haploweb approximation operates on variables were constructed based on the output of
Downloaded from https://academic.oup.com/zoolinnean/advance-article/doi/10.1093/zoolinnean/zlab045/6327494 by guest on 24 September 2021
a single locus at a time, we followed a ‘conspecificity the principal component analysis (PCA). In addition,
matrix’ approach to combine the delimitations greatest skull length measurements and hair length
produced by the 13 nuclear markers and turn them [as in Musser et al. (2010)] were collected by MM,
into a single graphical output revealing the various MTRH and AH from the series hosted at MCZ, USNM
hypothetical species present in the dataset. A median and EBD to test size and fur variation across an
joining network algorithm was selected, with indels elevational gradient.
treated as a fifth state and columns with missing data
masked. Haploid cytochrome b sequences were run
separately with Haplowebmaker. GenBank sequences Morphometric statistical analyses
from the Philippine species were also included in the Principal component analysis. We log-transformed
C. foetida, C. baluensis and C. nigripes analysis and each measurement prior to computing the principal
C. neglecta from Sumatra for the second dataset. component analysis (PCA) so that the data was
Given that ApoB did not amplify in many samples of analysed on the basis of correlations instead of
the C. neglecta complex, this locus was excluded for covariances. Principal component analysis was
these analyses. Sample EBD31648M was excluded implemented by the prcomp command in R (R Core
from the C. foetida analysis because it had data for Team, 2018). Results were extracted and visualized
three loci; RHN38354 was excluded from PTGER and with the following functions of the factoextra package
BRCA networks given the high proportion of missing (Kassambara & Mundt, 2017): fviz_pca_ind, plots
data; and EBD31634M, EBD31643M, EBD31644M, PCA results; fviz_pca_biplot, biplot of individuals
MHNG1970.082, JX162658 and UMMZ174675 were and variables; get_eigenvalue, extracts eigenvalues,
excluded from the Cytb C. neglecta network for the variance percentage and cumulative variance
same reason. percentage; get_pca_var, outputs each variable’s
contribution to variance.
Morphological data collection Phenotypic discrimination across elevation in the clade
The specimens examined here (Supporting Crocidura baluensis/C. foetida s.l. from Sabah. On Mt.
Information, Table S3) are housed in the following Kinabalu, C. foetida has been described as distributed
natural history collections: Natural History Museum, from lowlands up to about 1500–1600 m a.s.l., where it
London, United Kingdom (BMNH); Estación Biológica is replaced by Crocidura baluensis. Current taxonomy
de Doñana, Seville, Spain (EBD); Museum d’Histoire discriminates these species based on size and external
Naturelle, Geneva, Switzerland (MHNG); Museum of morphological features (tail scale conspicuousness,
Comparative Zoology, Harvard University, Cambridge, proximal bristles in tail, relative hindfoot size and
Massachusetts (MCZ); Naturalis Biodiversity Center, length of dorsal fur) (Thomas, 1898; Ruedi, 1995). We
Leiden, The Netherlands (RHN); and National collected skull and external measurements (GGLS,
Museum of Natural History, Smithsonian Institution, greatest length of skull; tail; HF, hind foot) from adult
Washington, DC, United States (USNM). Dental specimens of C. baluensis and C. foetida from Sabah.
eruption and wear patterns, and fusion of the Sex was recorded based on label information/gonad
basisphenoid–basioccipital sutures were checked examination and age was determined based on fusion
to age each specimen. Only adults were included of cranial sutures. Only animals that had information
in the morphometric analyses. Fourteen cranial on elevation were considered, leaving a total of five
measurements were taken with electronic digital individuals of C. baluensis and 28 of C. foetida for the
callipers to the nearest 0.01 mm by MR (Supporting analysis (Supporting Information, Table S3). The effect
Information, Table S3). Skull measurements were taken of elevation was tested on each morphological trait
as defined in Ruedi (1995). External measurements, with linear models. We included GGLS in the models
head–body length (HB), tail (T), hindfoot (HF), ear to control for size on the change of HF, HB and tail, and
(E) and weight (W), were taken from specimen labels sex to control for potential dimorphism. We also used
or in the field (Supporting Information, Table S3). linear models to assess the relation of hair length with
We examined and measured the types of C. nigripes, elevation. Models are available at https://github.com/
C. nigripes lipara, C. foetida kelabit and C. baluensis csmiguel/crocidura-borneo.
© 2021 The Linnean Society of London, Zoological Journal of the Linnean Society, 2021, XX, 1–24EVOLUTION OF SUNDALAND CROCIDURA 9
RESULTS The species in the biogeographic region of the
Philippines were monophyletic, while Wallacea
Phylogenetic analyses
(Sulawesi and the Lesser Sundas), Sundaland and
Whole mitochondrial genomes were constructed from Indochina Crocidura were not (Fig. 1). The two
41 individuals, generating an alignment (without crossings of Wallace’s Line were estimated at 6.5/6.0
control region) of 15 360 bp for 65 ingroup sequences Mya for the ancestor lineage of the Sulawesi radiation
Downloaded from https://academic.oup.com/zoolinnean/advance-article/doi/10.1093/zoolinnean/zlab045/6327494 by guest on 24 September 2021
(including some GenBank sequences), with 4487 (mitoDNA/nDNA13) and 0.26 Mya for C. nigripes
parsimony informative sites used for IQTREE (nDNA13). The phylogeny shows that the ancestor of
analyses. This mitogenome matrix had 10.6% missing C. nigripes colonized Sulawesi from Borneo, not the
data. A subset of 11 579 bp and 2720 parsimony Philippines. The radiation in Sulawesi started in the
informative sites with 38 ingroup taxa but only Early Pleistocene around 1.87 Mya (95% HPD: 1.33–
1.5% missing data was used for the BEAST analysis 2.44; nDNA13), after Sulawesi took on its modern
(Supporting Information, Table S1). Missing data form. Divergences within the Sulawesi clade were deep
were mostly restricted to 11 sequences (MCZ36556, in comparison with the oceanic Philippine radiation,
MCZ36564, ZRC.4.2407, ZRC.4.3437, EBD31640, which was also highly supported as monophyletic
EBD31643-44M, UMMZ174668, MZB16771, (Giarla & Esselstyn, 2015).
RHN38371 and RHN38409; Supporting Information, Within peninsular Malaysia, C. negligens was nested
Table S1). Thirteen nuclear loci were sequenced from within the diversity of C. malayana with high support
34 individuals (Supporting Information, Table S1). (Figs 2, 4). Two reported specimens of C. paradoxura
Primers designed for a subset of four of the nuclear from this landmass (ZRC.4.3436 and ZRC.4.3437)
loci to amplify from historic samples worked best were identified as C. fuliginosa (Supporting
for those with a higher amount of DNA, which also Information, Table S1), suggesting that C. paradoxura
yielded better mitogenome assemblies (Supporting might not be present on peninsular Malaysia. The
Information, Table S1). Newly generated sequences relationships of the populations currently referred
were deposited in GenBank (GenBank accession to as C. cf. neglecta are not clear. The individual from
numbers: MW760882–MW762425 for nuclear loci, and Perlis (MHNG1970.082) was sister to the NW Borneo
MW815405–MW815431 for mitochondrial genomes; population (UMMZ174675) in the mitochondrial
Supporting Information, Table S1). All sequence phylogenies with high support (Figs 2, 3), but sister to
alignments used in this study analyses are available all other populations in nuclear phylogenies with less
at Supporting Information, File S2. support (Fig. 4, PP = 0.81–0.89).
Bayesian and maximum-likelihood phylogenies Within Sumatra, the undescribed species Crocidura
yielded generally consistent topologies regardless of sp. nov. 2 from Mt. Singgalang (Demos et al., 2016) is
dataset (cytbDNA, Supporting information, Fig. S1; found to be sister to a highly divergent lineage from
mitoDNA, Figs 2, 3; nDNA6, Supporting information, Mt. Tujuh (Supporting Information, File S1, Figs S1,
Fig. S2; nDNA13, Fig. 4), although there were some S2), and was previously classified as C. paradoxura
differences in the relationships within the C. cf. neglecta based on morphological resemblance (MZB16790,
group and for the monophyly of Javan C. orientalis. Ruedi, 1995).
The larger datasets (whole mitochondria vs. Cytb or Within Borneo, the species Crocidura foetida was
13 nuclear loci vs. 6) yielded phylogenies with higher paraphyletic due to the inclusion of C. nigripes (Fig. 4;
branch support, especially for short and long branches. Supporting Information, File S1, Fig. S1), C. baluensis
Divergence dates for deep nodes were similar on the (Figs 2–4; Supporting Information, File S1, Figs S1,
mitochondrial and nuclear phylogenies, but were S2) and perhaps but less likely, also the Philippine
generally estimated as older for more recent nodes on Crocidura clade (Figs 2, 3; Supporting Information,
the mitochondrial tree (Fig. 3), than on the phylogeny File S1, Figs S1, S2). North-East Borneo C. foetida
based on nuclear data (Fig. 4). This is expected, given doriae and C. baluensis populations were reciprocally
that gene divergence generally occurs prior to species monophyletic but showed a shallow divergence (Figs
divergence and, therefore, mitogenome divergences 2–4). These two taxa were sister to C. nigripes (Fig.
are usually overestimated with regard to species tree 4; Supporting Information, File S1, Fig. S1) and
divergences, especially for recent divergence events this clade was sister to north-central/west Borneo
(Edwards & Beerli, 2000; Carstens & Knowles 2007; C. foetida foetida and C. foetida kelabit with high
McCormack et al., 2011). The time to the most recent support (Figs 2–4). Relationships within this clade,
common ancestor (TMRCA) of Asian Crocidura was based on the nDNA6 data, were poorly supported,
estimated at 6.5 (95% HPD: 5.60–7.53; mitoDNA) possibly due to a lack of variation of these markers
and 6.1 (95% HPD: 4.11–7.25; nDNA13) million years at such a shallow scale of divergence. North-eastern
ago (Mya), which is consistent with previous studies Borneo lowland populations of C. foetida s.l. and
suggesting a Late Miocene origin (Chen et al., 2020). highland parapatric C. baluensis diverged recently
© 2021 The Linnean Society of London, Zoological Journal of the Linnean Society, 2021, XX, 1–2410 A. HINCKLEY ET AL.
Downloaded from https://academic.oup.com/zoolinnean/advance-article/doi/10.1093/zoolinnean/zlab045/6327494 by guest on 24 September 2021
Figure 2. Mitochondrial genome maximum-likelihood consensus phylogeny of tropical east Asia Crocidura. Reconstructed
with IQTREE. Since most nodes are highly supported [ultrafast bootstrap (UFBP) > 0.95], only less supported nodes are
marked (orange circle, 0.95 < UFBP > 0.80; green circle, UFBP < 0.80). Colours on the vertical bar indicate geographical
origin of sampled animals, and colours match the map. Samples from north of the Isthmus of Kra are shown in grey.
© 2021 The Linnean Society of London, Zoological Journal of the Linnean Society, 2021, XX, 1–24EVOLUTION OF SUNDALAND CROCIDURA 11
Downloaded from https://academic.oup.com/zoolinnean/advance-article/doi/10.1093/zoolinnean/zlab045/6327494 by guest on 24 September 2021
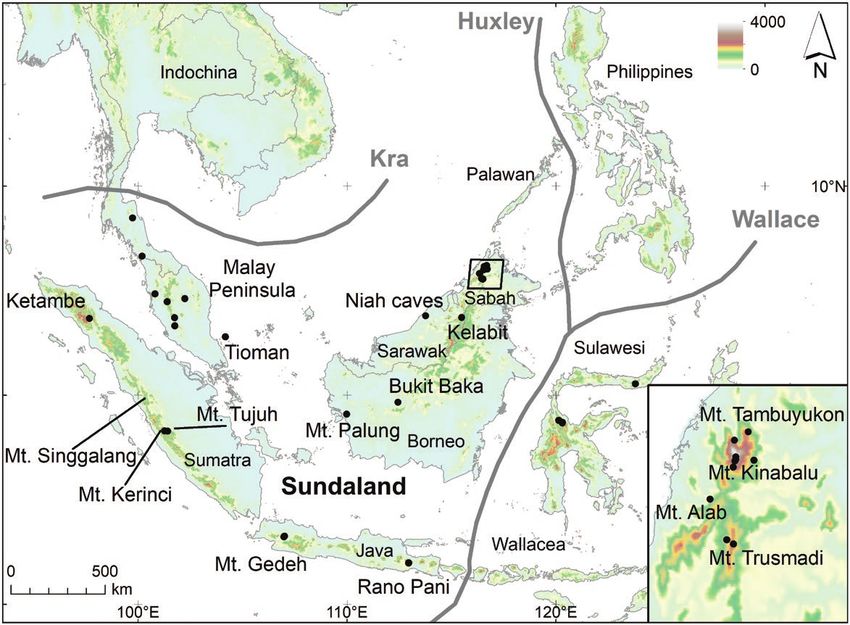
Figure 3. Bayesian maximum clade credibility tree constructed from whole mitochondrial genome sequences, with a focus
on Bornean Crocidura. Reconstructed with BEAST2. Dates are indicated on nodes and bar on bottom. Nodes used to calibrate
the dating are marked with a black square. Uropsilus and Soricinae outgroups were included in the phylogenetic analysis
for calibration purposes but removed from the figure for clarity. Since most nodes are highly supported (PP > 0.95), only
less supported nodes (0.95 < PP > 0.80) are marked with an orange circle. Colours on the vertical bar indicate geographical
origin of sampled animals, and colors match the map. Samples from north of Kra are shown in grey.
from each other: 0.27 (95% HPD: 0.16–0.36, mitoDNA) (EBD31635M- EBD31637M) were more closely
and 0.11 (95% HPD: 0.01–0.19, nDNA13) Mya. The related to each other than to those from Mt. Trusmadi
MRCA of these also diverged from that of Sulawesi (EBD31634M, EBD31642M-EBD31645M; Figs 1, 2, 4).
C. nigripes populations recently, about 0.26 (95% HPD:
0.14–0.40, nDNA13) Mya.
The time of divergence among west and north- Private alleles and species delimitation
east, and central Borneo populations of C. foetida and The Cytb haplotype network of the C. neglecta complex
C. neglecta clades were similar: 1.2 (95% HPD: 0.8–1.6, shows four main groups: northern Malay Peninsula,
nuclear) and 1.9 (95% HPD: 1.5–2.3, mitochondrial) north-eastern Borneo, central Borneo and central
Mya for C. foetida s.l.; and 1.1 (95% HPD: 0.6–1.5, Malay Peninsula with Sumatra and north-western
nuclear) and 2.2 (95% HPD: 1.8–2.8, mitochondrial) Borneo (Fig. 5A). The Malay Peninsula C. neglecta did
Mya for C. neglecta s.l. North-eastern populations not share nuclear alleles with the other populations
of C. cf. neglecta had higher divergence among (except for DVL1, the least variable one). Central
different mountains than C. foetida s.l. populations Borneo and north-western Borneo did not share
on the same mountains. Populations of C. neglecta alleles with the other populations at four and eight
s.l. from Mt. Alab (EBD31631M) and Mt. Kinabalu loci, while north-eastern Borneo had private alleles
© 2021 The Linnean Society of London, Zoological Journal of the Linnean Society, 2021, XX, 1–2412 A. HINCKLEY ET AL.
Downloaded from https://academic.oup.com/zoolinnean/advance-article/doi/10.1093/zoolinnean/zlab045/6327494 by guest on 24 September 2021
Figure 4. Species tree of Sundaland and Sulawesi Crocidura as estimated from 13 nuclear loci using *BEAST. Dates are
indicated on nodes and bar along the bottom of phylogeny. Nodes used to calibrate the dating are marked with a black
square. Highly supported nodes (PP > 0.95) are marked with a red circle, less supported nodes (0.95 < PP > 0.80) are marked
with a green circle, nodes with poor support (PP < 0.80) are not marked. Samples are coloured based on its geographical
origin and matching the map. Samples from north of the Isthmus of Kra are in grey.
at eight loci (Supporting Information, File S1, Fig. C. foetida from Sabah and C. baluensis in all but two
S3). The conspecificity matrix supported three or markers (Supporting Information, File S1, Figs S5,
four separately evolving metapopulation lineages in S6). The highland C. baluensis shared allele(s) at
this group. Malay Peninsula, north-eastern Borneo each nuclear locus with lowland C. foetida s.l. from
and north-western Borneo were highly supported, Sabah (Supporting Information, File S1, Figs S5, S6).
while the central Borneo population was moderately The conspecificity matrix supported two separately
supported (Supporting Information, File S1, Fig. S4). evolving metapopulation lineages in this group: (1)
The Cytb haplotype network, which includes many C. foetida s.s. from Sarawak and (2) C. baluensis,
more individuals from more populations than the C. nigripes and C. foetida s.l. from Sabah (Supporting
whole mitochondrial genome phylogeny, supported Information, File S1, Fig. S7).
the paraphyly of C. foetida (Fig. 5B). Populations
of C. foetida from Sabah were closely related to
C. baluensis and C. nigripes but were highly divergent Morphometric analyses
from those in Sarawak (Fig. 5B). The haplotype
diversity of the Philippine radiation was in between Principal component analysis of Crocidura
these two divergent lineages. The mid-elevation (1530 baluensis, C. nigripes and C. foetida morphology
m a.s.l.) specimen from Mt. Tambuyukon was within A high degree of morphological differentiation among
the diversity of highland C. baluensis. Crocidura the different populations was observed (Fig. 6A)
foetida from Sarawak did not share nuclear alleles with a large part (76%) of the variance explained
with the other populations in eight of the 12 variable by the first principal component (primarily size;
nuclear loci, while C. nigripes shared allele(s) with Supporting Information, File S3). PC1 discriminated
© 2021 The Linnean Society of London, Zoological Journal of the Linnean Society, 2021, XX, 1–24EVOLUTION OF SUNDALAND CROCIDURA 13
Downloaded from https://academic.oup.com/zoolinnean/advance-article/doi/10.1093/zoolinnean/zlab045/6327494 by guest on 24 September 2021
Figure 5. Whole Cytb haplotype median joining networks of two major lineages present in Borneo: Crocidura neglecta
complex (A) and C. foetida, C. baluensis, C. nigripes, Philippine Crocidura (B). Branch lengths are proportional to the
number of mutations, and this number has been specified on two branches as a scale.
Figure 6. Morphometric variation in the Crocidura foetida–C. baluensis-C. nigripes complex. A, shows first and second
principal components from an analysis of 14 cranial dimensions; B, shows second and third principal components of that
same analysis. PC1 shows differences in size of the different populations while PCs 2 and 3 highlight differences in shape.
the largest-sized individuals (C. baluensis), from the a higher contribution to PC2 and PC3 were palatal
medium-sized C. foetida s.l. and C. nigripes lipara, width at the third molar (53% and 20.8%) and rostral
and the smallest-sized C. nigripes nigripes. PCs 2 and breadth (11.5% and 42%). PC2 and PC3 discriminated
3 explained 7.8% and 5.3% of the variance and were C. baluensis, C. nigripes and C. foetida s.l. north-
mainly correlated with shape. The variables with eastern Borneo, which have a relatively gracile palate
© 2021 The Linnean Society of London, Zoological Journal of the Linnean Society, 2021, XX, 1–2414 A. HINCKLEY ET AL.
at the rostrum level but a relatively broader palate DISCUSSION
at the third molar level, from C. foetida s.s. NW
Permeability of the boundaries in Sundaland
Borneo, which showed the opposite pattern (Fig. 6B;
Supporting Information, File S3). Sundaland is bound by Wallace’s and Huxley’s lines at
the edges of the Sunda Shelf between islands where
there have never been land connections, and the
Downloaded from https://academic.oup.com/zoolinnean/advance-article/doi/10.1093/zoolinnean/zlab045/6327494 by guest on 24 September 2021
Isthmus of Kra, a terrestrial habitat transition (Fig. 1).
Phenotypic discrimination across elevation in Few genera of small mammals are distributed across
the Crocidura baluensis/C. foetida s.l. from these biogeographic breaks (Groves, 2001; Esselstyn
Sabah clade et al., 2010; Rowe et al., 2019), but one that is
Linear models showed GGLS varied positively with distributed across all three of these lines is the genus
elevation (R2 = 0.36; P < 0.001; Fig. 7C). After controlling Crocidura.
for GGLS and sex, tail length and HF also increased Previous studies have found that the Crocidura of
with elevation (tail, R 2 = 0.84; P < 0.001; Fig. 7A; Sulawesi form a clade that radiated on that island,
HF, R 2 = 0.49; P = 0.001; Fig. 7B). Linear models with one exception, C. nigripes, suggested to be a
supported a strong positive effect of elevation on more recent arrival (Ruedi, 1996; Ruedi et al., 1998).
different measurements of hair length: mid-dorsum Mitochondrial and nuclear tree divergence dating
(N = 48; R 2 = 0.67; P = 0.001), guard hairs (N = 28; estimated that Wallacea and Sundaland Crocidura
R2 = 0.73; P = 0.001), and longest guard hair (N = 28; split at ~6 and 7 Mya. This date is more recent than
R2 = 0.72; P = 0.002) (Fig. 7D). that of Sundaland-Sulawesi squirrels (~9.7–12.5 Mya;
90
A. Tail 20 B. HF
80
18
70
mm
mm
16
60
14
50
12
1000 2000 3000 1000 2000 3000
elevation (m) elevation (m)
C. GGLS D. Hair
12.5
25
10.0
24
mm
mm
7.5
23
hair middorsum
5.0 guard hairs
longest guard hair
22
1000 2000 3000 1000 2000 3000
elevation (m) elevation (m)
C. baluensis C. foetida Sabah
Figure 7. Relation of external morphology to elevation in the Crocidura baluensis/C. foetida s.l. clade from Sabah.
© 2021 The Linnean Society of London, Zoological Journal of the Linnean Society, 2021, XX, 1–24EVOLUTION OF SUNDALAND CROCIDURA 15
Hawkins et al., 2016a) or tarsiers (~23.4 Mya; Driller Mya (Esselstyn et al., 2010). Philippine and Sulawesi
et al., 2015), which are more tightly associated with radiations started diversifying at the same time as
forest, but also older than that of Sundaland and Sundaland, during the Early Pleistocene (~1.6 and
Sulawesi spiny rats (~1.4 Mya; Rowe et al., 2019), 1.9 Mya). This could suggest that an Early Pleistocene
which are distributed across a wide variety of habitats. glacial maximum at ~1.6 Mya might have promoted
This could suggest that habitat could be an important dispersal events among different landmasses through
Downloaded from https://academic.oup.com/zoolinnean/advance-article/doi/10.1093/zoolinnean/zlab045/6327494 by guest on 24 September 2021
factor in sweepstakes’ dispersal events. The long gap a sea lowstand (200 m below present level) but also
between the divergence from Sundaland MRCA (~6–7 fragmented the rainforest within these landmasses,
Mya) and diversification (~ 1.9 Mya) of Sulawesi generating similar divergence patterns through two
Crocidura is notable and mirrors that of Sulawesi different processes: dispersal and vicariance (Abegg,
tarsiers (Driller et al., 2015). Potential explanations 2002; Brown et al., 2014). Intraspecific lineage
for such a ‘delayed’ diversification could involve diversification in Sundaland’s red spiny rat (~1.5
incomplete taxon sampling and/or extinction of early- Mya; Leonard et al., 2015), Borneo’s Low’s squirrel
branching lineages (Moen & Morlon, 2014; Driller (~1.7 Mya; Hinckley et al., 2020), Sulawesi squirrels
et al., 2015). The Lesser Sunda/Proto Java C. maxi and (Prosciurillus Ellerman, 1947; ~1.5–2.3 Mya; Hawkins
C. tenuis and Palawan C. batakorum were not sampled et al., 2016a), Philippine colugos (~1.5 Mya; Mason
in our divergence dating analyses and might partially et al., 2016) and speciation in Sunda rats (~2.2 Mya;
explain this time gap. Camacho-Sanchez et al., 2017), Rusa deer (~1.8 Mya;
Our dating of the phylogeny supports a Late Martins et al., 2019), leaf monkeys (~1.3–1.6 Mya;
Pleistocene or Holocene colonization of Sulawesi Trachypithecus Reichenbach, 1862; Roos et al., 2020),
from northern Borneo by the ancestor of C. nigripes Greater Mindanao Sunda squirrels (~1.7 Mya; Den
(Fig. 4). Divergence dating overestimation is known Tex et al., 2010) and Philippine forest mice (Apomys
to be pervasive in recent divergence times, so these Mearns, 1905; ~1.5 Mya; Heaney et al., 2018), also
populations possibly diverged even more recently took place during a similar time frame, or slightly
(Ho et al., 2005), perhaps within the time period that before, such as Sulawesi tarsiers (~2.5 Mya; Driller
humans had begun to move around the region in boats et al., 2015).
(Van den Bergh et al., 2016). Skull morphometric As shown for the Philippines and Wallacea
evidence is also consistent with a recent divergence, (Ruedi et al., 1998; Esselstyn & Oliveros, 2010),
since C. nigripes exhibits the same craniodental the Crocidura of Sundaland and Indochina were
shape as north Borneo endemic C. baluensis and not monophyletic, indicating that the Isthmus of
C. foetida s.l. but is well differentiated from the Kra is also a permeable boundary for this genus. In
other Bornean lineage, C. foetida s.s.. Although a line with this high permeability, the mito-nuclear
recent natural colonization cannot be discarded, divergence dating (~ 2.25 and 0.80 Mya) between
as suggested for C. tanakae to the Batanes islands C. f u l i g i n o s a a n d C. d r a c u l a , m i g h t s u g g e s t
in Esselstyn & Oliveros (2010), it is also plausible secondary contact with nuclear gene flow after
that this population arrived to Sulawesi through allopatric divergence across the Isthmus of Kra.
human-mediated colonization. While there is no Studies on birds have estimated similar divergence
straightforward way to test this hypothesis with events across Kra (1.0–1.1 Mya; Lim et al., 2020).
our current data, there are several lines of evidence Interestingly, the Sundaic-Philippine clade and
supporting this reasoning. First, C. foetida s.l. is Indochinese-Sundaic clade diverged during the
a synanthropic species, common in gardens and Miocene–Pliocene boundary, at the same time as the
wastelands, making it a good candidate for human- Sundaic Crossogale Thomas, 1921 and Indochinese-
mediated introductions (Burgin et al., 2018b). Second, Himalayan Chimarrogale Anderson, 1877 water
there is extensive evidence for multiple introduced shrews (Fig. 2; Yuan et al., 2013, Abramov et al.,
species to Sulawesi in the literature, such as rats, 2017; Abd Wahab et al., 2020). Yuan et al (2013)
porcupines, civets and deer (Groves, 2001). Third, have suggested that global warming during the
shrews have been introduced by humans to many Late Miocene might have isolated water shrew
different islands across the world, both in recent populations and promoted allopatric vicariance in
(Bover et al., 2012; Gargan et al., 2016; Pinya et al., cooler mountain climatic refugia (across mainland
2018) and historic times (Alcover, 1980; Cheke, 1987). Asia and in northern Borneo). However, Crocidura
Further sampling in east and south Kalimantan will might have actually expanded their distribution
be needed to shed additional light on the origin of and colonized new areas during the rainforest
this recently diverged Sulawesi lineage. expansion driven by this global warming event.
Crocidura shrews appear to have breached Further molecular and natural history evidence
Huxley’s line and colonized the Philippines from will be needed to test different biogeographic
Sundaland via Palawan a single time at around 1.8 scenarios.
© 2021 The Linnean Society of London, Zoological Journal of the Linnean Society, 2021, XX, 1–24You can also read