Examining Response to Negative Life Events Through Fitness Tracker Data
←
→
Page content transcription
If your browser does not render page correctly, please read the page content below
ORIGINAL RESEARCH
                                                                                                                                                    published: 21 May 2021
                                                                                                                                           doi: 10.3389/fdgth.2021.659088

                                               Examining Response to Negative Life
                                               Events Through Fitness Tracker Data
                                               Louis Faust 1 , Keith Feldman 2,3 , Suwen Lin 1 , Stephen Mattingly 1 , Sidney D’Mello 4 and
                                               Nitesh V. Chawla 1*
                                               1
                                                Department of Computer Science & Engineering, University of Notre Dame, Notre Dame, IN, United States, 2 Children’s
                                               Mercy Kansas City, Kansas City, MO, United States, 3 Department of Pediatrics, University of Missouri-Kansas City School of
                                               Medicine, Kansas City, MO, United States, 4 Institute of Cognitive Science, University of Colorado, Boulder, CO, United States

                                               Negative life events, such as the death of a loved one, are an unavoidable part of life.
                                               These events can be overwhelmingly stressful and may lead to the development of mental
                                               health disorders. To mitigate these adverse developments, prior literature has utilized
                                               measures of psychological responses to negative life events to better understand their
                                               effects on mental health. However, psychological changes represent only one aspect of
                             Edited by:        an individual’s potential response. We posit measuring additional dimensions of health,
                          Jochen Meyer,        such as physical health, may also be beneficial, as physical health itself may be affected
   Institute for Information Technology
                                               by negative life events and measuring its response could provide context to changes in
                       (OFFIS), Germany
                                               mental health. Therefore, the primary aim of this work was to quantify how an individual’s
                        Reviewed by:
                        Clara Caldeira,        physical health changes in response to negative life events by testing for deviations in
       Indiana University Bloomington,         their physiological and behavioral state (PB-state). After capturing post-event, PB-state
                          United States
                   Karmen S. Williams,         responses, our second aim sought to contextualize changes within known factors of
     City College of New York (CUNY),          psychological response to negative life events, namely coping strategies. To do so, we
                          United States
                                               utilized a cohort of professionals across the United States monitored for 1 year and who
                   *Correspondence:
                                               experienced a negative life event while under observation. Garmin Vivosmart-3 devices
                     Nitesh V. Chawla
                     nchawla@nd.edu            provided a multidimensional representation of one’s PB-state by collecting measures of
                                               resting heart rate, physical activity, and sleep. To test for deviations in PB-state following
                    Specialty section:
                                               negative life events, One-Class Support Vector Machines were trained on a window of
          This article was submitted to
                     Health Informatics,       time prior to the event, which established a PB-state baseline. The model then evaluated
                a section of the journal       participant’s PB-state on the day of the life event and each day that followed, assigning
              Frontiers in Digital Health
                                               each day a level of deviance relative to the participant’s baseline. Resulting response
          Received: 27 January 2021
           Accepted: 24 March 2021
                                               curves were then examined in association with the use of various coping strategies using
            Published: 21 May 2021             Bayesian gamma-hurdle regression models. The results from our objectives suggest that
                               Citation:       physical determinants of health also deviate in response to negative life events and that
Faust L, Feldman K, Lin S, Mattingly S,
                                               these deviations can be mitigated through different coping strategies. Taken together,
     D’Mello S and Chawla NV (2021)
 Examining Response to Negative Life           these observations stress the need to examine physical determinants of health alongside
 Events Through Fitness Tracker Data.          psychological determinants when investigating the effects of negative life events.
         Front. Digit. Health 3:659088.
     doi: 10.3389/fdgth.2021.659088            Keywords: fitness trackers, negative life events, physical health, coping, Garmin, wearable technology

Frontiers in Digital Health | www.frontiersin.org                                     1                                               May 2021 | Volume 3 | Article 659088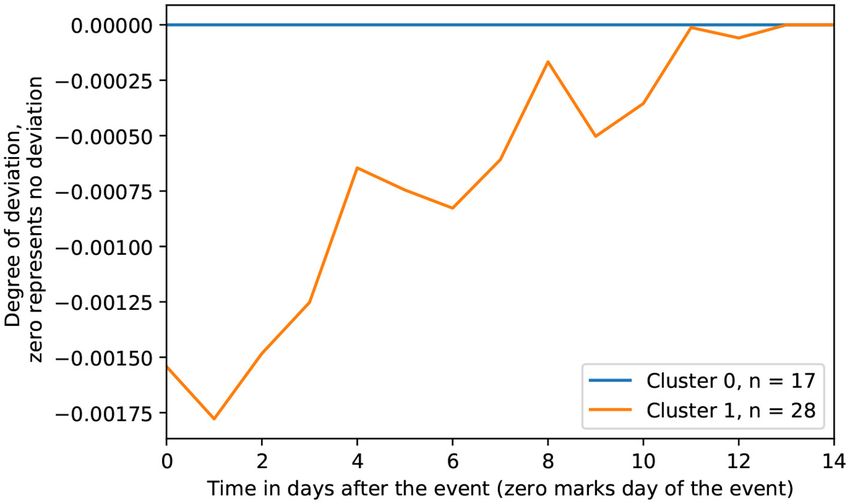
Faust et al.                                                                                               Negative Events Through Fitness Trackers

1. INTRODUCTION                                                            following a negative life event? By capturing physiological and
                                                                           behavioral responses to negative life events, we can begin to
Ranging from the death of a loved one to injury or illness,                understand whether attributes of one’s physical health can also
negative events are an unavoidable part of life (1). These                 be perturbed following the event. Once these physical responses
events are not only overwhelming stressful, they can also                  to negative life events have been quantified, our secondary aim
have prolonged adverse effects, such as the development of                 seeks to assess the relationship between the varying trajectories
mental health disorders, including depression, anxiety, and Post-          of these responses and the use of coping strategies. Specifically,
traumatic Stress Disorder (PTSD) (2–4). Given their distressing            the second research question (RQ2) asks Does the magnitude and
and inevitable nature, a wealth of research has developed around           duration of deviation associate with how the individual copes with
the response to negative life events in an effort to understand how        the negative life event? Coping strategies often depict how people
the long-term impact of these events may be mitigated (1, 5).              mitigate and solve stressful encounters, and have been organized
    Traditionally, investigations into the consequences of                 by (18) into 14 different categories (19, 20). Addressing this
negative life events have focused on capturing the individual’s            question will seek to contextualize individual’s physical responses
psychological response (5). To accomplish this, studies have               within known factors of psychological responses to negative
utilized a variety of self-report psychological measures ranging           events, beginning to bridge these two dimensions of health with
from daily levels of positive and negative affect to yearly reports        regard to negative life events.
of life satisfaction (6, 7). While, these efforts have succeeded
in quantifying psychological responses to negative life events,
                                                                           2. MATERIALS AND METHODS
the mental effects of negative life events, though important,
represent only one dimension of our health. Notably, a person’s            2.1. Study
physical health may also be affected by negative life events;              The data utilized in this article come from the Tesserae study,
however, this dimension has yet to be thoroughly studied.                  which recruited 757 participants throughout different companies
    Investigations into the effects of negative life events on             across the United States, concentrated around four major
physical health are important for several reasons. First, there is         organizations (21). The study followed participants for 1 year,
evidence that considerable variance exists in how people respond           collecting demographics, psychometrics, fitness tracker data, and
to negative life events, suggesting that while not everyone                life events. Demographics, psychometrics, and life events were
will develop prolonged mental health complications, negative               collected through surveys given at the beginning and end of the
consequences of these events may still be experienced in other             study. Participants’ heart rate, physical activity, and sleep were
ways (5). For example, just as these events may lead to increased          captured through Garmin Vivosmart 3 fitness trackers. To ensure
negative affect or the development of PTSD in some, so too might           completeness in the data collection, participants were required
they lead to poor sleep or diminished physical activity in others.         to wear their Garmin 80% of the time and received monetary
With investigations primarily targeting psychological factors, the         compensation if this threshold was met. For a complete detailing
latter may go unobserved in large-scale studies. Second, studying          of the study, we refer to the reader to (21).
physical health may also supplement psychological research,
given the well-established connections between physical and                2.2. Data
mental health, such as increased exercise reducing depressive              To address the underlying research questions presented in this
symptoms and poor sleep associated with increased odds of                  article, two primary sources of data were required: fitness tracker
depression and PTSD (6, 8–13). Including these physical factors            and survey data. Details for each are provided in this section.
may provide additional context to the presence (or absence) of
adverse mental health effects following a negative life event (14).        2.2.1. Fitness Tracker Measures
    To quantify these physical health factors, traditional self-           To capture an individual’s physiological and behavioral state, we
report surveys have often been utilized; however, such reports are         utilized three measures monitored by the Garmin fitness trackers,
subject to recall bias and inability to capture real-time responses.       specifically resting heart rate, physical activity, and sleep. We
Instead, recent advancements in wearable technology provide                briefly summarize the importance of each respective measure and
the opportunity to capture attributes of physical health in a              detail how they are computed via the Garmin devices.
continuous and unobtrusive manner, allowing for measures such              - Resting Heart Rate: Resting heart rate has become a well-
as resting heart rate, physical activity, and sleep to be captured           established biomarker for cardiovascular health. Following
passively and long term (15–17).                                             an array of studies, higher RHR has been observed to be
    This article serves to leverage this technology to capture               independently associated with increased risk of all-cause and
attributes of physical health and address this gap in negative               cardiovascular mortality (15, 22–26).
life events literature. Our study features a cohort of working               Calculated on a daily basis, Garmin computes RHR as the
professionals located throughout the United States who                       average of all heart rate readings recorded while the user was
were observed via Garmin fitness trackers for 1 year and                     asleep, excluding periods where any steps were detected or the
retrospectively recorded any negative life events that occurred              readings fell outside reasonable bounds (27).
while under observation. Utilizing these cohorts’ data, we aim             - Physical Activity: An important behavior for reducing all-
to answer two research questions. The first question (RQ1) asks              cause mortality and extending life expectancy, moderate-
Does an individual’s physiological and behavioral state deviate              vigorous physical activity (MVPA), such as brisk walking or

Frontiers in Digital Health | www.frontiersin.org                      2                                       May 2021 | Volume 3 | Article 659088
Faust et al. Negative Events Through Fitness Trackers
running, has been linked to the prevention of many chronic 2.2.2.2. COPE Inventory
diseases, as well as boosting the immune system and lowering Alongside the life events questions, the Brief COPE inventory
stress levels (16, 28–33). was included in the follow-up survey. Brief COPE consists of 28
Daily minutes of MVPA were defined using Garmin’s “Intensity questions to gauge the extent to which the respondent utilizes (if
Minutes” measure. Garmin notes these minutes are calculated at all) 14 different strategies for coping with adverse events (18,
based on heart rate: comparing the individual’s current rate to 39). Below, we list the 14 different strategies and provide a brief
their average resting heart rate, as well as number of steps taken description for each using excerpts from the author and the
per minute (34). specific survey questions when necessary.
- Sleep duration: Sleep, or lack thereof, has been repeatedly
Acceptance - “...accepts the reality of a stressful
linked to adverse medical conditions and decreased life
situation...” (39)
expectancy, as such, ensuring 7–9 h of sleep per night
Active Coping - “...the process of taking active steps to try
is critical to maintaining a person’s personal health and
to remove or circumvent the stressor or to ameliorate its
wellness (17, 35–37).
effects” (39)
Nightly hours of sleep were computed by Garmin through a
Behavioral Disengagement - “...reducing one’s effort to deal
combination of the device’s heart rate sensor and accelerometer
with the stressor, even giving up the attempt to attain goals
to determine bedtimes and waketimes (38).
with which the stressor is interfering” (39)
In combination, these health measures provide a Denial - “...refusal to believe that the stressor exists or trying
multidimensional, daily representation of an individual’s to act as though the stressor is not real...” (39)
physiological and behavioral state. For brevity, we further Humor - “...making jokes about it [the stressor]/making fun of
reference this representation as a person’s PB-state. To ensure the situation...” (18)
these measures capture different aspects of an individual’s PB- Planning - “...thinking about how to cope with a stressor.
state, we conducted a Pearson correlation analysis between each Planning involves coming up with action strategies, thinking
pair of variables within each participant. Across participants, about what steps to take and how best to handle the
the median (min, max) correlations were 0.02 (−0.13, 0.24) problem” (39)
for resting heart rate and sleep duration, 0.06 (−0.09, 0.27) Positive Reframing - “...construing a stressful transaction in
for resting heart rate and active minutes, and −0.006 (−0.12, positive terms...” (39)
0.23) for active minutes and sleep duration. A detailed overview Religion - “...the tendency to turn to religion in times of
regarding the full distributions of these correlations is provided stress.” (39)
in Supplementary Figure 1. For the majority of participants, Self-Blame - “...criticizing oneself for responsibility in the
we observe only weak correlations between these measures, situation...” (18)
with the strongest observed correlation for any one individual Self-Distraction - a focus on “...doing things to take one’s
being r = 0.27. These observations suggest that while these mind off the stressor” (18)
measures may be weakly associated with one another, each offers Substance Use - “using alcohol or other drugs to feel better/to
an independent contribution toward a person’s PB-state. help me get through it [the stressor]” (18)
Use of Emotional Support - “...getting moral support,
2.2.2. Survey Data sympathy or understanding” (39)
Use of Instrumental Support - “...seeking advice, assistance,
2.2.2.1. Life Events
or information.” (39)
Following completion of the Tesserae study, a follow-up survey
Venting - “...the tendency to focus on whatever distress or
was administered to participants. As part of this survey,
upset one is experiencing and to ventilate those feelings” (39)
participants were asked to detail significant events they had
experienced while under observation.
For each event, participants were asked to provide additional 2.3. Cohort Selection
details including whether the event was a positive or negative Despite enrolling a total of 757 participants, not all were
experience (referred to as “valence”), significance of the event, eligible for analysis. To ensure our research questions were
date the event occurred, and their confidence that the date appropriately and rigorously addressed, several data filtering
they provided was correct. Valence, significance, and date steps were required. A full outline of our cohort selection is
confidence were each asked on a 7-point Likert scale. For provided in Figure 1.
valence, “1” indicated that the event was “Extremely Positive” The first step in our cohort selection pertains to the life
and “7” indicated that the event was “Extremely Negative.” events survey. Among the 757 study participants, a total of 330
For significance, “1” indicated “Lowest significance” and “7” participants completed the life events survey during their exit
indicated “Highest significance.” And for date confidence, testing. The survey asked participants to report any life events
“1” indicated “Lowest confidence” and “7” indicated “Highest they experienced during the study and describe them by their
confidence.” Finally, participants were asked, if willing, to valence and significance. Additionally, as this survey was asked
provide a brief description of the event. Such responses included retrospectively, participants were also required to report their
“death of a family member” and “took on a greatly increased confidence in the accuracy of date they provided for when the
work load.” event occurred. As the aim of our work was to investigate the
Frontiers in Digital Health | www.frontiersin.org 3 May 2021 | Volume 3 | Article 659088Faust et al. Negative Events Through Fitness Trackers
to provide reasonable representations of daily of physical activity
and sleep (40). Following this step, a total of 31 participants were
excluded, resulting in 46 participants.
Lastly, one participant was removed as they did not complete
the COPE survey, resulting in a final cohort of 45 participants.
Among this cohort were a total of 26 (57%) females and 19
(42%) males. The age distribution for this cohort was (Min: 23;
Q1: 28, Median: 37, Q3: 47, Max: 63).
2.4. Analysis
2.4.1. Quantifying Response to Negative Life Events
2.4.1.1. Experiment Setup
To determine whether an individual’s PB-state deviated in
response to a negative life event (RQ1), it was first necessary to
establish each participants “normal” or baseline PB-state prior
to the negative life event. This baseline would allow us to assess
the degree of deviation from this state for each respective day
following the negative life event.
To make these comparisons, participant’s multivariate time
series, composed of daily measures of resting heart rate, physical
activity, and sleep, were partitioned into two windows relative to
when the negative life event occurred. First, a 60-day pre-event
time window encompassed the days leading up to the negative
life event, providing the time-span to establish a baseline. Second,
a 15 day post-event window provided the days to be compared
against the baseline to assess deviations. Despite the post-event
window label, we clarify that the post-event window includes
the day of the negative life event. Utilizing these windows also
ensured that all participants were compared in the same manner.
FIGURE 1 | Consort diagram.
Finally, we note that while participants could mark multiple
significant negative life events throughout their time in the
study, we focused only on the first significant negative life event
they recorded. This ensured a significant negative life event
effects of major negative life events, several filtering criteria was not present in the data used to establish a participant’s
were imposed on these three dimensions. First, only negative baseline PB-state.
life events were considered, resulting in 217 participants with
eligible events. To ensure high impact or significant life events 2.4.1.2. Data Pre-processing
were studied, only negative events described as having at least Before making comparisons between the pre- and post-event
“high significance” were included, resulting in 183 participants. windows, several data pre-processing steps were necessary.
Including these criteria ensured that while two participants may Referring back to our cohort selection, all participants were
have experienced different events, their perception of the valence required to have worn their fitness tracker for at least 80% of
and significance of the events was comparable. Examples of these the days in the pre- and post-event windows, respectively. This
life events included marital problems, financial issues, pregnancy threshold ensured an accurate PB-state baseline was established
complications, and the death of loved ones. Finally, ensuring the and a sufficient number of days were available to capture
life event occurred on the exact date reported was critical, as such, the person’s response to the negative life event. Within both
only events marked as having the “Highest confidence” in the date these windows, any missing daily measures of resting heart
they occurred were considered, resulting in 77 participants with rate, physical activity, or sleep duration were imputed using
eligible life events. linear interpolation.
The next step in our filtering process focused on the amount of Our next step was to address the seasonality and stationarity
time participants wore their fitness trackers. Criteria at this step of the time series data; this would ensure days considered
ensured all individuals were observed via their fitness trackers for “deviations” were not simply due to the presence of trends
an amount of time sufficient to adequately capture their PB-state. in the data or cyclic changes manifesting from the shift
This required participants to have worn their device for at least between weekdays and weekends. Seasonality was addressed by
80% of the days they were observed before and after the negative computing the mean value for each univariate time series for
life event (we elaborate on these “before” and “after” time spans in each day of the week and subtracting the mean value from each
the next section) and for at least 80% of each day (19 out of 24 h). respective day (41). The deseasonalized time series were then
This 80% threshold was utilized as it has previously been shown tested for stationarity using an Augmented Dickey-Fuller test on
Frontiers in Digital Health | www.frontiersin.org 4 May 2021 | Volume 3 | Article 659088Faust et al. Negative Events Through Fitness Trackers
each univariate time series (42). Results of these tests indicated all their PB-state baseline. The parameter ν, which designates the
time series were stationary (α = 0.05). upper bound on the fraction of training errors, was set to an
Lastly, each participant’s time series was normalized using z- arbitrarily small value (0.01) to ensure the OCSVMs trained on all
normalization to remove the magnitude of the different variables, pre-event data when learning the PB-state baseline. Parameters
ensuring one variable could not drive the presence of deviations other than ν utilized the default settings in scikit-learn, which can
by shifting in greater absolute values. These data pre-processing be found in the scikit-learn documentation (46, 47).
steps resulted in multivariate time series spanning 75 days,
composed of an individual’s normalized resting heart rate, total
MVPA minutes, and nightly sleep duration, providing a daily 2.4.1.4. Internal Validation
representation of an individual’s PB-state. Finally, to ensure any observed deviations in PB-state were
not due to random chance, an internal validation study was
2.4.1.3. Model Specification conducted. The objective of this study was to compare response
To establish a baseline PB-state and measure an individual’s curves generated following the day of a negative life event to
response to a negative life event, we framed this task as a novelty curves generated following a day with no event, with the latter
detection problem. The goal of novelty detection is to determine, group of curves acting as a control group. We could reasonably
based on a set of training data, whether a new observation is an assume that if the curves from both groups are similar, than the
inlier or outlier (aka a novelty) (43). This strategy appropriately deviations would likely have occurred by chance. However, if
addressed our research question, considering a separate model the deviations in the “life events” group were stronger than the
could be trained for each participant using the PB-state data in deviations in the “no events” group, this would provide evidence
their pre-event window. Using this learned representation as a that deviations following a negative life event may be associated
participant’s baseline PB-state, the model could then parse each with the event.
day in the participant’s post-event window, treating the days This experiment was conducted as follows: for each individual,
as new observations and determining whether each day’s PB- we began with their full time series; representing their entire time
state was an inlier or outlier, relative to that participant’s learned in the study. We then removed the 75-day window (60 days pre-
baseline. This sequence of estimates from the model could then event, 15 days post-event), which was utilized for investigating
represent the participant’s response curve, with days deemed their response to a negative life event. A sliding window of 75
“inliers” representing days where the PB-state was similar to days then swept across their remaining time series, sliding on
baseline and days deemed “outliers” representing days where the a day-by-day basis, capturing all valid, contiguous 75 day time
PB-state deviated from the baseline. blocks. A time block was considered valid if (1) it met the same
The specific model selected for this task was a One-Class 80% wear time threshold used in the initial analysis and (2) no
Support Vector Machine (OCSVM). An OCSVM was ideal for life event was present in the block.
modeling this phenomenon for several reasons. First, for its Having collected valid time blocks for each participant, these
ability to account for the multivariate nature of the data by blocks were then bootstrapped (sampled with replacement)
representing a person’s daily resting heart rate, physical activity, 10,000 times, with an OCSVM model training on the first 60 days
and sleep as points in a three-dimensional space. Second, utilizing of each block and classifying the last 15 days (48). This resulted
a Radial Basis Function (RBF) kernel allowed for non-linear in 10,000 no event response curves for each individual. From
relationships between the data streams to be captured within these, the median response curve was then computed for each
the pre-event data (44). Finally, the model provided a singular participant, effectively estimating a generalized median response
metric of distance from the distribution of training data using to no event for each participant. These no event response curves
the learned decision boundary, effectively capturing the degree were then compared to the response curves, which resulted from
to which each post-event day was considered an inlier or negative life events with two tests.
outlier (45). Days which fell within the bounds of the decision To determine whether a significant difference existed between
function (inliers) were represented by positive values, and days the negative life event and no event response curves, two
which fell outside the bounds of the decision function (outliers) comparisons were made in accordance with our two response
were represented by negative values; the magnitude of the values characteristics of interest: immediate impact and short-term
indicated the degree to which a single day was an inlier or outlier. trajectory, detailed in the next section. The first test is aligned
Classifying each day across the post-event window resulted in a with immediate impact, assessing deviations on the first day of
univariate sequence of values, representing the negative life event the response. This was done using the non-parametric Wilcoxon
response curve. Daily values in this sequence represented the signed-rank test, comparing the paired distributions of event-day
degree to which the individual conformed to or deviated from deviations resulting from the life event to event-day responses
their baseline PB-state. resulting from no event. The second test was aligned with short-
OCSVMs were implemented using scikit-learn (v0.21.3) (46, term trajectory and was performed on the sum of deviations
47). All OCSVM parameters were held constant across the within the response curve to assess the cumulative deviation in
separate models trained for each participant. By holding these response to an event. Again, a Wilcoxon test was performed
parameters constant, we ensured the detection of novel (or assessing the paired distribution of cumulative deviation in
outlying) days did not result from variance in model parameters response to a negative life event to the cumulative deviation in
between participants and arose strictly from the distribution of response to no event.
Frontiers in Digital Health | www.frontiersin.org 5 May 2021 | Volume 3 | Article 659088Faust et al. Negative Events Through Fitness Trackers
2.4.2. Response Characteristics Short-term trajectory: The second characteristic of the
Moving to RQ2, we sought to investigate how the utilization of response curves we investigated was the short-term trajectory,
various coping strategies may be associated with these negative allowing us to assess whether deviations persisted across the
life event response curves. This question was partitioned into 2 weeks following the negative life event. Once again, all
two sub-questions based on the two characteristics of the inliers were truncated at zero, but this time, outliers retained
response curve that were of interest. The first characteristic their negative sign. To capture common response trajectories,
being the degree of deviation on day 1 of the curve each individual’s response curve was first smoothed using
or the immediate impact on PB-state in response to the lowess, after which K-shape clustering was performed on the
negative life event. The second, being the overall shape of smoothed response curves (59). This resulted in an optimal
the curve or short-term trajectory spanning the 2 weeks that K of two, based on silhouette score. After identifying these
followed the life event. This would answer questions such as two clusters, associations between response curves and coping
whether the deviations persisted? or did they quickly return strategies were tested using Bayesian logistic regression. We
to baseline? utilized the same procedure for adjustment variables, sampling
Using each of these characteristics as an outcome, associations iterations, and credible intervals as we did for the immediate
between them and each coping strategy were modeled impact characteristic.
using a series of Bayesian regressions, while adjusting for
several potential confounding variables. We note a Bayesian 2.4.3. Common Deviations
approach was taken for this analysis as previous studies Having addressed the two research questions posed in this article,
have shown Bayesian methods to yield more accurate we concluded with a post hoc analysis to determine whether
estimates among small data (49–52). Bayesian regressions common deviations existed within the PB-state response to a
were implemented using the R package BRMs (53) and negative life event. Utilizing the clustering outcomes from the
statistics were derived from these models using the R package previous section, we investigated whether a significant group-
BayesTestR (54). level increase or decrease in resting heart rate, physical activity,
or sleep duration manifested following the negative life event.
Immediate Impact - The first characteristic of the response
Median values were computed for each individual within
curve we investigated was immediate impact, or response on
their pre-event and post-event windows for each of these three
the day of the negative life event. This characteristic was
measures. Utilizing paired-distribution Wilcoxon tests, we tested
chosen as previous works examining response to negative
whether a significant difference existed in each variable between
life events observed the most significant changes to occur
the median pre-event values and median post-event values. Tests
immediately following the event (6, 7, 55). Immediate impact
were performed on each cluster of participants separately.
was measured by evaluating the degree of deviation a
Before concluding the Methods section of this article, we
participant experienced on the day the negative life event
briefly comment on statistical significance. Given the recent
occurred. As the OCSVMs provided the degree to which a day
movements toward reevaluating statistical significance as a scale
was an inlier as well as an outlier, we truncated the degree
rather than binary operation, we provide exact values for all data
of all inliers to 0. Given this study was specifically focused
examined and allow the reader to decide their own interpretation
on deviation, knowing the degree to which a person’s PB-
of “significance” (60).
state was an inlier was unnecessary, considering the model had
already determined an inlier to be representative of a person’s
normal PB-state. To more easily model these outliers, we 3. RESULTS
switched their original negative sign to positive. This resulted
in a right-skewed distribution where absolute zero represented 3.1. Response to Negative Life Events
normal behavior and positive values represented the degree of To address RQ1, OCSVMs were trained on a participant’s pre-
deviation. To appropriately model this mix of absolute zeros event window to learn their baseline PB-state. These models
and strictly positive values, we utilized a Gamma hurdle family then parsed the participant’s post-event window, estimating
for our Bayesian models (53). A series of regression tests were for each day, whether the observed PB-state was an inlier or
then performed to investigate each coping strategy covered outlier, respective to the learned baseline. This sequence of
in the COPE inventory. Coping strategies were analyzed daily estimates represented the participant’s negative life event
separately to allow the models parameter space to better fit response curve. Daily values of these response curves represented
recommended parameter-to-sample ratios and prevent the the degree to which that day’s PB-state conformed to (represented
correlations among these coping strategies from producing by positive values) or deviated from (represented by negative
biased estimates (56, 57). Each regression adjusted for values) the learned baseline, with larger positive values indicating
demographic traits: gender and age, as well as the participant’s stronger conformity and smaller negative values indicating
perceived valence and significance of the event. For each stronger deviation. An aggregation of these sequences is provided
regression, we utilized uninformative flat priors and a total of in Figure 2. The solid blue line represents the median estimate
100,000 posterior samples were drawn, ensuring the necessary across all participants, while the blue dashed lines represent
10,000 effective samples recommended for stable credible the 25th and 75th percentiles (the yellow lines will be covered
intervals (58). in the next paragraph). We observe that the median response
Frontiers in Digital Health | www.frontiersin.org 6 May 2021 | Volume 3 | Article 659088Faust et al. Negative Events Through Fitness Trackers
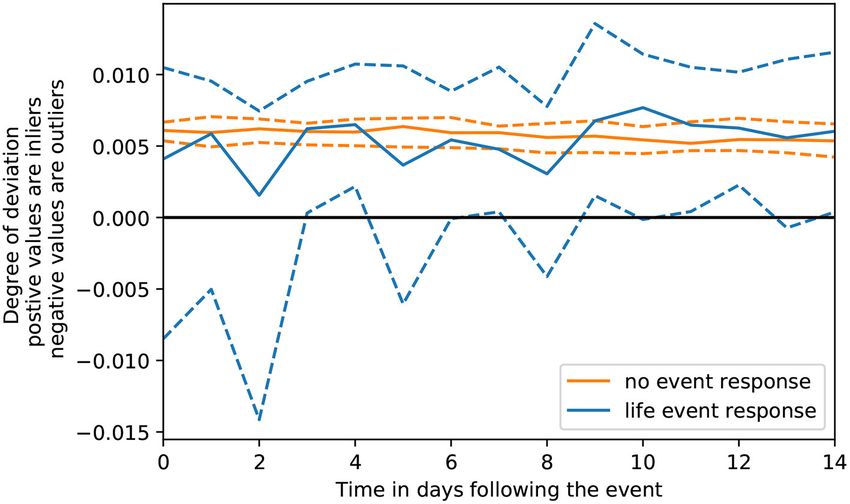
FIGURE 2 | Distribution across time of negative life event response curves compared to no event response curves.
remains positive across the post-event window, while the lower impact and short-term trajectory, with different coping strategies
quartile is negative and slowly becomes positive over the post- through a series of Bayesian regressions. For both response
event window. characteristics, we provide the median effect size and 90%
With respect to the validation study, the yellow lines in credible interval of each COPE measure. For convenience, this
Figure 2 represent an aggregation of response curves in which information is also displayed as a coefficient plot for each
no negative life event was present. Similar to the blue lines, the response characteristic. Additionally, we provide the probability
solid yellow line represents the median and dashed yellow lines of direction for each measure; an index of effect existence based
represent the 25th and 75th percentiles. Using these two groups on the posterior distribution which ranges from 50 to 100%.
of curves, we can reasonably assume that if the same degree The index represents the certainty with which an effect goes in
of deviation was found in both the yellow and blue lines, then a given direction, such as positive or negative (54, 61). Strongly
the deviations in the blue lines may be due to random chance, correlated with P-values, a probability of direction of 95% is
as response curves generated when no negative life event was roughly equivalent to a P-value of 0.1.
present, would produce the same degree of deviation as curves
generated when an event was present.
To determine whether these response curves were 3.2.1. Immediate Impact
significantly different, we performed two statistical tests in Observations for associations between coping strategies and
line with our two characteristics of interest. The first test immediate impact are detailed in Figure 3, with numerical values
assessed immediate impact of the response. From our Wilcoxon and probability of direction provided in Table 1. Having utilized
signed-rank test, we observed that deviations on the first day a gamma family for our regressions, values above 1 represent the
of the curve were significantly stronger in response to the multiplicative increase in deviation on the day of the event, while
negative life event than deviations on the first day of the curve values below 1 represent the multiplicative decrease in deviation
in response to no event (P = 0.014). The second test assessed on the day of the event.
short-term trajectory by comparing the sum of deviations across Utilizing the Brief COPE inventory, we observed several
the response curve. Again, using a Wilcoxon test, we observed coping strategies significantly associated with less deviation.
that the sum of deviations across the negative life event response Specifically, we observe that acceptance (OR 0.56; 90% CI: 0.35,
curves were significantly stronger than the sum of deviations 0.90), self-distraction (OR 0.59; 90% CI: 0.45, 0.78), planning
across the no event response curves (P < 0.001). Overall, the (OR 0.59; 90% CI: 0.48, 0.73), and active coping (OR 0.75; 90%
results from this internal validation analysis provide evidence CI: 0.57, 0.98) were significantly associated with less deviation
that the deviations observed following the negative life event regarding the immediate impact of the negative life event.
were not due to random chance.
3.2.2. Short-Term Trajectory
3.2. Response Characteristics To capture common short-term trajectories among the response
Moving to RQ2, we modeled the association between two curves, K-shape clustering was utilized, producing a optimal
characteristics of the negative life event responses: immediate partition of two clusters. Figure 4 visualizes the median degree of
Frontiers in Digital Health | www.frontiersin.org 7 May 2021 | Volume 3 | Article 659088Faust et al. Negative Events Through Fitness Trackers
event and gradual return to baseline PB-state across the following
2 weeks.
Associations between coping strategies and clusters are
provided in Table 2. A visual representation of the effect sizes
can be found in Figure 5. In both cases, values are represented
as odds ratios, with values above 1 indicating a higher likelihood
of belonging to Cluster 1, while values below 1 indicate a lower
likelihood of belonging to Cluster 1.
We observe several coping strategies significantly associated
with the cluster in which minimal deviation was observed.
Specifically, we observe that active coping (OR 0.52; 90% CI: 0.31,
0.83), substance use (OR 0.62; 90% CI: 0.41, 0.92), use of emotional
support (OR 0.46; 90% CI: 0.28, 0.72), use of instrumental support
(OR 0.50; 90% CI: 0.32, 0.76), and venting (OR 0.55; 90% CI:
0.33, 0.92) were significantly associated with increased odds
of belonging to Cluster 0. No coping strategies were observed
to be significantly associated with increased odds of belonging
to Cluster 1.
3.3. Common Deviations
Finally, our post hoc analysis focused on the three underlying
components of a person’s PB-state to assess whether common
deviations existed within the response curves. Referring to
Table 3, for Cluster 0, we observed no significant changes in
resting heart rate (P = 0.77), physical activity (P = 0.40), or sleep
(P = 0.52). For Cluster 1, however, a significant increase in resting
heart rate was observed (P = 0.06) with an average increase of 0.66
FIGURE 3 | Coefficients plot of COPE measures associated with event day bpm in the post-event window relative to the pre-event window.
deviation. Points indicate median effect size and black horizontal lines indicate A significant decrease in physical activity was also observed (P =
the range of the 90% credible interval. 0.06) with an average decrease of 4 active minutes per day. No
significant changes in sleep duration (P = 0.81) were observed
for Cluster 1.
TABLE 1 | Coefficients and probability of direction associated with event day
deviation.
Coping strategy Coefficient (90% CI) Probability of direction 4. DISCUSSION
Acceptance 0.56 (0.35, 0.90) 0.972 4.1. Principal Findings
Active coping 0.75 (0.57, 0.98) 0.955 In this article, we aimed to answer two research questions: RQ1:
Behavioral disengagement 0.75 (0.43, 1.32) 0.811 Does an individual’s physiological and behavioral state deviate
Denial 0.36 (0.08, 1.69) 0.868 following a negative life event? RQ2: Does the magnitude and
Humor 1.05 (0.78, 1.42) 0.623
duration of deviation associate with how the individual copes with
Planning 0.59 (0.48, 0.73) 0.999
the negative life event?
Positive reframing 0.80 (0.54, 1.16) 0.847
To address RQ1, we observed two distinct groups of
Religion 0.92 (0.63, 1.37) 0.638
participants, the first group experienced minimal to no deviations
Self-blame 1.12 (0.80, 1.58) 0.722
following a negative life event, while the second group
experienced immediate deviations, with deviations gradually
Self-distraction 0.59 (0.45, 0.78) 0.996
diminishing over the following 2 weeks. These observations
Substance use 1.00 (0.69, 1.45) 0.507
support our hypothesis that, in addition to psychological changes,
Use of emotional support 0.81 (0.60, 1.14) 0.846
physiological and behavioral changes can also manifest in
Use of instrumental support 0.79 (0.59, 1.10) 0.880
response to negative life events. Such variations in response
Venting 0.91 (0.62, 1.31) 0.674
manifestation suggest that multiple data modalities may be
necessary for detecting if and how a person may be impacted by a
negative life event. Moreover, studies that limit these modalities,
deviation for each clustering of response curves across the post- such as considering only a single psychological measure, may fail
event window. Cluster 0 (n = 17) depicts minimal deviation in to identify individuals affected by the event, but who do not react
response to the negative life event, whereas Cluster 1 (n = 28) in a way noticeable by that measure, potentially underestimating
shows an immediate deviation on the day of the negative life the incidence of events. As such, the physical attributes measured
Frontiers in Digital Health | www.frontiersin.org 8 May 2021 | Volume 3 | Article 659088Faust et al. Negative Events Through Fitness Trackers
FIGURE 4 | Clustered response trajectories.
by fitness trackers may be useful in capturing the true incidence TABLE 2 | Coefficients and probability of direction associated with response
of subjects affected within a heterogeneous population. cluster.
An RQ1 post hoc analysis on these physiological and Coping strategy Coefficient (90% CI) Probability of direction
behavioral changes was conducted: breaking down the three
measures which represented a person’s PB-state: resting heart Acceptance 1.05 (0.62, 1.77) 0.559
rate, physical activity, and sleep. Among those who experienced Active coping 0.52 (0.31, 0.83) 0.993
deviations in their PB-state, two common changes were observed: Behavioral disengagement 0.74 (0.43, 1.30) 0.813
increases in resting heart rate and decreases in physical activity. Denial 0.95 (0.35, 2.65) 0.532
The increases in resting heart rate may be reflective of concurrent Humor 0.88 (0.63, 1.22) 0.748
psychological changes as stress and depression have shown to Planning 0.74 (0.44, 1.23) 0.840
elevate heart rate (62, 63). Regarding physical activity, while Positive reframing 1.04 (0.64, 1.69) 0.557
the reduction was minimal, this temporary adoption of more Religion 0.86 (0.64, 1.16) 0.802
sedentary behaviors may be detrimental, as physical activity has Self-blame 1.01 (0.72, 1.44) 0.521
been associated with better mental health (8). These findings Self-distraction 1.03 (0.63, 1.71) 0.544
suggest that overall, the physiological and behavioral changes Substance use 0.62 (0.41, 0.92) 0.984
adopted following negative life events may have a direct impact Use of emotional support 0.46 (0.28, 0.72) 0.999
on one’s physical health. Use of instrumental support 0.50 (0.32, 0.76) 0.998
Moving to RQ2, we discuss the association between PB- Venting 0.55 (0.33, 0.92) 0.980
state deviations and the psychological mechanisms a person
may use to cope with negative life events. Overall, we observed
that the utilization of coping strategies was generally associated Taken together, these observations stress the need to
with less deviation in a person’s immediate response and short- examine physical determinants of health alongside psychological
term trajectory. In particular, we observed “active coping” was determinants when investigating the effects of negative life
significantly associated with less deviation in both characteristics. events. Building upon these findings, future studies hold the
Active coping is defined within the COPE inventory as the opportunity to measure physical and psychological reactions in
extent to which “[the individual has] been concentrating [their] tandem, leading to a stronger understanding of the connections
efforts on doing something about the situation [they’re] in” between physical and psychological responses, providing context
and “taking action to try to make the situation better” (18). for each. Ultimately, by leveraging these holistic views of a
In other words, the willingness of an individual to proactively person’s response to negative life events, we can move closer
engage with and address a problem directly is strongly associated toward mitigating their adverse developments.
with minimized PB-state deviation. This may suggest that taking
steps to remove/alleviate the trauma incurred from a negative 4.2. Comparison With Previous Work
life event, through direct mitigation or solutions, concurrently Early investigations into the effects of negative life events
inhibits or diminishes any physiological or behavioral changes. focused primarily on their psychological consequences (64,
Frontiers in Digital Health | www.frontiersin.org 9 May 2021 | Volume 3 | Article 659088Faust et al. Negative Events Through Fitness Trackers
TABLE 3 | Average change in metric between pre- and post-event stratified by
cluster.
Cluster 0 Cluster 1
Mean change P-value Mean change P-value
Resting heart rate −0.20 bpm 0.77 +0.66 bpm 0.06
Daily physical activity +1.05 min 0.40 −4.10 min 0.06
Nightly sleep duration 0.10 h 0.52 +0.02 h 0.81
physiological responses, such as more blunted physiological
responses to stress (77). While these works are similar to ours in
that they measure the physiological effects of negative stimuli,
the distinction is made on the type of stimuli being studied.
Stress is a constantly applied stimuli where physiological changes
occur while it is being applied, for example, a person may be
stressed for an hour and may experience an elevated heart rate
for that hour. Negative life events, however, are a single stimuli
in which an event transpires. Our work not only captures the
physiological and behavioral changes that may arise while the
event is occurring, it also captures the lasting effects to assess
whether changes persist after the event has occurred.
4.3. Limitations
The analysis presented in this manuscript is based on a small
FIGURE 5 | Coefficients plot of COPE measures associated with response sample of participants, limiting the generalizability of these
cluster. Points indicate median effect size and black horizontal lines indicate findings. As such, the presented results should be considered only
the range of the 90% credible interval. as exploratory, requiring follow-up studies with larger sample
sizes across various cohorts to validate these findings.
Further, our window for observing deviations from a person’s
normal PB-state was limited to the 2 weeks following the negative
65). Finding associations with the development of anxiety, life event. While, we observed gradually diminishing deviations
depression, and PTSD, these works motivated future studies to over this period, future studies would benefit from a longer
focus on why or how these mental health disorders may develop observation period in general, perhaps measuring the years
following such events (66–68). Our study builds upon these leading up to and following negative life events for the assessment
previous works by exploring a less established component of of long-term changes.
the negative life events literature: changes in physical health, Despite pre-event periods containing no significant negative
and by relating these changes to coping strategies, explores how life events, events originally filtered from our analysis may
these changes associate with the better understood components still have been present in these baseline periods. To ensure
of mental health. events occurring in the baseline period did not bias our results,
Several previous works have begun to investigate the effects a supplementary analysis was performed showing minimal
of negative life events on different attributes of physical health. association between the presence of an event in a person’s
These studies have found that levels of physical health can baseline period and whether they experienced PB-state deviations
moderate the negative effects of life events, while negative life in response to their negative life event. A complete detailing of
events can also lead to changes in physical activity and sleep (69– this analysis is available in Supplementary Analysis 1.
72). Our study builds on these investigations through the Finally, it is important to note the limitations of the devices
utilization of fitness trackers to provide objective and immediate used in this study. Comparing the devices to an ECG, high levels
responses to these negative life events and utilizes multiple of accuracy for HR monitoring have been observed, especially
attributes of physical health simultaneously. when the user is at rest (78). For physical activity and sleep,
Previous works have also utilized fitness trackers to measure however, Garmin tended to overestimate daily MVPA and total
event response, primarily, for stress detection (73–76). Such sleep time (79, 80). While, validation studies across larger and
studies have achieved promising performance using continuous more diverse cohorts are needed, current recommendations
measures of heart rate, skin conductance, and skin temperature. suggest these devices provide acceptable levels of accuracy, but
Further, studies have revealed variation in individual’s should be utilized with caution (78–80).
Frontiers in Digital Health | www.frontiersin.org 10 May 2021 | Volume 3 | Article 659088Faust et al. Negative Events Through Fitness Trackers
DATA AVAILABILITY STATEMENT reviewed the manuscript. All authors approved the manuscript
for publication.
The datasets presented in this study can be found in online
repositories. The names of the repository/repositories
and accession number(s) can be found below: FUNDING
http://tesserae.nd.edu/data-sharing/.
This research was supported in part by the Office of the
Director of National Intelligence (ODNI), Intelligence Advanced
ETHICS STATEMENT Research Projects Activity (IARPA), via IARPA Contract No.
2017-17042800007.
The studies involving human participants were reviewed and
approved by University of Notre Dame Institutional Review
Board and through reliance agreements at participating research
ACKNOWLEDGMENTS
universities. The patients/participants provided their written We thank the entire Tesserae team for their
informed consent to participate in this study. invaluable contributions.
AUTHOR CONTRIBUTIONS SUPPLEMENTARY MATERIAL
LF, KF, and NC designed the study. LF, KF, and SL performed The Supplementary Material for this article can be found
the analysis. LF, KF, SM, SD’M, and NC performed the online at: https://www.frontiersin.org/articles/10.3389/fdgth.
interpretation of the data. LF, KF, SD’M, and NC wrote and 2021.659088/full#supplementary-material
REFERENCES 13. Nabi H, Kivimaki M, De Vogli R, Marmot MG, Singh-Manoux A. Positive
and negative affect and risk of coronary heart disease: Whitehall II prospective
1. Wu G, Feder A, Cohen H, Kim JJ, Calderon S, Charney DS, cohort study. BMJ. (2008) 337:a118. doi: 10.1136/bmj.a118
et al. Understanding resilience. Front Behav Neurosci. (2013) 7:10. 14. Scheffer M, Bolhuis JE, Borsboom D, Buchman TG, Gijzel SM, Goulson D,
doi: 10.3389/fnbeh.2013.00010 et al. Quantifying resilience of humans and other animals. Proc Natl Acad Sci
2. Mazure CM, Bruce ML, Maciejewski PK, Jacobs SC. Adverse life USA. (2018) 115:11883–90. doi: 10.1073/pnas.1810630115
events and cognitive-personality characteristics in the prediction of major 15. Böhm M, Reil JC, Deedwania P, Kim JB, Borer JS. Resting heart rate: risk
depression and antidepressant response. Am J Psychiatry. (2000) 157:896–903. indicator and emerging risk factor in cardiovascular disease. Am J Med. (2015)
doi: 10.1176/appi.ajp.157.6.896 128:219–28. doi: 10.1016/j.amjmed.2014.09.016
3. Finlay-Jones R, Brown GW. Types of stressful life event and the onset 16. Li Y, Pan A, Wang DD, Liu X, Dhana K, Franco OH, et al. Impact of healthy
of anxiety and depressive disorders. Psychol Med. (1981) 11:803–15. lifestyle factors on life expectancies in the US population. Circulation. (2018)
doi: 10.1017/S0033291700041301 138:345–55. doi: 10.1161/CIRCULATIONAHA.117.032047
4. Russo SJ, Murrough JW, Han MH, Charney DS, Nestler EJ. Neurobiology of 17. Grandner MA, Hale L, Moore M, Patel NP. Mortality associated with short
resilience. Nat Neurosci. (2012) 15:1475. doi: 10.1038/nn.3234 sleep duration: the evidence, the possible mechanisms, and the future. Sleep
5. Bonanno GA, Diminich ED. Annual research review: positive adjustment to Med Rev. (2010) 14:191–203. doi: 10.1016/j.smrv.2009.07.006
adversity-trajectories of minimal-impact resilience and emergent resilience. J 18. Carver CS. You want to measure coping but your protocol’s
Child Psychol Psychiatry. (2013) 54:378–401. doi: 10.1111/jcpp.12021 too long: consider the brief cope. Int J behav Med. (1997) 4:92.
6. Kuranova A, Booij SH, Menne-Lothmann C, Decoster J, van Winkel R, doi: 10.1207/s15327558ijbm0401_6
Delespaul P, et al. Measuring resilience prospectively as the speed of affect 19. Skinner EA, Zimmer-Gembeck M. Coping. In: Friedman HS, editor.
recovery in daily life: a complex systems perspective on mental health. BMC Encyclopedia of Mental Health. 2nd ed. Oxford: Academic Press (2016). p.
Med. (2020) 18:36. doi: 10.1186/s12916-020-1500-9 350–7. doi: 10.1016/B978-0-12-397045-9.00036-7
7. Yap SC, Anusic I, Lucas RE. Does personality moderate reaction and 20. Carey WB, Crocker AC, Elias ER, Coleman WL, Feldman HM.
adaptation to major life events? Evidence from the British Household Panel Developmental-Behavioral Pediatrics E-Book. Philadelphia, PA: Elsevier
Survey. J Res Pers. (2012) 46:477–88. doi: 10.1016/j.jrp.2012.05.005 Health Sciences (2009).
8. Paluska SA, Schwenk TL. Physical activity and mental health. Sports Med. 21. Mattingly SM, Gregg JM, Audia P, Bayraktaroglu AE, Campbell AT, Chawla
(2000) 29:167–80. doi: 10.2165/00007256-200029030-00003 NV, et al. The Tesserae project: large-scale, longitudinal, in situ, multimodal
9. Swinkels CM, Ulmer CS, Beckham JC, Buse N, Workgroup VMAMR, sensing of information workers. In: Extended Abstracts of the 2019 CHI
Calhoun PS. The association of sleep duration, mental health, and health risk Conference on Human Factors in Computing Systems. Glasgow (2019). p. 1–8.
behaviors among US Afghanistan/Iraq era veterans. Sleep. (2013) 36:1019–25. doi: 10.1145/3290607.3299041
doi: 10.5665/sleep.2800 22. Zhang D, Shen X, Qi X. Resting heart rate and all-cause and cardiovascular
10. Ohrnberger J, Fichera E, Sutton M. The relationship between physical mortality in the general population: a meta-analysis. CMAJ. (2016)
and mental health: a mediation analysis. Soc Sci Med. (2017) 195:42–9. 188:E53–63. doi: 10.1503/cmaj.150535
doi: 10.1016/j.socscimed.2017.11.008 23. Cucherat M. Quantitative relationship between resting heart rate reduction
11. Hays RD, Marshall GN, Wang EYI, Sherbourne CD. Four-year cross-lagged and magnitude of clinical benefits in post-myocardial infarction: a meta-
associations between physical and mental health in the Medical Outcomes regression of randomized clinical trials. Eur Heart J. (2007) 28:3012–9.
Study. J Consult Clin Psychol. (1994) 62:441. doi: 10.1037/0022-006X. doi: 10.1093/eurheartj/ehm489
62.3.441 24. Chen Xj, Barywani SB, Hansson PO, Thunström EÖ, Rosengren A, Ergatoudes
12. Surtees P, Wainwright N, Luben R, Wareham N, Bingham S, Khaw C, et al. Impact of changes in heart rate with age on all-cause death and
KT. Psychological distress, major depressive disorder, and risk of stroke. cardiovascular events in 50-year-old men from the general population. Open
Neurology. (2008) 70:788–794. doi: 10.1212/01.wnl.0000304109.18563.81 Heart. (2019) 6:e000856. doi: 10.1136/openhrt-2018-000856
Frontiers in Digital Health | www.frontiersin.org 11 May 2021 | Volume 3 | Article 659088You can also read