Expect more Experience more - RESULTS PRESENTATION For the year ended 29 February 2020 - Balwin Properties
←
→
Page content transcription
If your browser does not render page correctly, please read the page content below
Expect more
Experience more

                     RESULTS
               PRESENTATION
    For the year ended 29 February 2020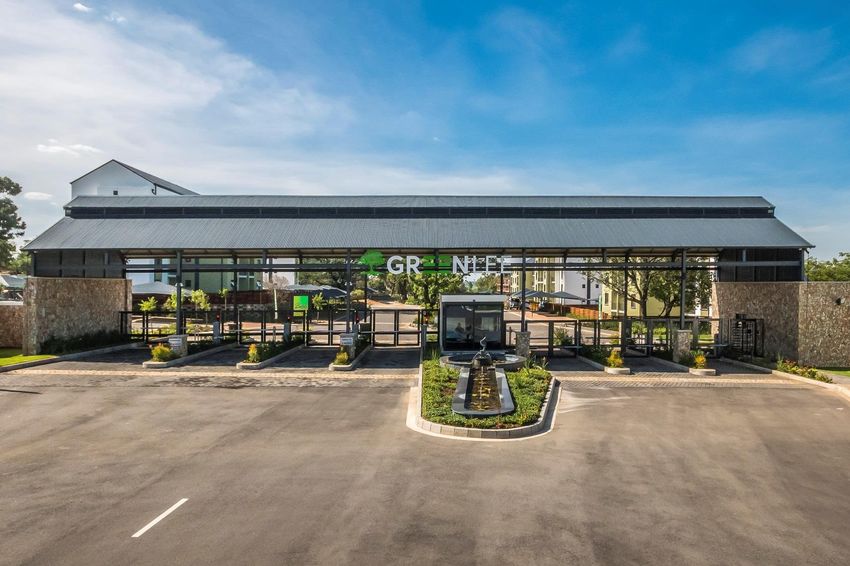
AGENDA

   OPERATIONAL OVERVIEW

   OPERATING MODEL, GOVERNANCE & FINANCIAL OVERVIEW

   LOOKING FORWARD

   ANNEXURES
OPERATIONAL OVERVIEW
              Steve Brookes
     Chief Executive Officer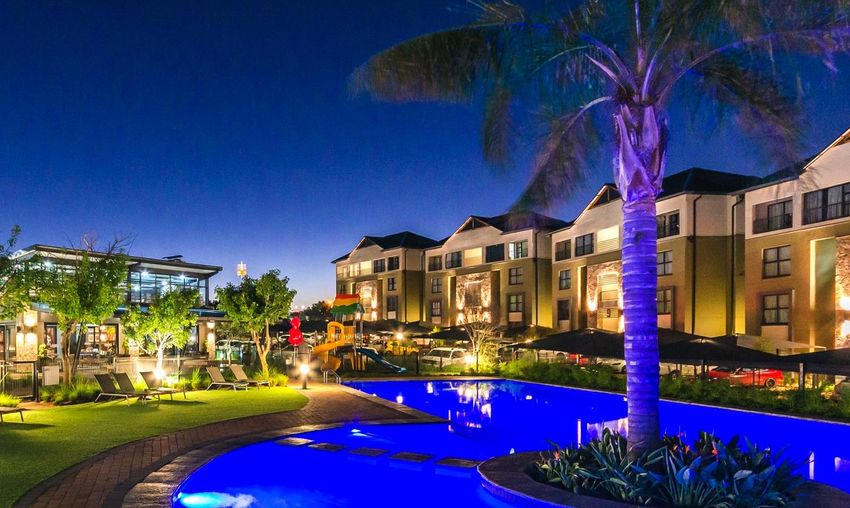
OPERATIONAL HIGHLIGHTS
Successful modification of sales strategy at Green project developments
Conclusion of sales agreement for Izinga Eco Estate, Umhlanga
Launch of Munyaka, Waterfall – record sales achieved
Registration of over 16 000 apartments as EDGE certified
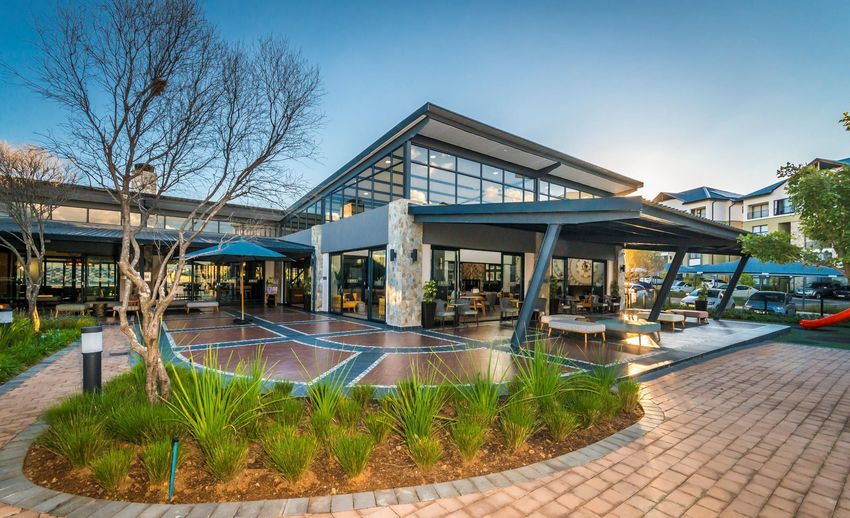
Launch of first “6 Star” Green rated Lifestyle Centre at The Reid
Four awards for the exceptional quality of the developments and creative
design recognised at the Africa and Arabia Property awards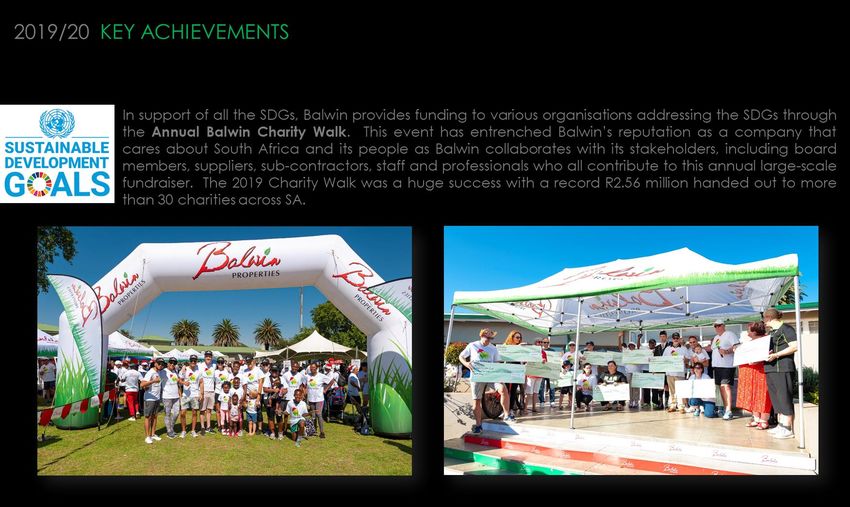
OPERATIONAL REVIEW

 Strong demand for one- and two-bedroom apartments (74% of total sales)
 Successful modification of sales strategy at Green project developments
 644 apartments pre-sold for future financial years and thus not recorded in revenue
COVID 19 CONSIDERATION

OPERATIONAL RESPONSE TO COVID-19
  Managing the impact of Covid-19 to assess the risks and opportunities to the business
  Implemented measures to manage risk to all staff and personnel
  Contingency plans formulated to deal with any operational disruptions
  Continued sales demand during lockdown, > 200 apartments sold since lockdown

FINANCIAL RESPONSE TO COVID-19
  Prioritisation of cash and liquidity
   •   Responsive to planned development programme
   •   Leverage off developments with strong pre-sales
   •   Deferment of dividend due to COVID-19 uncertainty and cash preservation in mind
  Implemented cost saving measures in developments
  Multiple cash flow forecast scenarios stress tested - Supports sufficient cash reserves to withstand
  a lockdown period in excess of 12 months
MONTHLY SALES
                          MONTHLY SALES SUMMARY (MARCH 2019 - FEBRUARY 2020)
450

400                                                                                             401

350
                                                                                                                   328
300                           299

                                                                                     261                                     AVERAGE SALES
250                                                                                                                               239
          234       239
                                                               224
                                                                           207                                               215
200
                                        190        192

150

100
                                                                                                          81
 50

  0
      Mar-19    Apr-19    May-19    Jun-19    Jul-19      Aug-19       Sep-19    Oct-19     Nov-19    Dec-19   Jan-20    Feb-20

                                                         Total Sales        Average Sales

Note - sales include all apartments contracted and do not necessarily relate to the financial period or next financial
period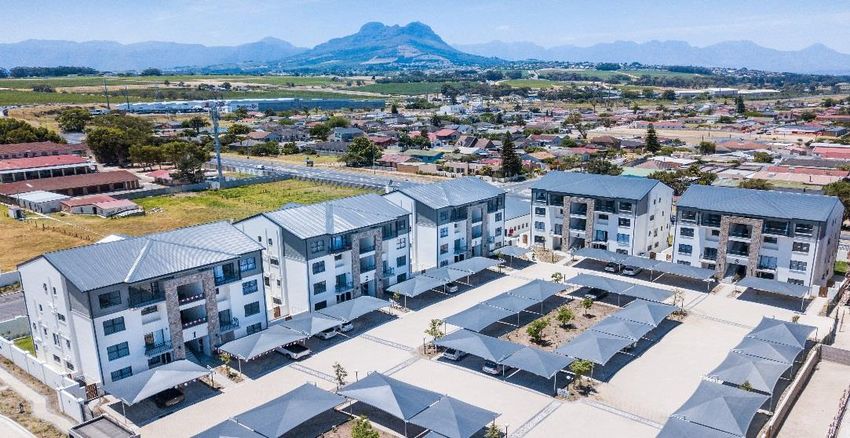
OPERATING MODEL, GOVERNANCE & FINANCIAL OVERVIEW
                                    Jonathan Weltman
                                 Chief Financial Officer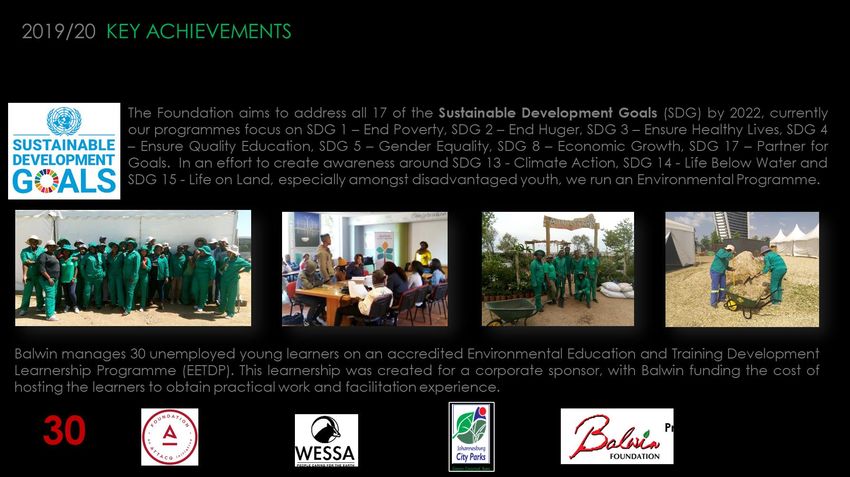
OPERATING MODEL
FINANCIAL AND OPERATIONAL SUCCESS DEPENDS ON CONTINUOUS
DEVELOPMENT
                                Development of large-scale residential estates
                                in key target nodes
                                Selling approximately 25 apartments per
                                location per month
                                Targeting an average profit margin of
                                approximately 35% over the lifecycle of each
                                project
                                Drive efficiencies through turnkey approach to
                                development
                                Maintaining costs and cash preservation
                                Secured approximate 8 year development
                                pipeline of 29 487 apartments
                                Execute on existing pipeline (in key target
                                locations)
                                Focus on environmental management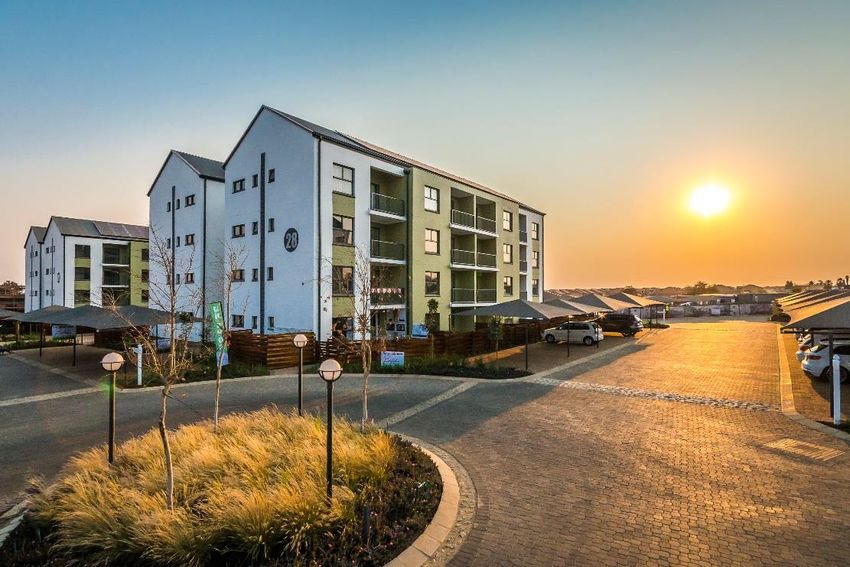
OPERATING MODEL
TURNKEY APPROACH
GOVERNANCE PROCESS
DEVELOPMENT OPPORTUNITIES
 Development opportunities identified
 Internal due diligence process followed:
  •   Costs
  •   Infrastructure
  •   Zoning
  •   Independent review of nodal
      residential demand
 Presented for approval to:
  •   Executive Committee
  •   Transactions Committee
  •   Board for final approval and
      implementation
FINANCIAL OVERVIEW 2 715 11% Apartments handed over (FY19: 2 437) R476.5 mil 54% Cash resources (FY19: R329.4 mil) R 2 914 million 11% Revenue R 586 million 9% EBITDA R 411 million 9% Profit for the period 88 cents 8% Basic & headline earnings per share 631 cents 11% Net asset value per share
SUMMARISED STATEMENT OF PROFIT
   OR LOSS AND OTHER COMPREHENSIVE INCOME
                                                                         GROUP
                                                        For the year ended       For the year ended
                                                          29 February 2020         28 February 2019
                                                                       R'000                     R'000
Revenue                                                            2 914 453                2 613 905
Cost of sales                                                    (2 124 703)              (1 826 024)
Gross profit                                                         789 750                  787 881
Other income                                                          19 847                    16 002
Operating expenses                                                 (235 613)                (173 808)
Operating profit                                                     573 984                  630 075
Investment revenue                                                    13 673                     4 590
Net finance income                                                  (12 643)                   (6 176)
Share of profit of associate                                             322                         -
Profit before tax                                                    575 336                  628 489
Taxation                                                           (163 976)                (176 106)
Profit for the year                                                  411 360                  452 383
Other comprehensive income                                                36                       103
Total comprehensive income                                           411 396                  452 486

Profit attributable to:
Owners of the parent                                               411 610                           -
Non-controlling interest                                             (250)                           -
                                                                   411 360                           -
Total comprehensive income attributable to:
Owners of the parent                                               411 646                           -
Non-controlling interest                                             (250)                           -
                                                                   411 396                           -
Basic and diluted earnings per share
Basic                                         (cents)                88.02                      95.82
Diluted                                       (cents)                87.17                      95.80

Key ratios:
Gross profit margin                                                27.10%                     30.14%
Total comprehensive income/revenue                                 14.12%                     17.31%
Effective tax rate                                                 28.50%                     28.02%
APARTMENTS HANDED OVER BY REGION
Apartments handed over FY20 by region
Green
Kwa-zulu Natal Developments
7% 11%
Johannesburg
40%
Western Cape
29%
Tshwane
13%
Johannesburg Tshwane Western Cape
Kwa-zulu Natal Green Developments
Apartments handed over FY19 by region
Kwa-zulu Natal Green
2% Developments
6%
Western Cape
Johannesburg
28%
48%
Tshwane
16%
Johannesburg Tshwane Western Cape
Kwa-zulu Natal Green DevelopmentsAPARTMENTS HANDED OVER IN FY20 Johannesburg Total: 1 092 Kikuyu 367 The Reid 263 Amsterdam 227 The Polofields 150 The Whisken 84 Malakite 1 Tshwane Total: 361 The Blyde Riverwalk 361 Western Cape Total: 774 De Zicht 336 The Jade 184 The Huntsman 114 Paardevlei Lifestyle Estate 71 Fynbos 55 Paardevlei Square 13 The Sandown 1 KwaZulu-Natal Total: 198 Ballito Hills 198 Green Developments Total: 290 Greenpark 209 Greenlee 81 TOTAL 2 715
FINANCIAL REVIEW
REVENUE
    Increased by 11% - due to increase in the number of apartments handed over to
    2 715 (FY19: 2 437)
    Average selling price per apartment remains in line with prior year, the lack of
    growth is due to increased inclusion of revenue from the Green development
    apartments

GROSS PROFIT
    Gross profit margin of 27% (FY19: 30%) – Elite developments continue to negatively
    impact the margin.
    GP margin excl. Elite developments is 31%
    The contraction is as a result of:
     •    Reduced profitability realised on elite model developments
     •    Increased marketing campaigns in response to continued depressed
          economic conditions
SOURCES OF REVENUE (CORE/ELITE/GREEN)
2020 SOURCES OF REVENUE
Green Model
Elite Model 6%
15%
Core Model
79%
Core Model Elite Model Green Model
2019 SOURCES OF REVENUE
Green Model
Elite Model 3%
19%
Core Model
78%
Core Model Elite Model Green ModelAVERAGE SELLING PRICE
Core business model
29 February 2020 28 February 2019
Ave price %
Apartment type Average price Number apartments Average price Number apartments
change
1 Bedroom R860 973 3% 1 071 R835 991 971
2 Bedroom R1 376 112 2% 607 R1 344 537 467
3 Bedroom R1 615 868 3% 513 R1 573 567 555
TOTAL 2 191 1 993
Revenue analysis (Core business model) Revenue analysis (Core business model)
Year ending 29 February 2020 Year ending 29 February 2019
R1 615 868
R1 573 567
23%
28%
R860 973 R835 991
49% 49%
R1 376 112
28% R1 344 537
23%
1 Bedroom 2 Bedroom 3 Bedroom 1 Bedroom 2 Bedroom 3 BedroomAVERAGE SELLING PRICE
Elite model
29 February 2020 28 February 2019
Ave price %
Apartment type Average price Number apartments Average price Number apartments
change
1 Bedroom - - - 962 193 48
2 Bedroom R1 853 296 11% 71 R1 665 831 52
3 Bedroom R2 163 929 -2% 159 R2 207 002 198
4 Bedroom R4 034 928 -25% 4 R5 399 910 2
TOTAL 234 300
Revenue analysis (Elite business model) Revenue analysis (Elite business model)
Year ending 29 February 2020 Year ending 29 February 2019
R2 163 929 R5 399 910 R962 193
2% 1% 16%
R1 529 910
30%
R1 665 831
17%
R2 207 002
66%
R1 857 916
68%
2 Bedroom 3 Bedroom 4 Bedroom 1 Bedroom 2 Bedroom 3 Bedroom 4 BedroomAVERAGE SELLING PRICE
Green model
29 February 2020 28 February 2019
Ave price %
Apartment type Average price Number apartments Average price Number apartments
change
1 Bedroom R538 170 7% 107 500 876 60
2 Bedroom R720 744 14% 158 632 381 54
3 Bedroom R819 001 4% 25 784 762 30
TOTAL 290 144
Total Apartments 2 715 2 437
Revenue analysis (Green business model) Revenue analysis (Green business model)
Year ending 29 February 2020 Year ending 29 February 2019
R819 001
9% R784 762
21%
R538 170
R500 876
37%
42%
R720 744
R632 381
54%
37%
1 Bedroom 2 Bedroom 3 Bedroom 1 Bedroom 2 Bedroom 3 Bedroom
Modified sales strategy in respect of Green model due to strong demand from investors and homebuyers. FY2019 144 sales to
property fund, FY2020 96 sales to property fund with balance of sales due to change in sales strategy.FINANCIAL REVIEW
OPERATING EXPENSES
Operating costs increased by R62 million from the prior year mainly due to:
• Increase in head count and salary related costs to grow middle to top
management team
• Increase in marketing costs in order to drive sales
Cost management remains a key focus area for management
EARNINGS PER SHARE
8% decrease from prior year to 88 cents (FY19: 96 cents)
FUNDING STRUCTURE AND COSTS
Development finance is obtained on a phase-by-phase basis
Secured against the pre-sales of the specific phase being financed
Top structure funding obtained at an approximate loan to cost of 70%
Land funding obtained at a value of 50% to 70% of cost
Focus on funding of infrastructure costs – obtained infrastructure funding in FY2020
Long term debt to equity ratio at 27% (FY19: 25%)SUMMARISED STATEMENT OF
FINANCIAL POSITION
GROUP
For the year ended For the year ended
29 February 2020 28 February 2019
R'000 R'000
Non-current assets 100 026 101 185
Current assets 4 507 714 4 298 926
Developments under construction 3 369 972 3 042 919
Cash and cash equivalents 476 532 329 382
Other current assets 661 210 926 625
Total assets 4 607 740 4 400 111
Shareholders’ equity 2 951 640 2 653 856
Non-controlling interest (250) -
Non-current liabilities 252 639 375 473
Other non-current liabilities # 102 805 -
Current liabilities 1 300 906 1 370 782
Development finance 1 167 057 1 148 208
Other current liabilities 133 849 222 574
Total equity and liabilities 4 607 740 4 400 111
# Other non-current liabilities relates to deferred tax and the long term portion of the lease liabilityDEVELOPMENTS UNDER CONSTRUCTION
(LAND VS TOP STRUCTURES)
29 February 2020 28 February 2019
R’000 R’000
Construction costs R1 307 511 R1 241 664
Land and land contribution costs R1 560 220 R1 273 835
Development rights R502 240 R527 420
TOTAL 3 369 972 3 042 919
Work in progress FY20 Work in progress FY19
Development Development
rights rights
15% 17%
Construction Construction
costs costs
39% 41%
Land and land
Land and land
contribution
contribution
costs
costs
42%
46%
Construction costs Land and land contribution costs Development rights Construction costs Land and land contribution costs Development rightsSUMMARISED STATEMENT OF
CASH FLOWS
GROUP (R’000)
For the year ended For the year ended
29 February 2020 28 February 2019
R'000 R'000
Cash flow from operating activities
Cash generated from operations 581 724 285 825
Interest Income 12 680 4 590
Finance costs (95 258) (43 443)
Taxation paid (104 514) (145 394)
Net cash generated from operating activities 394 632 101 578
Net cash used in investing activities (19 735) (45 072)
Net cash (used in)/ generated from financing activities (227 747) 172 843
Total cash movement for the period 147 150 229 349
Cash at the beginning of the period 329 382 100 033
Total cash at the end of the period 476 532 329 382FUNDING STRUCTURE
For the year ended For the year ended
29 February 2020 28 February 2019
R'000 R'000
Total liabilities 1 656 350 1 746 255
Non-current development loans 252 639 375 473
Other non-current liabilities # 102 805 -
Current liabilities* 1 300 906 1 370 782
Equity 2 951 640 2 653 856
All land and infrastructure debt to equity ratio 27% 25%
Debt to equity ratio 9% 14%
Average cost of borrowing 9.96% 10.25%
# Other non-current liabilities relates to deferred tax and the long term portion of the lease liability
* Development finance is funded on a phase-by-phase basis secured against pre-salesLOOKING FORWARD
Steve Brookes
Chief Executive OfficerTHE FUTURE Emphasis on cash preservation and prudent capital allocation Focus to deliver on existing land Focus on the opportunities and growth of the Green project brand Green ratings from GBCSA for lifestyle centres and net zero certification – growth in Green bond offerings Commitment to unique lifestyle offering and the opportunity to expand on relationship with Crystal Lagoons to bring the beach life to clients
BALWIN FOUNDATION
 Core Focus

        EDUCATION:
  01    Scholarships, Bursaries and Learnerships to
        support and empower the youth in areas                             01
        related to the building industry.                              EDUCATION

        DEVELOPMENT:
  02    Building related trade training skills development
        and short courses to increase employability for
                                                                       Registered
                                                                         in 2016.
        the unemployed from local communities, as well                   Started
        as development of SMMEs in order to promote job                operating in
        creation.                                                       May 2017.

                                                               02                       03
  03    FUNDING:
        Obtain various sources of sustainable funding in     DEVELOPMENT              FUNDING
        order to fund various causes and develop local
        communities, schools, sportsgrounds etc.
BALWIN FOUNDATION
03
FUNDNANNEXURES
DEVELOPMENT PIPELINE AS AT 29 FEBRUARY 2020

                                                                                                                                               Total
                          Expected        Expected                                                                           Total
                                                                                        Total             Total                           apartments
                       commencement        date of                   Total apartments                                   apartments                     Total unsold    Balwin
         Development                                    Status (*)                    apartments       apartments                         sold but not
                           date of      Completion of                in development                                     recognised                     apartments     pipeline
                                                                                         sold          registered                         recognised
                         construction    construction                                                                    in revenue
                                                                                                                                           in revenue
Waterfall
Kikuyu                 Commenced        Nov 2021            A                  1 270         913              859               881                 32          357          389

The Polofields         Commenced        Jun 2023            A                  1 512         686              651               655                 31          826          857

Munyaka                Commenced        May 2028            A                  4 972               -                -                 -              -        4 972        4 972

Total                                                                          7 754        1 599            1 510             1 536                63        6 155        6 218
Johannesburg East
The Reid               Commenced        May 2022            A                  1 294         468              438               453                 15          826          841

Westlake 2             TBC              TBC                  I                   312               -                -                 -              -          312          312

Total                                                                          1 606         468              438               453                 15        1 138        1 153
Johannesburg North
Amsterdam              Commenced        Complete            C                  1 040         950              905               933                 17           90          107

The Whisken            Commenced        Jun 2022            A                  1 490         422              422               422                  -        1 068        1 068

Total                                                                          2 530        1 372            1 327             1 355                17        1 158        1 175
Johannesburg South
Majella Park           TBC              TBC                  I                   280               -                -                 -              -          280          280

Total                                                                            280               -                -                 -              -          280          280
KwaZulu Natal
Ballito Hills          Commenced        Feb 2024            A                  1 320         460              241               259               201           860        1 061

Ballito Creek          TBC              TBC                  I                 1 872               -                -                 -              -        1 872        1 872

Izinga                 TBC              TBC                  I                 2 505               -                -                 -              -        2 505        2 505

Marshall Dam           TBC              TBC                  I                 1 092               -                -                 -              -        1 092        1 092

Total                                                                          6 789         460              241               259               201         6 329        6 530
DEVELOPMENT PIPELINE AS AT 29 FEBRUARY 2020
Total
Expected Expected Total
Total Total apartments
commencement date of Total apartments apartments Total unsold Balwin
Development Status (*) apartments apartments sold but not
date of Completion of in development recognised apartments pipeline
sold registered recognised
construction construction in revenue
in revenue
Tshwane
The Blyde Commenced Feb 2028 A 3 580 799 612 759 40 2 781 2 821
Total 3 580 799 612 759 40 2 781 2 821
Western Gape
De Zicht Commenced Nov 2020 A 876 701 649 668 33 175 208
Paardevlei Lifestyle Estate Commenced Aug 2021 A 388 208 175 176 32 180 212
Paardevlei Square Commenced Complete C 87 87 87 87 - - -
The Jade Commenced Complete C 432 432 430 431 1 - 1
The Sandown Commenced Complete C 636 636 636 636 - - -
The Huntsman Commenced Nov 2023 A 1 044 128 55 110 18 916 934
Fynbos Commenced Feb 2024 A 1 116 136 - 52 84 980 1 064
Zevenwacht TBC TBC I 854 - - - - 854 854
Total 5 433 2 328 2 032 2 160 168 3 105 3 273
Green Projects
Greenlee Commenced Oct 2024 A 1 816 190 - 75 115 1 626 1 741
Greenpark Commenced May 2022 A 1 288 377 269 352 25 911 936
Greencreek Commenced March 2026 A 1 872 - - - - 1 872 1 872
Greenwood TBC TBC I 1 760 - - - - 1 760 1 760
Greenbay Aug 2020 Nov 2028 I 1 728 - - - - 1 728 1 728
Total 8 464 567 269 427 140 7 897 8 037
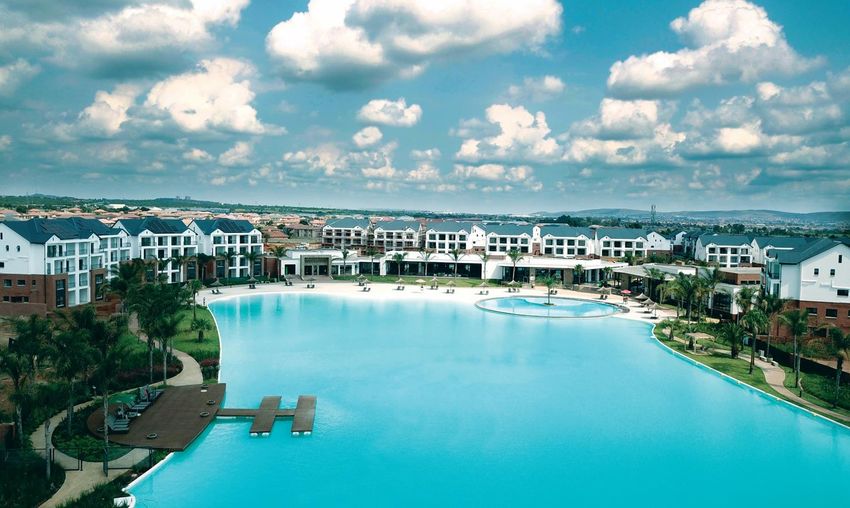
Grand Total 36 436 7 593 6 429 6 949 644 28 843 29 487CORPORATE OVERVIEW Specialist, national residential property developer of large-scale sectional title estates Focus on high quality, affordable apartments with an innovative and all inclusive lifestyle offering for clients Currently developing 2 000 to 3 500 apartments per year – capacity is approximately 5 000 apartments per year Estates typically consist of between 1 000 and 2 000 apartments – larger estates developed where market demand and infrastructure allow Focus on high-density, high-growth nodes across key metropolitan areas in Johannesburg, Tshwane, Western Cape and Kwa-Zulu Natal Approximate 8 year development pipeline of 29 487 apartments Lifestyle centres typically include free Wi-Fi, a wellness spa, restaurant, gym, squash court, running track, action sports field, games room, cinema room, swimming pools, playgrounds, laundromat and a concierge
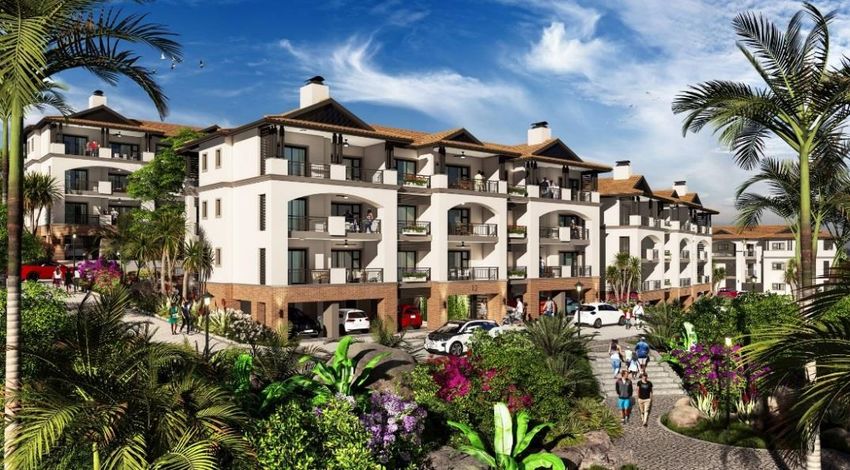
BUSINESS MODEL
CORE BUSINESS MODEL

 Quality, affordable build-to-sell product
 One-, two-, and three-bedroom four storey
 walk up apartments
 Prices range from R599 900 to R1 999 900
 focusing on the middle income population
 Developments located in high density, high
 growth nodes across key metropolitan areas
 Benefits from economies of scale, in-house
 construction and management
 Developed on phase-by-phase basis
 Dynamic product allows for block
 configuration change to respond to market
 Exclusive lifestyle offering to clients as an all
 inclusive value-added service
BUSINESS MODEL
GREEN PROJECT MODEL

 Model targets a lower LSM market than
 the core model
 Offers flexibility to determine preferential
 sales strategy (sell to market or sell to
 individual investor) to maximise returns
 Developed on a phase-by-phase
 approach
 Distinctive architecture that is different
 to the core business model but
 synonymous with Balwin quality
 Residents have access to lifestyle
 features associated with Balwin brand
BUSINESS MODEL
ELITE MODEL DEVELOPMENTS
  Two elite model developments, The Polo Fields (Waterfall) and Paardevlei Lifestyle Estate
  (Somerset West)
  Apartments built to higher specifications
  Prices range from R1 999 900 to R2 999 900
  Developments built on existing land in selected nodes and follow the same phase-by-phase
  approach
  Balwin does not intend to continue the elite model developments in the current market
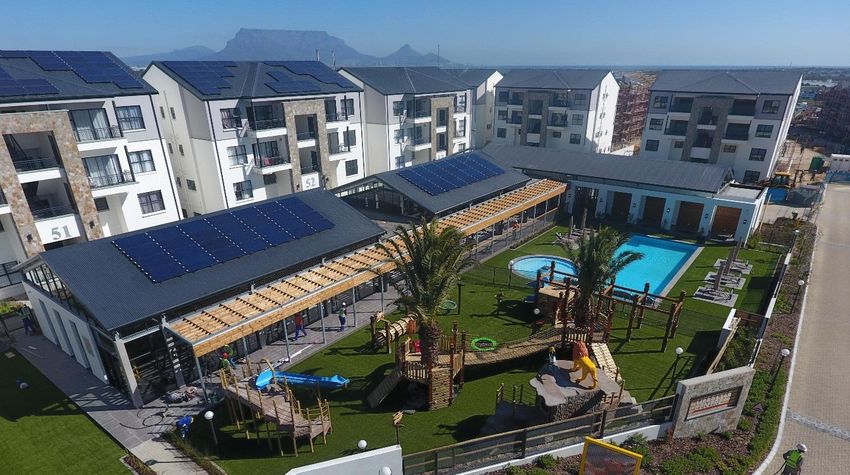
BUSINESS MODEL
ANNUITY INCOME

   Leverage off asset base and expanding service offering to clients
   Partnerships established to provide high-speed fibre connectivity and solar installation which
   generates renewable energy
   Complimentary to Balwin’s business model and enhance the lifestyle offering to clients
   Limited additional construction costs necessitated to generate annuity returns
INVESTMENT CASE

 High gross margin for a listed residential property developer due to in-house construction
 management, in-house sales and strong budget controls

 Long-term development pipeline in key strategic locations

 High barriers to entry – low levies and efficiencies obtained through economies of scale

 Phased development where the rate of construction is matched to the rate of sales

 Proven and flexible business model for large-scale developments

 Strong management with more than 23 years experience, management are the founding
 directors and the majority shareholders, therefore management is aligned to the interests of
 other shareholders

 Long-term relationship with suppliers and sub-contractors nationally which results in cost savings
 and high quality homes

 Well positioned to address the undersupply of quality, affordable housing in the middle market
 income market

 Differentiation to market through Balwin’s innovative approach to environmental management
BALWIN FOUNDATION
BALWIN FOUNDATION
CONTACT DETAILS

Stephen Brookes           Jonathan Weltman
Chief Executive Officer   Chief Financial Officer
Tel: +27 11 450 2818      Tel: +27 11 450 2818
You can also read