Exploratory Analysis of an EU Sink and Restoration Target
←
→
Page content transcription
If your browser does not render page correctly, please read the page content below
www.oeko.de

              Exploratory Analysis
              of an EU Sink and
              Restoration Target

                                                   Berlin, 18.03.2021

              Commissioned by Greenpeace Germany

              Authors                              Contact
                                                   info@oeko.de
                                                   www.oeko.de
              Dr. Hannes Böttcher
              Judith Reise                         Head Office Freiburg
              Dr. Klaus Hennenberg                 P. O. Box 17 71
              Oeko-Institut e.V.                   79017 Freiburg

                                                   Street address
                                                   Merzhauser Straße 173
                                                   79100 Freiburg
                                                   Phone +49 761 45295-0

                                                   Office Berlin
                                                   Borkumstraße 2
                                                   13189 Berlin
                                                   Phone +49 30 405085-0

                                                   Office Darmstadt
                                                   Rheinstraße 95
                                                   64295 Darmstadt
                                                   Phone +49 6151 8191-0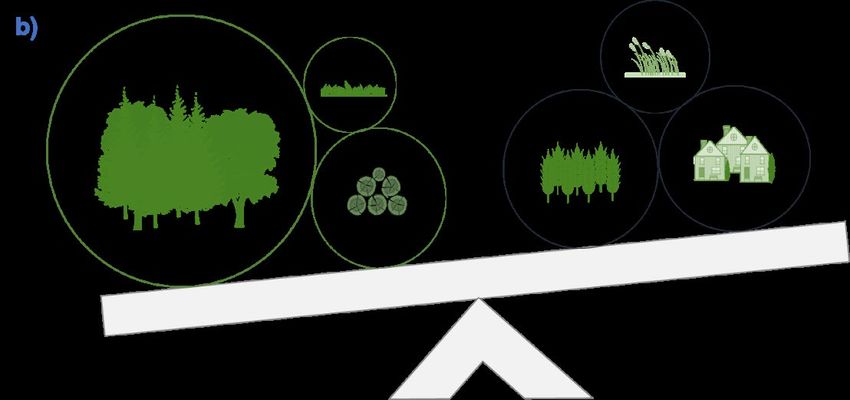
Exploratory Analysis of an EU Sink and Restoration Target

Table of Contents

1            Motivation and aim of the report                                                  5
2            Scientific background                                                             6
2.1          What is the role of natural sinks in the global carbon cycle?                     6
2.2          What types of carbon pools exist and what is their current state to act as natural
             sinks?                                                                            7
2.3          What are risks associated with carbon pools?                                      8
2.4          How are these natural sinks covered by current policy and legislation?            9
2.5          What are existing restoration and conservation targets?                          10
3            Net land sink and restoration targets: potentials and constraints                10
3.1          What is the EU net sink potential for the land use sector?                       10
3.1.1        Current sinks and emission sources of the land use sector                        10
3.1.2        Options for emission reduction and enhancement of carbon storage and their potential
                                                                                               13
3.1.3        Estimate of the total EU net sink potential for the land use sector              18
3.2          What are conditions and pathways for realising net sink potentials?              18
3.2.1        A short review of scenarios of net sink potentials                               18
3.2.2        Enabling conditions and constraints for realising net sink potentials            21
3.2.3        Specific accounting challenges for assessing the net sink                        22
4            Towards a proposal for a land net sink and restoration target                    23
4.1          What are key challenges regarding the role of the net sink for achieving climate
             neutrality?                                                                     23
4.2          What are key principles for a net sink and restoration target?                   24
4.3          What are important technical elements for the architecture of the net sink and
             restoration target?                                                            25
4.3.1        National targets                                                                 25
4.3.2        A framework for consistent and transparent monitoring                            26
4.3.3        Robust accounting approaches to address non-permanence and volatility            26
4.3.4        Additional metrics as performance indicators to support compliance and environmental
             integrity                                                                         28
4.3.5        Creation of adequate funding opportunities for realising sink potentials         28
5            Aligning the net sink and restoration target with land use related EU
             policies                                                                         29

                                                                                               3
Working paper
5.1 How does the LULUCF framework need to be adapted towards a net sink and
restoration target? 29
5.1.1 Flexibilities between sectors 29
5.1.2 Stringency of accounting rules 30
5.1.3 Linkages to Agriculture 30
5.2 What are linkages to the EU Renewable Energy Directive? 31
5.3 What are linkages to the EU’s communication on stepping up EU action to
protect and restore the world’s forests? 33
5.4 What are linkages to the EU Adaptation Strategy? 33
5.5 What are linkages to the EU Biodiversity Strategy? 34
6 Conclusions 35
List of References 39
4Exploratory Analysis of an EU Sink and Restoration Target
1 Motivation and aim of the report
In September 2020 the European Commission (EC) proposed to increase the 2030 greenhouse gas
(GHG) emission reduction target to at least -55 % compared to 1990 levels. While the EU policy
framework originally excluded the land use sector, the proposal includes now the full scope of GHG
emissions and carbon removals. According to the European Commission, the target forms an interim
goal towards a climate-neutral EU and updates its Nationally Determined Contribution (NDC)
under the Paris Agreement. However, the European Parliament demanded a more ambitious target
of 60 % emission reduction 1, while scientific evidence also indicates that the current EU target does
not meet the commitments required under the Paris Agreement. According to projections by CAN
(2020) a 65 % emission reduction target would be required to close the gap, together with an
additional increase in voluntary climate funding to address the historic responsibility.
Carbon sinks have become more relevant with the Paris Agreement that sets the target of “holding
the increase in the global average temperature to well below 2°C above pre-industrial levels and
pursuing efforts to limit the temperature increase to 1.5°C above pre-industrial levels” by rapid
reductions in GHG emissions and finally achieving “a balance between anthropogenic emissions by
sources and removals by sinks of GHG in the second half of this century”. The only sector
providing options for natural carbon sinks is the sector on Land Use, Land Use Change and
Forestry (LULUCF). Carbon sinks are created by biomass growth and the long-term storage of
carbon in vegetation, soils and products. However, the sector accounts also for carbon emissions
from biomass use, land conversion and vegetation removal. Moreover, the sector suffers from drastic
climate and environmental change, potentially leading to reduced rates of carbon uptake and
increased emissions. A contribution to the balance of emissions and removals as anticipated
by the Paris Agreement can only be achieved through a long-term overall net negative carbon
balance of the land sector. The inclusion of the full scope of anthropogenic emissions and removals
into the -55 % GHG reduction target implies the need for a net carbon sink target for this sector. If
left undefined, it would be determined by the degree of GHG emission reductions to be achieved in
other sectors and remaining emissions in 2030.
In 1990 the net sink in EU27 amounted to 275 Mt CO2/year (EU 2020). In 2006 the net removals of
carbon by the sector peaked at 355 Mt CO2/year and have since then been declining to again 280 Mt
CO2/year in 2018. In the scope of the -55 % target, the sector has been included into the base year
1990. Since the net sink is still of similar size compared to 1990, this implies that emission reductions
by other sectors need to be even less than -55 % to achieve the overall target. Instead, if all sectors
achieved a -55 % emission reduction compared to 1990, the sink could even be reduced to 124 Mt
CO2/year, still meeting the EU target and counteracting the necessary enhancement of the sink
towards 2050 for meeting a global 1.5°C target. The risk for environmental integrity by integrating
LULUCF into the overall target calls for an even more ambitious overall target (far beyond -55 %) to
compensate for a decreased ambition level due to this integration. Moreover, the LULUCF sector
needs to have a separate target for ensuring that land-based emissions are reduced, sinks are
maintained or enhanced where possible.
In the Impact Assessment accompanying the 2030 Climate Target Plan, the EC discussed options
for changes to the treatment of LULUCF emissions and removals that are currently handled by the
LULUCF Regulation (EU) 2018/841 and opportunities for increasing the sink. The rules for
accounting emissions and removals of the sector is crucial for providing incentives to
1
Press release: EU climate law: MEP want to increase 2030 emissions reduction target to 60 %
5Working paper
Member States (MS) to implement management changes but also for ensuring environmental
integrity of the overall emission reduction target.
If these rules are designed wisely and transparently and interchangeability of fossil and biogenic
carbon is prohibited to the degree necessary to ensure environmental integrity, there is the scope
and the opportunity for defining a net sink target for managed land that supports adaptation needs
in the sector and addresses requirements for the protection and restoration of biodiversity. Hence,
realizing the net sink target is directly linked to the implementation of restoration and protection of
carbon rich ecosystems and should therefore be defined as a combined net sink and restoration
target.
In a public consultation 2 in early 2021, the EC looked for stakeholder input on the revision of the
LULUCF Regulation. This paper presents a short exploratory analysis that discusses
important elements for a separate EU land net sink and restoration target that defines a
realistic net sequestration potential within the EU and rules that incentivise the achievement
of such a target. This should be aligned with adaptation needs and existing EU biodiversity
and ecosystem restoration targets and regulations - including the EU Biodiversity Strategy.
2 Scientific background
2.1 What is the role of natural sinks in the global carbon cycle?
Carbon is constantly exchanged among the main global carbon pools, the atmosphere, the oceans
and terrestrial systems which is known as carbon fluxes comprising the global carbon cycle. The
carbon circulation appears on very different timescales from sub-daily to millennia and even much
longer considering exchanges with geologic reservoirs (Archer et al. 2009). The burning of fossil
fuels, deforestation and other land-use change activities release CO2 emissions in a very short time
compared to the rather long time of carbon sequestration in stable pools. Natural carbon sinks are
essential for decreasing the CO2 concentration in the atmosphere by storing carbon in chemical
compounds by photosynthesis or absorption through pressure differences for an indefinite time
(IPCC 2013). Today terrestrial and marine ecosystems remove half of all anthropogenic emissions
globally (Friedlingstein et al. 2019) by biomass growth and storage and mineral compounds as well
as geological formations.
The aim of the Paris Agreement of balancing emissions and removals by 2050 can only be achieved
if emissions are cut drastically and natural sinks are restored on a large scale. A net sink to
compensate for remaining emissions that cannot be avoided needs to be long-term, of high
permanence and contributing to overall environmental integrity. Long-term carbon storage is
the main challenge to maintain and increase the net sink potential in forests, wetlands and soils and
includes both: promoting long-term carbon sequestration and thereby enhancing the duration
of carbon storage in biomass and soil pools as well as reducing emissions from those in the
short-term.
2
https://ec.europa.eu/info/law/better-regulation/have-your-say/initiatives/12657-Land-use-land-use-change-
and-forestry-review-of-EU-rules/public-consultation
6Exploratory Analysis of an EU Sink and Restoration Target
2.2 What types of carbon pools exist and what is their current state to act as natural
sinks?
The main physical pools of the terrestrial system in Europe are above- and below-ground living
biomass, litter and dead wood as well as soil organic carbon (SOC) in organic and mineral soils
in different land use categories, such as forests, agricultural land or settlements.
Forests store carbon in their living biomass that can have a long lifetime depending on the tree
species, biogeographic region and occurrences of disturbances like fire or insect calamities. The
EU27+UK forests cover 167 Mha (EU 2020) with a carbon stock of 9.8 Gt C in living biomass, which
is 36 % of the total forest carbon pool in 2020 (FOREST EUROPE 2020). The decomposition of litter
and deadwood can take decades forming a share of 10 % in the carbon pool of EU forests (FOREST
EUROPE 2020). Not all carbon from litter and deadwood decomposition is completely released to
the atmosphere. It is also stored in the forest soil as SOC, which in its stable fraction is also known
as humus. The forest soil has the highest share in the EU forest carbon pool of 54 % (FOREST
EUROPE 2020).
Harvested wood products (HWP) can also store carbon but cannot sequester it. Therefore, they
are not considered as carbon sinks. However, they form a carbon pool that is closely connected to
the pool in living forest biomass. Harvest of biomass reduces the living biomass pool but moves
carbon partly to the HWP pool. The amount of carbon stored in HWPs depends on the allocation
pattern of the harvested wood to wood product types. In 2018, the EU27+UK net storage through
HWP was 12 Mt C (-44.6 Mt CO2), i.e. the stock of carbon in HWP increased in most MS (FOREST
EUROPE 2020; European Union 2020).
Globally, soils store more carbon than all the vegetation and the atmosphere combined
(Friedlingstein et al. 2019). A total storage of organic carbon for the EU27+UK topsoil (0-30 cm) is
estimated to be 73 Gt C. About 50 % is located in peatlands and under forests and 22 % under
agricultural soil, of which around 13 Gt C can be found in cropland and 8 Gt C in grassland (pasture)
(Jones et al. 2005). In the EU27+UK, mineral soils mainly occur under forests (154 Mha), cropland
(123 Mha) and grasslands (89 Mha). Soil carbon stocks are mainly influenced by the type of
management. A study by Hiederer (2018) showed that SOC under permanent crops is lowest
(16 g/kg) compared to long-term cultivated land (17 g/kg) and permanent grassland (44 g/kg). Under
natural vegetation SOC is more than doubled (90 g/kg) compared to agricultural management.
Organic soils mainly occur in wetlands (EU27+UK: 16.3 Mha) and can store carbon very efficiently
because under water saturation the production of biomass (e.g. peat) exceeds its decomposition.
Organic soils are often also referred to as peatlands (Joosten 2009). In Europe organic soils store
four to five times more carbon than forests and about half of Europe’s total SOC (Swindles et al.
2019). However, under cultivation, organic soils are often drained which causes high GHG emissions
from these areas. About 4.1 Mha of organic soils are under agriculture or grassland management in
the EU27+UK (EU 2020) which can be considered as drained (Schils et al. 2008). Therefore, after
Indonesia the EU is the second largest emitter of GHG emissions from drained peatlands (van Akker
et al. 2016).
Important marine carbon pools in Europe are coastal ecosystems like saltmarshes and seagrass
meadows that store carbon in plant biomass and especially in their sediments along the European
coastline. Globally coastal ecosystems cover approximately 2 % of the ocean area, but account for
about 50 % of the carbon that is sequestered in ocean sediments (IUCN 2017). Coral reefs, kelp and
7Working paper
marine fauna are important parts of the marine carbon pool but are most likely not involved in the
long-term carbon sequestration (Howard et al. 2017).
2.3 What are risks associated with carbon pools?
The main pressures to Europe’s carbon pools are intensive land management practices and the
conversion of carbon-rich ecosystems, mainly by drainage of organic soils, deforestation as well
as an increasing expansion of settlements and infrastructure.
Climate change and natural disturbances also affect plant growth and decomposition processes and
therefore influence the ability of ecosystems to store carbon in the long-term. Natural disturbances
such as storms, fires, droughts, snow (abiotic disturbances), insects and pathogens (biotic
disturbances) are an integral part of most ecosystems. However, due to climate change, especially
abiotic disturbances are more likely to increase in frequency and intensity (Seidl et al. 2017; IPCC
2019). In European forests, wind and drought are major drivers of natural disturbances that facilitate
additional biotic disturbances like bark beetle outbreaks (Seidl und Rammer 2017). Seidl et al. (2014)
estimated that the carbon storage potential of Europe’s forests could be reduced by 180 Mt CO2
annually in 2021 to 2030 due to disturbances and thus reduce the expected net forest sink by more
than 50 %. In 2018 to 2020, mainly spruce trees suffered from storms and droughts followed by bark
beetle outbreaks in Germany. The actual extent of the calamities has not been officially documented
yet, but estimates show that the disturbances covered an area of approximately 285.000 ha 3. Hence,
emissions of 113 Mt CO2 from affected spruce forests could occur. Reported data for Portugal and
Italy showed a drastic reduction of carbon storage by forests in 2017 when severe wildfires affected
both countries (EU 2020). While the net sink in Italy was reduced by 40 % compared to previous
years, the sink switched into a source of similar magnitude for Portugal. The net sink reduction in
both countries was in total 23 Mt CO2 for that year.
Climate change can also have long-term effects on the productivity of ecosystems in Europe.
Especially changing precipitation patterns have strong influence particularly in the steppe region of
South-eastern Europe 4. In the long-term, it is expected that increased microbial activity leading to
faster decomposition (Davidson und Janssens 2006) and increased disturbances reduce the overall
ability of long-term carbon storage in EU ecosystems (Reyer et al. 2017; Seidl und Rammer 2017).
In wetlands, fluctuations of carbon sequestration can occur during dry summers and when water
levels decrease. A change in vegetation cover after the drying of natural peatlands, e.g. towards
sedges, can increase methane emissions and further change the hydrology leading to peat
decomposition (Swindles et al. 2019).
However, most carbon pools and their related ecosystems in the EU are currently destroyed,
degraded or under threat due to unsustainable land management (IPBES 2019; IPCC 2019; EEA
2020). According to the latest report of the European Environmental Agency (EEA 2020), only 15 %
of the habitat assessments show a good conservation status, while about 45 % show a poor and
36 % a bad conservation status. Especially coastal habitats are in a bad state as well as peatlands
(more than 50 %) and grasslands (49 %). Forests also show mainly poor to bad (total 80 %)
conservation conditions in 2018 (EEA 2020). Ceccherini et al. (2020) recently reported an increase
in the forest harvest rate for Europe, which is an important driver of decreasing carbon stocks in
forest biomass. The negative impact on the climate is additionally increased when forest biomass is
3
https://www.bmel.de/DE/themen/wald/wald-in-deutschland/wald-trockenheit-klimawandel.html
4
https://www.eea.europa.eu/data-and-maps/indicators/land-productivity-dynamics/assessment
8Exploratory Analysis of an EU Sink and Restoration Target
mainly used for bioenergy purposes, instead of long-lived products like construction wood (Rüter et
al. 2016).
Also, about 45 % of mineral soils in Europe have a low or very low organic carbon content (0 – 2 %)
due to unsustainable agriculture practice that leads to erosion and loss of soil carbon stocks (JRC
2012). Additionally, about half of the peatlands in Europe are degraded by drainage and agricultural
management (Tanneberger et al. 2021), which causes about 100 Mt CO2 emissions representing
74 % of the emissions in the total EU LULUCF sector (European Union 2020).
Therefore, an increasing effort has to be put into the sustainable management, protection and
restoration of ecosystems as important adaptation and mitigation response options (IPCC 2019).
Globally, the potential of these measures is assumed to provide over one third of climate mitigation
needed until 2030 to stabilise warming to below 2 °C in the long-term (Griscom et al. 2017).
2.4 How are these natural sinks covered by current policy and legislation?
The EU LULUCF Regulation provides the legislative framework for emissions and removals of the
land use sector for the period 2021 to 2030. For the first time a specific target was set for this sector
which requires MS to keep the land use sector as a net sink after accounting (“no debit” rule
obligation). The Regulation defines accounting rules against which progress towards this target is
measured (Böttcher et al. 2019). There will be two accounting periods where reported emissions and
removals will be assessed, the first from 2021 to 2025 and the second from 2026 to 2030. The
accounted pools covered by the Regulation are on managed land and are defined as six land use
categories: Afforested land, deforested land, managed forest land, managed cropland and
managed grassland. For the second accounting period it is also obligatory to account for managed
wetlands. Harvested wood products can be from afforested land or managed forests and form a
separate accounting category.
The Regulation includes all relevant carbon pools discussed in section 2.2: above- and below-ground
biomass, litter, dead wood and SOC. For afforested land and managed forest land it also accounts
for HWP. It is important to notice that natural carbon sequestration and emissions are only covered
by the Regulation when they occur on managed land. Carbon and other GHG emissions and
removals originating from unmanaged land are not officially monitored in a standardised manner.
The Regulation does not consider pools from marine ecosystems like saltmarshes and seagrass
meadows.
Emissions from agriculture originating from livestock management, fertiliser usage and machineries
form their own emission sector and are regulated under the Effort Sharing Regulation (ESR), they
are therefore separated from the agricultural soil management emissions accounted under LULUCF.
Natural disturbances occurring on managed land are included in reported data by MS and therefore
also under the LULUCF Regulation. A special provision on natural disturbances allows MS to
exclude emissions from single natural disturbance events from accounting if they exceed a certain
margin of historic disturbance emissions. Natural disturbances can affect carbon pools differently.
While windstorms and insect outbreaks lead to reduction of living biomass but increases in dead
wood and through salvage logging to HWP, fires cause direct emissions of carbon. Therefore,
emission peaks are not always visible in single inventory years (fire being an exception) but reflected
in the long-term through the national forest inventories.
9Working paper
2.5 What are existing restoration and conservation targets?
The UN General Assembly declared 2021 to 2030 the UN Decade on Ecosystem Restoration, and
the EU Biodiversity Strategy for 2030 aims to protect 30 % of the EU land area (of which one
third to be strictly protected including all primary and old-growth forests of the EU) and restore
carbon-rich ecosystems. The strategy also includes planting of 3 billion trees across all MS in
urban and rural areas. Additionally, the European Commission will bring forward a proposal for
legally binding EU nature restoration targets in 2021 to restore degraded ecosystems and carbon-
rich ecosystems.
The EU 2020 Biodiversity Strategy already defined a voluntary target to restore at least 15 % of
degraded ecosystems by 2020. But the target was not met, mainly due to its non-binding character
and lack of understanding of definitions and criteria for restoration and the sustainable use of
ecosystems in the EU. In current EU legislation like the Birds and Habitats Directives, the Marine
Strategy Framework Directive and the Water Framework Directive ecosystem restoration activities
are only partly required. Also, not all ecosystems relevant for restoration are covered by actual
legislation. This mainly affects cropland and intensively used grasslands, forests not covered by the
Habitats Directive, forest plantations and urban ecosystems as well as soil health. More recently, the
One Planet Summit in Paris in early 2021 featured several initiatives targeting restoration, e.g. the
Great Green Wall 5, but no prominent initiatives have targeted restoration in the EU on a broad scale
so far.
Globally, restoration has been addressed by a variety of different concepts (e.g. Nature-based
solutions, Natural climate solutions, etc.). Nature-based Solutions (NBS) are defined by IUCN as
“actions to protect, sustainably manage, and restore natural or modified ecosystems, that address
societal challenges effectively and adaptively, simultaneously providing human well-being and
biodiversity benefits”. Nature-based solutions must therefore benefit biodiversity and support the
delivery of a range of ecosystem services. The IUCN has developed the Global Standard for Nature-
based Solutions and the European network BiodivERsA has proposed a typology characterising
NBS opportunities. Such approaches form an important basis for introducing the concept into other
land-related policies. However, the concept needs further development to formulate clear criteria for
complex ecosystems and develop specific adaptive management strategies to incorporate the
principles. Eventually, also the concept of NBS needs to overcome the incoherence of policies
related to land in the EU to become effective (Cohen-Shacham et al. 2019).
3 Net land sink and restoration targets: potentials and constraints
3.1 What is the EU net sink potential for the land use sector?
3.1.1 Current sinks and emission sources of the land use sector
Forests and agricultural land cover about 75 % of the EU land area. The majority is under intensive
or less intensive management, which also applies to many protected areas which cover about 26 %
of the EU’s land area as part of Natura 2000 (18 %) and national protection schemes (8 %). Only
3 % of the EU land territory is under strict protection without major interventions in natural processes
5
https://www.greatgreenwall.org/about-great-green-wall
10Exploratory Analysis of an EU Sink and Restoration Target
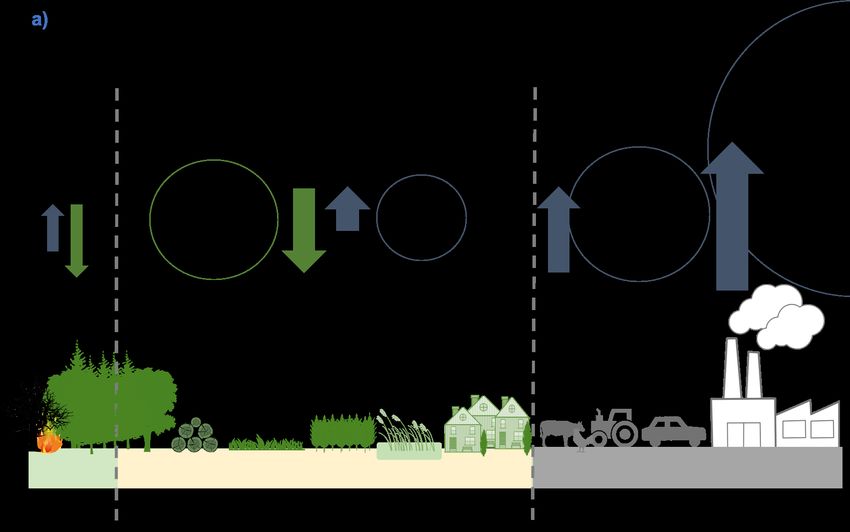
(European Commission 2020). The LULUCF sector inventory reports show GHG emissions and CO2
removals resulting from land management practices. Currently, the EU27+UK GHG inventory
submission under the UNFCCC for 2020 shows GHG emissions of 136 Mt CO2e for the LULUCF
sector which also removes emissions from the atmosphere amounting to -410 Mt CO2e in 2018
(European Union 2020). Hence, the sector is a reported net sink of -274 Mt CO2e, which is about
63 % of the non-CO2 emissions from agriculture or 7 % of the total emissions from industry, energy
production, cement and waste (Figure 3-1a).
The main GHG emission source in the LULUCF sector is cropland with about 65 Mt CO2e (Figure
3-1b). About 50 % (30 Mt CO2, European Union 2020) of the emissions from cropland are caused
by organic soils, which only represent 1.2 % (1.5 Mha) of the total cropland area (European Union
2020) . The emissions from organic soils originate from constant drainage of peatlands for
agricultural use. About 5.8 Mha of EU27+UK peatland area is drained, of which the majority can be
found under grassland (2.7 Mha) and cropland (1 Mha, (Schils et al. 2008)). Germany, Finland, the
United Kingdom, Poland, Ireland, Romania and Sweden are among the main contributors to GHG
emissions from drained peatlands, with a share of up to 25 % of their total emissions from agriculture
and agricultural land use (O'Brolchain 2020). Besides emissions from drained organic soils, there
are also substantial emissions from the loss of SOC in mineral soils. According to Rusco et al.
(2001) about 45 % of the mineral soils in Europe have a low to very low organic carbon content (0-
2 %) due to management practice. High risks for the loss of SOC in mineral soils are high nitrogen
content from soil fertilisation which cause an increase in mineralisation of SOC and soil erosion by
water and wind (JRC 2012).
The second highest emissions in the LULUCF sector originate from the conversion of land to
settlements which causes about 91 % of the emissions from settlements (52 Mt CO2e, Figure 3-1
b). Significant emissions result from the loss of carbon in soils, forests and other woody lands. In
total, settlements showed the highest area increase (26 %) compared to all other land use categories
since 1990. About 47 % (3 Mha) of the land converted to settlements used to be classified as
cropland, 34 % (2.2 Mha) as grassland and 16 % (1 Mha) as forests (European Union 2020).
GHG emissions from wetlands account for 13 % (13 Mt CO2e) of the total GHG emissions from the
LULUCF sector (Figure 3-1 a). Peat extraction is the main source of GHG emissions, contributing
9.2 Mt CO2 emissions corresponding to only 292.000 ha of peatland area in the EU27+UK, mainly
in Poland, Germany, Estonia, Ireland and Finland (European Union 2020).
Forest land is the main net carbon sink of all land use categories with – 364 Mt CO2e (Figure 3-1
b). Forests in Germany (-63 Mt CO2), Sweden (-44 Mt CO2) and France (-42 Mt CO2) are mainly
contributing to the total net sink (EU 2020). Important changes in the subcategory forest land
remaining forest land are increasing harvests as occurring in the Czech Republic, Bulgaria, Latvia
and Germany. In the Czech Republic increased harvest rates even caused net carbon emissions
from forest land remaining forest land. The forest area slightly increased by 7 Mha in the EU27+UK
resulting into carbon sequestration of -41 Mt CO2 in 2018.
11Working paper
Figure 3-1: Net emissions and removals for the EU27+UK in 2018 a) for the entire
economy and b) within the LULUCF sector shown in CO2e, including
emissions from carbon dioxide (CO2) and non-CO2 gases.
Source: own compilation based on UNFCCC data for EU reported in 2020. Other anthropogenic activities include energy, industrial
processes and product use, and waste.
In 2018 the carbon inflow from forest biomass into the HWP carbon pool and the carbon outflow from
the pool resulted in a net carbon stock in HWP of -44 Mt CO2e. (Figure 3-1b). Poland, Romania,
Sweden, Finland and Germany mainly contributed to the HWP carbon stock.
12Exploratory Analysis of an EU Sink and Restoration Target
Grassland was a net sink of -2 Mt CO2e in 2018 mainly due to net CO2 emission removals by
cropland converted to grassland (-29 Mt CO2). Especially France, Italy and the UK reported a
significant carbon sink on mineral soils resulting from the conversion of cropland. However, the
subcategory “grasslands remaining grasslands” showed substantial emissions of 23 Mt CO2. Carbon
emissions from grassland mainly occurred in Germany (21 Mt CO2) and Ireland (6 Mt CO2). The
main factor impacting carbon emissions from managed grasslands is drainage of organic soils which
accounted for about 3 % (3 Mha) of the total grassland area (89 Mha) in 2018 (EU 2020). In contrast,
the UK reported a substantial net sink from mineral soils (-5 Mt CO2) and Romania showed a carbon
sink (-1 Mt CO2) from woody vegetation on grassland (EU 2020).
LULUCF includes emissions and removals occurring on managed land, i.e. both anthropogenic and
natural emissions and removals from this land are considered, excluding natural processes on
unmanaged land, e.g. those caused by wildfires in primary forests (Figure 3-1a).
Non-GHG emissions from agriculture in EU27+UK are not included in the land use sector but form
a separate sector. It includes, among others, emissions of methane (CH4) from livestock
management and nitrous oxide (N2O) from fertiliser application. In 2018, emissions from that sector
amounted to 435 Mt CO2 and were thus of a similar size as the gross sink of the LULUCF sector
(Figure 3-1a).
3.1.2 Options for emission reduction and enhancement of carbon storage and their
potential
Maintaining and enhancing net sinks requires land management options that reduce emissions and
support the carbon storage capacity. In this study, options have been selected to represent different
land use categories and according to their mitigation potential.
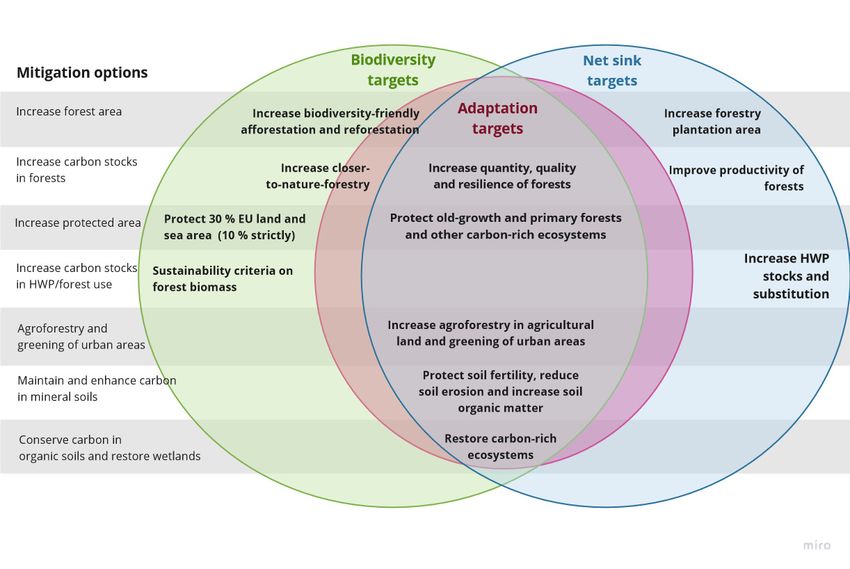
Seven different options will be presented for the land use sector of the EU:
a) Increase EU forest area
b) Restore carbon stocks in forests
c) Enhance carbon storage in HWP
d) Maintain and enhance SOC in mineral soils under grassland and cropland
e) Expand agroforestry on cropland
f) Conserve carbon in organic soils and restore wetlands
As mentioned earlier, maintaining and enhancing marine blue carbon ecosystems offer great
mitigation potentials (Gacia et al. 2002; Marbà et al. 2014; Lovelock und Duarte 2019). However,
they are currently not considered within the LULUCF framework and the distribution and sink
potential of blue carbon ecosystems in the EU is still under research, but we will provide first
estimations for:
g) Protection and restoration of saltmarshes and seagrass meadows
For the assessment we analysed EU and National Inventory Reports (NIRs) and Common Reporting
Framework (CRF) tables submitted to UNFCCC as well as national and international scientific
literature. For some cases, we also carried out expert interviews. The potential for emission reduction
and enhancement of carbon storage can be expressed as specific potential (per area unit, e.g. per
13Working paper ha) and as absolute potential. The first indicates the intensity and effectiveness of a land management option regarding emission reduction and carbon storage, the latter describes the potential at landscape level if implemented at a larger scale. Increase forest area Increasing the forest area by afforestation and reforestation means converting non-forested land to forests, whereby afforestation is the conversion of areas without tree cover for the last 50 years. Reforestation describes the conversion of previously forested areas into forests and constitutes bringing back trees into areas that no longer meet the national definitions of forests due to reduced tree cover (e.g. less than 10-25 %). These land use options provide carbon storage in the forest related pools of tree biomass, dead wood, litter and soil. Historically, the highest afforestation rates in the EU were found in Spain, France and Italy, mainly on grasslands (European Union 2019). Afforestation can have several co-benefits like increased water infiltration, drought mitigation, flood control and habitat for wildlife (IPCC 2019). However, depending on the local situation, afforestation may have trade-offs for biodiversity on e.g. grasslands. Also, afforestation measures are less effective for mitigation in boreal regions of Scandinavia due to the albedo effect (Griscom et al. 2017; IPCC 2019). In cold regions with slower tree growth, dark coniferous trees absorb more solar radiation compared to open habitats leading to local warming which reduces the net climate change mitigation effect of sequestered CO2. How different estimates of the potential for future afforestation in the EU are covered in the literature can be shown by two scenarios, the EU reference scenario (European Commission (EC) 2016) and CTI 2050 roadmap (ECF 2010). Their proposed net increase in forest area ranges between 6 and 59 % (10 to 95 Mha). This would result in EU mitigation potentials of 77-210 Mt CO2 per year or 2.2 to 7.7 t CO2/ha/year. Restore carbon stocks in forests Restoring forest carbon stocks through forest management needs to focus on increasing carbon sequestration in biomass and soil. Biomass growth depends on on-site conditions (climate and soil), tree species mortality and wood harvest. Therefore, the rate of harvest intensity plays an important role to manage carbon stocks (Pilli et al. 2016). Forest biomass will increase and therefore gain carbon when harvest rates are well below the average increment and natural mortality. Also, intensive wood harvest can have negative implications for the stand structure and forest resilience towards disturbances and climate change (Drever et al. 2006). Hence, long-term productivity and carbon sequestration of forests can be negatively affected as well (Ceccherini et al. 2020). Sweden, Finland, France, Poland and Germany have the highest area potential to restore carbon stocks, together they have more than 100 Mha of managed forests. Historically, the largest carbon sinks per unit area were reported for Germany (5.6 tCO2/ha/year), Netherlands (4.8 tCO2/ha/year) and Slovenia (4.7 tCO2/ha/year, average over period 1990-2015 based on reported CRF data). A recent study by Welle et al. (2020) showed that sustainably managed EU forests could sequester 309 to 488 Mt CO2 annually until 2050 compared to 245 Mt in 2010, only in biomass pools, and a short-term annual carbon sink potential of 309 to 456 Mt CO2 until 2030. The study assumed natural growing conditions in EU forests and alternative use of wood products like abandoning fuel wood use and reducing use of hardwood for short-lived wood products. Other studies with different ambition levels estimate the development of the forest carbon sink to range between 150 and 400 Mt 14
Exploratory Analysis of an EU Sink and Restoration Target

CO2 per year in 2050 (Nabuurs et al. 2017; EC 2016; European Commission 2020, see also Table
3-2). An important assumption is the future harvest level assumed by studies estimating the forest
sink potential. Recently, wood harvest intensity has been reported to be increasing (Ceccherini et al.
2020), with likely implications for the net storage of carbon in EU forests. There is also a scientific
debate about the saturation of the sink and the role of forest age for the sink potential (Nabuurs et
al. 2013; Luyssaert et al. 2008).

Carbon storage in harvested wood products

The carbon pools for forest biomass and HWP are very closely connected. Reducing harvest rates
usually leads to an increase in forest biomass carbon stocks. Moreover, the trees that were not
harvested continue to grow and sequester carbon. With reduced harvest rates, the flow of carbon
into the HWP pool is decreased, potentially leading to decreases in HWP carbon stocks with
products reaching their end of life. If harvest rates are increased and the carbon stock in forests is
reduced, typically only a fraction of the removed carbon is stored in HWP. If the wood is used for
energy, it counts as an emission. Wood left to decompose in the forest still contributes to the forest’s
deadwood, litter and soil carbon pools. Wood products thus only contribute to mitigation when they
are long-lasting. Carbon can also be retained longer in HWP pools through re-use and recycling.

Additionally, HWP can help reduce emissions in other sectors (substitution) through replacing
products and uses with higher energy input of fossil fuel emissions compared to those of HWP. But
substitution effects depend on assumptions of future energy and fossil fuel use. Substitution effects
are thus expected to decrease with progressing decarbonisation of energy systems. Moreover, they
are not accounted for under the LULUCF sector but in the sector where the emission reduction is
achieved.

Assuming a reduction of primary use of wood for energy and increased wood product could double
the expected storage of CO2 by HWP from 17 to 40 Mt CO2 annually until 2030 (Rüter et al. 2016).
As the option does not affect harvest levels but simply the allocation of harvested wood to energy
and material use, impacts on the forest are negligible. Another study by Pilli et al. (2015) estimated
HWP storage capacities for 2030 to amount to 43.8 Mt CO2/year through increased harvest rates.
However, the study of Pilli et al. ignores the forest carbon stock and implications of increased harvest
for the forest sink.

Maintain and enhance carbon in mineral agricultural soil

The choice of management practices that have the most significant potential for maintenance and
sequestration of soil carbon varies according to climate and biophysical conditions (e.g. soil type),
as well as the production system involved.

Generally, the largest potentials can be achieved with cover cropping; improved crop rotations (e.g.
through inclusion of legumes and other nitrogen fixing crops), reduced or zero tillage as well as
agroforestry established on cropland or grassland. Also, preventing conversion of grassland to
arable land and additional conversion from arable to grassland and organic farming practices can
help restore SOC levels. The potential for increasing SOC in agricultural soils is highly variable and
ranges between 0.5 and 7 t CO2 /ha/year (Smith 2016; Roe et al. 2019; Poeplau und Don 2015).
Scenario estimates of the potential for cropland SOC enhancement in the EU until 2050 range from
9 Mt (Frank et al. 2015) to 23 to 58 Mt CO2e per year (Lugato et al. 2014a). The “4 per mill” initiative
launched at the 2015 United Nations Climate Change Conference in Paris aims at increasing global

                                                                                                     15
Working paper SOC stocks in 0–40 cm depth by annually 4‰. With an estimated SOC stock of 17.6 Gt C, corresponding to 64.5 Gt CO2 (Lugato et al. 2014b), an annual increase by 4‰ would be 260 Mt CO2 annually. However, scenarios mixing different management options in Bavaria (Germany) including cover cropping, improved crop rotation, organic farming, agroforestry and conversion of arable land to grassland revealed that the potential for Bavaria would at maximum rather be around 1‰ of present stocks (Wiesmeier et al. 2020). Hence, the scope for accumulating SOC in mineral soils is expected to be limited, also because e.g. the availability of additional carbon sources originating from extra primary production is limited and practices that enhance SOC may cause N2O emissions (Berge et al. 2017; Lugato et al. 2018). Moreover, carbon gains in SOC are quickly reverted if management practices change. But the area potentially involved can be large and the option thus results in a significant contribution to the net sink. The option is especially suitable for countries with large arable lands on mineral soils such as France, Germany, Hungary, Romania and Poland. The increase of organic farming practices on arable land in the EU can also contribute to higher SOC content. According to Gattinger et al. (2012) organic farming shows a mean difference in annual carbon sequestration ranging from 0.9 to 2.4 t CO2/ha in the top soil compared to non-organic agricultural practices. Therefore, converting all available cropland on mineral soil in the EU27+UK (123 Mha) could lead to a potential sequestration of 110 Mt CO2 per year to 295 Mt CO2 per year (Gattinger et al. 2012; European Union 2020). The main difference in changes of SOC between both management practices results from extended crop rotation, improved crop varieties and applying organic fertilisers in organic farming. Expand Agroforestry coverage Agroforestry is the integrated management of woody elements on managed cropland or grassland (European Commission 2013). Two types of agroforestry can be distinguished: silvo-pastoral agroforestry (animals grazing or animal fodder produced under trees), which represents the majority of agroforestry systems in the EU, and silvo-arable agroforestry (crops are grown under trees, with row spacing allowing for tractor traffic) (Burges et al. 2019). In regions suffering from multiple environmental pressures like nitrogen pollution, soil erosion and SOC loss as well as rising temperatures, agroforestry can be an effective adaptation and mitigation measure. Compared to conventional agricultural practices it can enhance carbon sequestration in soil and wood biomass and improve water availability and quality as well as protect crops and livestock from extreme climate events like heat waves. According to a study by Kay et al. (2019) on area and carbon storage potentials of agroforestry in Europe, about 8.9 % (13.7 Mha) of arable land in the EU27+UK+Switzerland (minus Cyprus and Croatia) were identified as priority areas that could benefit from agroforestry. These arable regions are mainly in the lowlands of Mediterranean countries like Greece, Spain and Italy. Annual carbon storage potentials show a wide range between biogeographical regions and different kinds of agroforestry practices mainly depending on tree species and density as well as the time span until trees are harvested. If agroforestry is applied in the priority areas proposed by Kay et al. (2019), the average minimum annual carbon storage potential estimate is about 7.7 Mt CO2 (0.6 t CO2/ha). This corresponds to mainly silvo-arable systems with alley cropping in the Atlantic and continental regions and silvo-pastoral systems with low tree density (about 20-100 trees/ha) in the Mediterranean. However, carbon storage is substantially increased to 235 Mt CO2 (17 t CO2/ha) if mainly silvo-pastoral and silvo-arable systems are applied with high tree density (> 100 trees/ha). Generally, recent studies suggest that agroforestry can have multiple benefits, when regionally adapted systems are applied considering 16
Exploratory Analysis of an EU Sink and Restoration Target

soil, climate and water conditions as well as which environmental pressures should be addressed,
like nitrogen leakage or soil erosion (Kay et al. 2018).

Conserve carbon in organic soils and restore wetlands

Reducing GHG emissions from organic soils in arable land and wetlands will be one of the most
effective measures to rapidly decrease emissions from the land use sector and achieve the EU’s
climate targets (Pérez Domínguez et al. 2020). Efficient emission reductions can be achieved by
raising the water levels near to the surface on drained organic soils, e.g. by blocking or regulating
drainage systems and restoring wetland ecosystems. Fallowing of all organic soils in the EU could
mitigate about 42 Mt CO2e in 2030 (Pérez Domínguez et al. 2020). Another study by UBA (2019)
assumed that 50 % of the total organic soils area under cropland and grassland (2 Mha) could be
rewetted. The resulting total annual mitigation potential for 2050 was 23.5 t CO2/ha (48.1 Mt CO2).
Differences in estimations for emissions from degraded peatlands or mitigation effects of peatland
restoration can vary substantially, depending on the peatland area assumptions and applied
emission factors. For example, reported area extend of organic soils in NDCs can differ from
alternative data bases due to poor data base (Barthelmes 2018).

Additionally, abandoning peat extraction could avoid substantial emissions. According to recent data
reported by the EU27+UK, abandoning peat extraction could avoid emissions of about 9 Mt CO2
annually (European Union 2020). In some cases, the introduction of paludicultures like sphagnum
moss and reed can be a solution to avoid land use conflicts. The main advantage of paludicultures
is that they can be cultivated under wet conditions and simultaneously the peat body can be
preserved (Wichtmann et al. 2016).

The mitigation potential of natural peatlands shows high local and regional variability and depends
on complex interaction of climatic, hydrologic and hydro-chemical conditions. Peatland carbon
sequestration rates can show considerable year-to-year variability and peatlands can also turn into
sources of GHG emissions. Especially methane emissions can occur under wet conditions if biomass
is decomposed anaerobically. In the long-term (more than 100 years), the climatic effect of CO2 and
CH4 emission fluxes of peatlands is either slightly positive or negative and depends on age and type
of peatland. Generally, the sink effect of sequestered carbon in peatlands balances the emissions in
the long run (Barthelmes et al. 2015). Therefore, the protection of current carbon stocks in peatlands
(organic soils) should be of highest priority.

Protection and restoration of saltmarshes and seagrass meadows

Saltmarshes and seagrass meadows can be successfully restored if initial threats were eliminated
prior to replanting. Main stressors are eutrophication, waste and coastal modifications. Aerial loss is
one of the main disturbances of coastal ecosystems, resulting in loss of carbon storage capacity and
construction activities (Luisetti et al. 2019). For example, bottom trawling affects sedimentary carbon
storage through remineralisation and by impacting the seabed species involved in bioturbation and
bio-irrigation (Duplisea et al. 2001). Therefore, stopping further degradation by applying sustainable
fishing methods and restoration of these ecosystems could contribute to mitigating GHG emissions
from coastal wetland ecosystems. The current estimated extent of saltmarshes and seagrass
meadows in the EU is about 3 Mha (Luisetti et al. 2013) but information on the sequestration
potentials of European blue carbon ecosystems is missing. There are only studies on single
seagrass species or estimates for small regions, e.g. for saltmarshes in the UK that showed a
sequestration potential of 3.4 to 4.2 tCO2/ha/year (Adams et al. 2012).

                                                                                                    17
Working paper
3.1.3 Estimate of the total EU net sink potential for the land use sector
Looking at different options for emission reductions and carbon stock enhancement results in
considerable ranges of potentials. This is due to underlying assumptions in studies and uncertainty
in data and models. To come up with an estimate of the total EU net sink potential for the land use
sector, different options cannot be simply summed up because assumptions like reference year,
geographical scope or ecological constraints are not necessarily consistent between studies.
Moreover, there are considerable interlinkages between options, like competition for land, that
require integrated studies to model the implementation of various options in competition. Therefore,
it is not adequate either to average over potential ranges.
However, there are some studies that have published integrated scenarios of net GHG emissions
from the land use sector for the EU (see Table 3-2 below). Still, the studies consider different scopes
and combinations of measures. Hence, the published data do not allow for a differentiated
comparison of single measures within the scenarios. Considering the above-mentioned constraints
regarding interpretation, the potential for the EU net sink in 2050 ranges between 244 Mt CO2
(the EU Reference scenario forming the baseline of the development of the sector) to 787 Mt CO2
per year in an ambitious policy scenario. Most estimates consider a net sink of 400 to 600 Mt CO2
per year as feasible for 2050 while also avoiding major trade-offs with other sustainability
constraints (e.g. regarding biodiversity). A similar potential for the net land use sink can be
derived from scenario studies already for the year 2030 if ambitious measures are
implemented in the sector. In the following sections we discuss main assumptions leading to these
estimates.
3.2 What are conditions and pathways for realising net sink potentials?
3.2.1 A short review of scenarios of net sink potentials
The potential carbon storage on managed land cannot be achieved instantly. The uptake of carbon
depends on growth rates of vegetation, limited by light, temperature, nutrients, water and other
resources. Moreover, changing management practices and realising restoration of ecosystems is
also limited by the implementation rate, expressed as amount of area where the change occurs.
The rate of implementation and the rate of carbon uptake depend on assumptions regarding the
specific measures. For scenarios of pathways of emissions and removals in the LULUCF sector
these assumptions need to be set and are partly predetermined by the type of model or extrapolation
method applied for the projections. Existing studies of net sink potentials that the sector might be
able to offer can be compared when these assumptions and specific settings are considered. Typical
influencing assumptions are:
• The impact of environmental and climate change on plant growth and decomposition rates;
• Changes in productivity of agricultural and forestry production based on assumed fertiliser
input, irrigation, plant breeding etc.;
• Changes in demand for land-based products and linkages between biomass consuming
sectors and land use determining land availability.
Specific assumptions regarding the estimated emissions and removals through measures directly
affect their potential contribution to net GHG emissions from managed land (see Table 3-1). For
18Exploratory Analysis of an EU Sink and Restoration Target
designing effective policies to support a net sink target that is oriented towards a selected scenario,
it is crucial that policies are in line with these assumptions. This could be food and health policies
addressing dietary changes that are a precondition for certain pathways or energy policies that set
adequate incentives (or disincentives) for the use of biomass consistent with respective scenario
assumptions. However, policy scenarios are not meant to be direct blueprints for policy
implementation. They are instead explorative studies of pathways determined by set pre-conditions
(what-if situations) and can be useful for increasing the understanding of system behaviour.
Table 3-1: Overview of potential mitigation options and assumptions relevant for
potential
Pools Mitigation Examples of Assumptions relevant for potential
option measures
Forest Increase Afforestation of Assumption on availability of land and previous carbon stocks on the
biomass forest area cropland/ land to be afforested.
and soils grassland
Conserve Reduction of The maximum potential that can be avoided are current emissions
carbon deforestation from deforestation. Assumption on the time horizon and effectiveness
stocks in emissions of deforestation reduction.
forests
Restore Reduce harvest Potential depends on how close countries are already to the
carbon intensity/increase maximum level of wood harvest. The theoretical potential can be very
stocks in target diameters high. However, trade-offs regarding reduced wood harvest need to
forests Increase dead be considered.
wood
Wood Increase Increase lifetime of Increased wood production has impacts on the forest sink that are
products carbon wood products/ often not considered. Options should therefore target more efficient
storage in share of long-lived use of wood and increasing lifetime of products. The additional
wood products storage potential in wood products is rather medium- to long-term.
products Increase cascade Net effects of increased cascade use of wood can be limited if
use of wood temporarily reduced availability of biomass for energy needs to be
compensated by increased biomass production or imports.
Mineral Maintain and Increase humus The maximum potential that can be avoided are current emissions
soils enhance content of soils from grassland conversion. Assumption on land use dynamics and
carbon in Reduce soil competition with alternative land uses to grassland.
mineral management
agricultural intensity
soils
Expand Introducing trees Maximum potential includes cropland and grassland area where such
agroforestry and hedges into measures have not yet been implemented Specific mitigation
coverage agricultural land potential per unit area is relatively low, but measures can improve
biodiversity and increase landscape resilience
Organic Conserve Rewetting of The maximum potential that can be avoided are current emissions
soils carbon in cropland/grassland from organic soils. Assumption on land availability for rewetting and
organic soils on organic soils water level that can be achieved.
and restore Abandoning peat
wetlands extraction
Source: own compilation
19Working paper
Table 3-2: Comparison of selected studies assessing net sink potentials of managed
land in EU
No. Study author and Main Time Potential Main assumptions
name mitigation horizon Mt CO2/
categories year
1 EC (2016) EU LULUCF 2030 -288 Business as usual management of EU lands.
Reference scenario 6 2050 -244
2 Naturwald Akademie forest 2030 -593 Forest harvest intensity is reduced to 60 % by
(2020): Forest vision restoration 2050 -488 2030 and to 50 % between 2030–2050.
scenario for the
European Union (EU-
25 7)
3 Oeko-Institut: GHG- afforestation, 2050 -518 Increase forest area by 16 Mha; stabilising forest
neutral EU 2050 8 forest harvest rate at 70% of increment; increase the
restoration, share of longer-living wood products; conversion
harvested of 50 % of cropland on organic soils to wetlands,
wood forests and grasslands; reduction of grassland
products, conversion on organic soils to zero, on mineral
peatland soils to 50 %; no net land take of infrastructure
restoration, and settlements by 2050.
grassland
protection
4 CTI 2050 Roadmap afforestation, 2050 -584 Reduced land degradation; 24 % less land
Tool (2019) 9 forest required to produce food (multi-cropping, etc.);
restoration, 76 % of surplus land is afforested, 20 %
reduced converted to grasslands; forest harvest intensity
cropland and lowered by 25 %.
grassland
management
intensity
5 EU CALC project afforestation, 2030 -570 Afforestation of 114 Mha grassland and cropland,
(2020), Ambitious bioenergy, 2050 -787 increasing bioenergy capacities, improved diets
scenario 10 area and alternative protein sources, improved
protection, forestry practices and land management,
forest improved hierarchy for biomass end-uses, and
restoration set aside 50 % of area for protection.
6 EC 2030 Climate Target afforestation, 2030 -340 Optimisation of forest management, afforestation
Plan Impact forest 2050 -425 projects and improving soil management
Assessment, LULUCF+ restoration, including through rewetting and restoration.
scenario 11 restoration of
peatlands,
7 Nabuurs et al. (2017) 12 afforestation, 2050 -300 Measures like enhanced thinning of stands
forest leading to additional growth and higher quality
restoration, raw material, regrowth with new species, planting
harvested of more site-adapted species, and regeneration
wood using faster growing species would even
products increase harvest potential from 522 to 557 Mm3
per year.
Source: own compilation based on cited literature
6
https://ec.europa.eu/energy/data-analysis/energy-modelling/eu-reference-scenario-2016_en
7
excluding Luxembourg, Cyprus and Malta, including UK
8
https://www.umweltbundesamt.de/sites/default/files/medien/1410/publikationen/2019-11-26_cc_40-
2019_ghg_neutral_eu2050-technical-annex.pdf
20You can also read