Exposure Levels and Contributing Factors of Various Arsenic Species and Their Health Effects on Korean Adults
←
→
Page content transcription
If your browser does not render page correctly, please read the page content below
Exposure Levels and Contributing Factors of Various
Arsenic Species and Their Health Effects on Korean
Adults
Seul-Gi Lee
Chung-Ang University
Ingu Kang
Chung-Ang University
Mi-Na Seo
Chung-Ang University
Jung-Eum Lee
Chung-Ang University
Sang-Yong Eom
Chungbuk National University
Myung-Sil Hwang
National Institute of Food and Drug Safety Evaluation
Kyung Su Park
Korea Institute of Science and Technology
Byung-Sun Choi
Chung-Ang University
Ho-Jang Kwon
Dankook University
Young-Seoub Hong
Dong-A University
Heon Kim
Chungbuk National University
Jung-Duck Park ( jdpark@cau.ac.kr )
Chung-Ang University College of Medicine https://orcid.org/0000-0003-0667-4674
Research Article
Keywords: Arsenic species, Urine, Seafood, Rice, Human health
Posted Date: September 13th, 2021
DOI: https://doi.org/10.21203/rs.3.rs-895767/v1
Page 1/24License: This work is licensed under a Creative Commons Attribution 4.0 International License. Read
Full License
Page 2/24Abstract
Arsenic is a human carcinogen. Data on urinary arsenic species analyses of Koreans is limited. This study
evaluated the arsenic exposure level, contributing factors, and health effects in Korean adults. Dietary intake
information and urine samples were obtained from 2,044 participants. Arsenic exposure was assessed
based on urinary concentrations of arsenic species, such as inorganic arsenic, As(III) and As(V),
monomethylarsonic acid (MMA), dimethylarsinic acid (DMA), and arsenobetaine (AsB), using high-
performance liquid chromatography with inductively coupled plasma mass spectrometry, followed by
determination of biomarkers, malondialdehyde and c-peptide. The geometric mean concentrations were 30.9
㎍/L for the sum of inorganic arsenic and their metabolites, and 84.7 ㎍/L for the total sum of arsenic
measured. Urinary concentrations of arsenic species were influenced by age, inhabitant area (inland or
coastal), and seafood intake, which was positively correlated with inorganic arsenic, DMA, and AsB. Rice
intake was positively correlated with inorganic arsenic and its metabolites but not with AsB. Additionally,
malondialdehyde and c-peptide levels were significantly associated with urinary concentrations of various
arsenic species. Seafood and rice are major sources of organic/inorganic arsenic exposure in Korean adults;
however, it is necessary to evaluate whether their overconsumption could have a potentially detrimental
effect on human health.
Introduction
Arsenic (As), which is ubiquitously distributed in the environment, is one of the major environmental
pollutants. Arsenic has been originated naturally from soil, rock, and volcanic eruptions and from
anthropogenic sources, such as mining, industries including copper smelter and wood preservative facilities,
and agricultural sources. However, the majority of human arsenic exposure is primarily from geogenic
arsenic contamination of food and water (ATSDR, 2007). There are several forms of arsenic, and the
toxicities of arsenic are quite different based on their chemical form and valence; inorganic arsenic is
generally more toxic than organic arsenic, and trivalent arsenic is more toxic than pentavalent arsenic.
Inorganic arsenic, namely, arsenate and arsenite, is metabolized to monomethylarsonic acid (MMA) and
dimethylarsinic acid (DMA) through reduction and methylation processes in the body, which are more toxic
than organoarsenics, such as arsenobetaine (AsB), arsenocholine (AsC), and arsenosugars (AsS). MMA(III),
which is a methylated intermediate metabolite of inorganic arsenic, is the most toxic arsenic species (Petrick
et al., 2001; Stýblo et al., 2002).
Inorganic arsenic is known to cause non-carcinogenic diseases, including skin pigmentation and keratosis,
diabetes, cardiovascular diseases, and peripheral neuropathy, as well as various cancers of the skin, lungs,
liver, and bladder (ATSDR, 2007; Schuhmacher-Wolz et al., 2009). Human exposure to arsenic can be
estimated from arsenic levels in blood, hair, nails, and urine. Arsenic is metabolized relatively quickly in the
body and is excreted mainly in the urine. Blood arsenic level rapidly decreases within several hours after
exposure, which makes it a relatively poor exposure marker. Therefore, urinary arsenic concentration is the
most valuable biomarker that reflects arsenic exposure in the past several days (Buchet et al., 1981; Link et
al., 2007). Arsenic in the hair and nails is a biomarker of chronic and relatively older arsenic exposure
(Hindmarsh, 2002; Middleton et al., 2016). Additionally, several forms of arsenic, such as organoarsenic as
Page 3/24well as inorganic arsenic and their metabolites, are excreted in the urine. Therefore, it is necessary to
determine the concentrations of urinary arsenic species for the risk assessment of human arsenic exposure.
Several studies reported that seafood consumption increased DMA excretion in urine and suggested that
organoarsenic in seafood could be metabolized to DMA after consumption (Ma and Lee, 1998; Choi et al.,
2010; Molin et al., 2014). It is questionable whether overconsumption of seafood could be hazardous to
human health. The general population, who are not occupationally exposed to arsenic, is mainly exposed to
arsenic through ingestion of arsenic contaminated water, grains harvested from arsenic contaminated fields,
and seafood. Associations between arsenic intake from food, especially seafood and rice, and urinary
arsenic concentration in the general population have been reported (Navas-Acien et al., 2011; Wei et al.,
2014; Bae et al., 2017; Signes-Pastor et al., 2017). Seafood is one of the favorite foods, and rice is a staple
food in Korea. However, limited data are available on urinary arsenic species analyses in the Korean
population (Choi et al., 2010; Park et al., 2016; Bae et al., 2017). Additionally, it is not fully understood
whether environmental arsenic exposure could detrimentally influence the health of the general Korean
population.
Thus, we performed speciation analysis of urinary arsenic, analyzed the relations between the consumption
of food groups and the urinary arsenic species, and measured possible health effectors, namely,
malondialdehyde (MDA) and c-peptide, for a risk assessment of arsenic exposure in the Korean adults.
Materials And Methods
Study population
This cross-sectional study included a total of 2,044 study subjects, 888 males and 1,156 females, who were
19 years old or older. They had not been occupationally exposed to arsenic. Study subjects were sampled
using the multistage and probability sampling method and were stratified by sex and age from 102
sampling sites during 2010–2011 in Korea as described previously (Eom et al., 2014; Lim et al., 2015). In
briefly, the 102 sampling sites were distributed throughout the Korea, and included 15 metropolitans and
provinces, excluding Jeju province. We selected 34 cities and counties from 15 metropolitans and provinces,
followed by sampling of 102 towns and townships from these 34 cities and counties. The number of study
subject from each site was allocated in proportion to the square root of the population size of the district.
Because we decided that having stable sample was very important in this small-sample study. Written
informed consent was obtained from all the study subjects. Analyses of various arsenic species in the urine
were performed in this study. The study protocol of 2010–2012 was approved by the Chung-Ang University
Ethical Committee for Medical Research and Other Studies Involving Human Subjects, and the study
protocol for additional analyses of arsenic species was approved by the Institutional Review Board of
Chung-Ang University.
Personal interview and urine sampling
We conducted personal interviews with study subjects individually to obtain information about demographic
characteristics, such as sex, age, smoking, alcohol consumption, education level, monthly income, type of
Page 4/24drinking water, pesticides used, residential area size, and inhabitant area (coastal or inland). Coastal or
inland area was categorized whether each study site included a seashore or not. Additionally, we asked
about seafood intake within 72 hours before the start of this study. All urine excreted by the study subjects
was collected as an aggregated sample starting from post-dinner until the next morning’s interview, also
included the first-void sample of the next morning. This corresponds to urine collected for approximately
15–18 h and averaged about 1.1 L. Urine samples were refrigerated during the sample collection time,
frozen after dispending, and subsequently stored at –80 ℃ in the laboratory without solving before analysis
after sample collection.
Estimation of daily food consumption
Previously, we estimated daily food consumption during the last 24 h before the interview (Seo et al., 2016).
A 24-h recall method has a limitation which could not reflect long-term, usual intakes and may be
underestimated (Tucker, 2007), although this method could provide more detailed information on dietary
intake in a population study. A diet study was carefully conducted with a prepared questionnaire by well-
trained personnel to minimize recall bias. In this study, we included 138 specific food items (16 food groups)
that are frequently and largely consumed in Korea.
Analyses of arsenic species
Speciation analyses of various arsenic species in urine were performed using high-performance liquid
chromatography (HPLC, PerkinElmer Series 200, Shelton, CT) coupled to inductively coupled plasma mass
spectrometry (ICP-MS, PerkinElmer NEXION 300S, Concord, Ontario, Canada). We determined five different
arsenic species, namely, arsenite [As(III)], arsenate [As(V)], MMA, DMA, and AsB, using CAPCELL PAK, 4.6㎜
×250㎜, 5 ㎛ C18 columns (Shiseido, Japan) with a mobile phase of 10 mM sodium 1-butanesulfonate, 4 mM
malonic acid, and 4 mM tetramethylammonium hydroxide pentahydrate (pH 2.5). The concentrations of
urinary arsenic are expressed as inorganic arsenic [InAs, As(III)+As(V)], MMA, DMA, AsB, the sum of
inorganic arsenic and their metabolites (TmetAs, InAs+MMA+DMA), and the total sum of arsenic measured
(TsumAs, InAs +MMA+DMA+AsB). The analytical method for various arsenic species was validated for
linearity using each corresponding standard solution, such as As(III) (Inorganic Ventures, Christiansburg, VA),
As(V) (Inorganic Ventures), MMA (TCLC, Japan), DMA (TCLC), and AsB (TCLC). The calibration curves had a
linearity of r2>0.99. The standard reference material from the National Institute of Standards Technology
(NIST), NIST 2669 I&II (USA), was used to validate the accuracy and precision of the experimental method.
The recovery of NIST 2669 levels I and II were 99.7% and 100.7% for As(III), 102.1% and 98.6% for As(V),
99.5% and 103.2% for MMA, 100.8% and 99.7% for DMA, and 101.0% and 99.4% for AsB, respectively, and
the coefficient of variations were 4.5% and 4.0% for As(III), 6.4% and 5.3% for As(V), 11.3% and 7.2% for
MMA, 6.4% and 1.6% for DMA, and 7.8% and 3.5% for AsB, respectively. The limits of detection were 0.026,
0.049, 0.012, 0.030, and 0.059 ㎍/L for As(III), As(V), MMA, DMA, and for AsB, respectively. The
concentrations were below the detection limits in 242, 206, 70, 0, and 11 samples for As(III), As(V), MMA,
DMA, and AsB, respectively. More than 80% of the samples had detectable values in the various arsenic
species. The levels of arsenic below the detection limits were assigned to values of detection limits divided
by a square root of two (Hornung and Reed, 1990).
Page 5/24Measurements of malondialdehyde and c-peptide Urinary MDA and c-peptide levels were measured as possible indicators of oxidative stress and endogenous endocrine response, respectively. The urinary concentration of MDA was determined using HPLC with a fluorescence detector (RF-10AxL, Shimadzu, Kyoto, Japan) as described previously by Agarwal and Chase (2002). The urinary concentration of c-peptide was measured using electrochemiluminescence immunoassay (Cobas 8000 e602, Roche, Germany). Statistical analyses Statistical analyses were performed with SAS version 9.2 (SAS Institute Inc., Cary, NC, USA). The urinary arsenic level was presented as the arithmetic mean, geometric mean, median, and the value at the 95th percentile. The urinary arsenic concentrations were distributed log-normally rather than as normal distribution, which were log-transformed for statistical analyses. The comparisons of means were analyzed using a two-tailed Student’s t-test or analysis of variance following multiple comparison test using Duncan’s method. Contributing factors to the urinary arsenic levels were determined using multiple regression analyses. The relationship between urinary arsenic concentrations and consumption of each food group was analyzed using Spearman’s rank correlation coefficients after adjusting for potential confounding variables, such as sex, age, inhabitant area, and body weight. Statistical significance was set at p
Table 1
Mean concentrations of various arsenic (As) species in urine (㎍/L)
InAs MMA DMA AsB TmetAs TsumAs
Male AM ± SD 5.4 ± 7.6 2.4 ± 32.5 ± 100.8 ± 40.3 ± 141.0 ±
2.1** 27.6 181.9 33.6 194.3
(n = 888)
GM 3.0 (3.2) 1.5 (3.6) 24.2 (2.2) 45.6 (3.9)** 30.4 (2.2) 87.7 (2.6)
(GSD)
Median 3.0 1.9 25.2 48.1 32.1 87.9
P95 18.2 5.8 81.2 363.4 99.6 434.3
Female AM ± SD 6.5 ± 2.1 ± 2.1 35.3 ± 96.1 ± 226.7 43.9 ± 140.1 ±
17.0 46.4 61.0 240.6
(n =
1,156) GM 3.0 (3.5) 1.4 (3.4) 25.1 (2.3) 38.4 (4.5) 31.3 (2.2) 82.4 (2.7)
(GSD)
Median 2.9 1.6 25.3 41.3 31.8 79.9
P95 20.4 5.5 86.0 314.6 104.1 385.4
Total AM ± SD 6.0 ± 2.2 ± 2.1 34.1 ± 98.2 ± 208.4 42.4 ± 140.5 ±
13.8 39.4 51.0 221.6
(n =
2,044) GM 3.0 (3.3) 1.4 (3.5) 24.7 (2.3) 41.4 (4.2) 30.9 (2.2) 84.7 (2.6)
(GSD)
Median 3.0 1.7 25.3 43.8 31.9 82.9
P95 19.1 5.6 83.1 338.0 100.9 407.1
InAs: inorganic As [As(III) + As(V)], MMA: monomethylarsonic acid, DMA: dimethylarsinic acid, AsB:
arsenobetaine, TmetAs (sum of inorganic arsenic and their metabolites): InAs + MMA + DMA, TsumAs
(total sum of arsenic measured): InAs + MMA + DMA + AsB, AM: arithmetic mean, SD: standard deviation,
GM: geometric mean, GSD: geometric standard deviation, P95: value at the 95th percentile. Student’s t-
test was performed to compare means (arithmetic and geometric) of various arsenic species between
males and females. ** p < 0.01 from the Student’s t-test
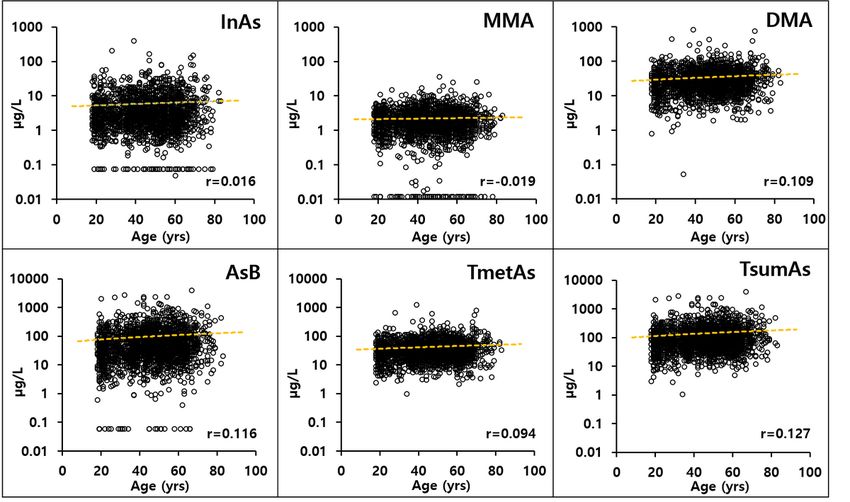
The DMA and AsB levels increased with age and peaked in the forties; however, no significant difference was
observed for urinary InAs and MMA levels by age group. Urinary arsenic levels did not differ generally in
regard to smoking and alcohol consumption as well as education level, income, drinking water, pesticides
used, and residential area size. However, the concentrations (geometric mean) of most arsenic species,
except MMA, were higher in coastal area inhabitants than in inland inhabitants and were higher in those who
had consumed seafood during the past 3 days than in those who had not (Table 2). In multiple regression
analysis, factors contributing to the concentrations of urinary arsenic species, except MMA, were generally
determined based on age, living in coastal areas, and seafood consumption (Table 3).
Page 7/24Table 2
Mean urinary concentrations of various arsenic (As) species based on demographic characteristics (㎍/L)
Class N InAs MMA DMA AsB TmetAs TsumAs
Age 19–29 355 2.8 1.5 20.6 29.1 26.6 66.4
(3.3) (3.1) (2.4)a (4.8)a (2.3)a (2.7)a
(years)
30–39 360 3.1 1.3 23.7 37.8 30.1 78.7
(3.1) (3.8) (2.3)b (4.0)b (2.2)b (2.6)b
40–49 450 3.2 1.6 26.8 47.1 33.2 92.9
(3.1) (3.3) (2.2)c (4.0)c (2.1)b (2.6)c
50–59 475 2.8 1.5 26.2 46.7 32.3 92.2
(3.3) (3.3) (2.1)bc (4.0)c (2.1)b (2.6)c
≥ 60 404 3.0 1.3 25.6 45.8 31.7 91.4
(3.9) (4.0) (2.3)bc (4.1)bc (2.3)b (2.6)c
F-value 1.24 1.63 6.75** 8.05** 4.88** 8.78**
Smoking Non-smoker 1302 3.0 1.4 25.4 39.8 31.7 84.4
(3.4) (3.4) (2.3) (4.4) (2.2) (2.6)
Smoker 740 2.8 1.4 23.6 44.3 29.5 85.1
(3.3) (3.7) (2.3) (3.9) (2.2) (2.7)
t-value 1.16 -0.03 1.93 1.62 1.96* -0.18
Alcohol Non-drinker 496 2.9 1.5 25.3 37.9 31.7 81.7
drinking (3.6) (3.2) (2.3) (4.2) (2.2) (2.7)
Drinker 1538 3.0 1.4 24.6 42.6 30.7 85.8
(3.2) (3.6) (2.2) (4.2) (2.2) (2.6)
t-value -0.58 1.42 0.73 -1.57 0.74 -0.97
Education High 742 2.9 1.4 23.2 38.2 29.3 79.5
school (3.2) (3.7) (2.3)b (4.4) (2.2)b (2.7)
F-value 1.12 0.66 4.20* 1.88 3.04 2.67
InAs: inorganic As [As(III) + As(V)], MMA: monomethylarsonic acid, DMA: dimethylarsinic acid, AsB:
arsenobetaine, TmetAs (sum of inorganic arsenic and their metabolites): InAs + MMA + DMA, TsumAs
(total sum of arsenic measured): InAs + MMA + DMA + AsB, Data are presented as geometric mean and
geometric standard deviation, †: Coastal or inland area was categorized to specify whether each study
site included a seashore. ‡: seafood intake during the 3 days before this study. a,b,c Duncan grouping, * p
< 0.05, ** p < 0.01
Page 8/24Class N InAs MMA DMA AsB TmetAs TsumAs
Income < 1,599 827 2.8 1.4 24.9 40.8 30.9 85.1
(3.5) (3.7) (2.3) (4.5) (2.2) (2.7)
(US$/month)
1,600-3,199 794 3.0 1.5 24.9 42.0 31.2 85.4
(3.2) (3.3) (2.2) (4.2) (2.1) (2.6)
≥ 3,200 305 3.2 1.4 25.6 43.2 32.3 87.6
(3.5) (3.3) (2.4) (3.9) (2.3) (2.6)
F-value 1.55 0.19 0.18 0.20 0.38 0.11
Drinking Self-tap 209 3.0 1.4 24.6 41.6 30.8 82.9
water water (3.0) (4.2) (2.5) (4.1) (2.3) (2.7)
Tap water 672 3.0 1.4 25.0 42.6 31.2 86.3
(3.3) (3.6) (2.2) (4.3) (2.2) (2.6)
Bottled 135 2.6 1.2 24.7 37.6 30.4 82.7
water (3.7) (4.8) (2.2) (5.4) (2.2) (2.7)
Filtered 795 3.0 1.5 24.3 41.2 30.5 84.3
water (3.4) (3.1) (2.3) (4.1) (2.2) (2.7)
Others 214 2.6 1.5 25.3 40.6 31.3 84.2
(3.4) (3.3) (2.2) (4.0) (2.1) (2.4)
F-value 1.17 0.79 0.17 0.23 0.10 0.11
Pesticide No 1720 3.0 1.4 24.8 41.2 31.0 84.9
(3.4) (3.4) (2.2) (4.2) (2.2) (2.6)
Yes 323 3.0 1.5 24.4 42.6 30.4 84.1
(3.2) (3.9) (2.3) (4.0) (2.3) (2.7)
t-value 0.02 -0.59 0.35 -0.40 0.46 0.15
Residence Metropolitan 815 2.9 1.4 25.8 40.3 32.3 87.0
area (3.8) (3.5) (2.2) (4.5) (2.2) (2.6)
size Urban 817 3.1 1.5 23.9 42.2(3.7) 30.1 82.8
(3.1) (3.2) (2.3) (2.2) (2.5)
Rural 412 2.8 1.3 24.2 41.8 29.8(2.2) 83.9
(2.9) (4.0) (2.2) (4.6) (2.8)
F-value 0.85 1.68 2.02 0.23 2.23 0.57
Inhabitant Inland 1541 2.8 1.5 23.9 35.2 29.9 76.1
area† (3.3) (3.3) (2.2) (4.1) (2.1) (2.5)
InAs: inorganic As [As(III) + As(V)], MMA: monomethylarsonic acid, DMA: dimethylarsinic acid, AsB:
arsenobetaine, TmetAs (sum of inorganic arsenic and their metabolites): InAs + MMA + DMA, TsumAs
(total sum of arsenic measured): InAs + MMA + DMA + AsB, Data are presented as geometric mean and
geometric standard deviation, †: Coastal or inland area was categorized to specify whether each study
site included a seashore. ‡: seafood intake during the 3 days before this study. a,b,c Duncan grouping, * p
< 0.05, ** p < 0.01
Page 9/24Class N InAs MMA DMA AsB TmetAs TsumAs
Coastal 503 3.6(3.3) 1.3 27.5 67.5 34.3 117.3
(3.9) (2.4) (4.0) (2.3) (2.9)
t-vale -4.41** 1.69 -3.25** -9.00** -3.27** -8.25**
Seafood No 734 2.6 1.3 21.0 29.2 26.6 65.6
intake‡ (3.4) (3.8) (2.3) (4.5) (2.2) (2.6)
Yes 1295 3.2 1.5 27.2 50.7 33.7 98.1
(3.3) (3.3) (2.2) (3.9) (2.2) (2.6)
t-value 3.51** 1.40 6.98** 8.26** 6.60** 9.17**
InAs: inorganic As [As(III) + As(V)], MMA: monomethylarsonic acid, DMA: dimethylarsinic acid, AsB:
arsenobetaine, TmetAs (sum of inorganic arsenic and their metabolites): InAs + MMA + DMA, TsumAs
(total sum of arsenic measured): InAs + MMA + DMA + AsB, Data are presented as geometric mean and
geometric standard deviation, †: Coastal or inland area was categorized to specify whether each study
site included a seashore. ‡: seafood intake during the 3 days before this study. a,b,c Duncan grouping, * p
< 0.05, ** p < 0.01
Page 10/24Table 3
Contributing factors with significant coefficients of various urinary arsenic (As) species were determined
using multiple regression analysis
Variable InAs MMA DMA AsB TmetAs TsumAs
Age - - 0.003** 0.007** 0.002** 0.005**
Residence area size - - - - -0.025* -
Education level - -0.048* - - - -
Inhabitant area 0.127** - 0.050** 0.259** 0.053** 0.170**
Seafood intake 0.073** - 0.109** 0.217** 0.099** 0.160**
InAs: inorganic As [As(III) + As(V)], MMA: monomethylarsonic acid, DMA: dimethylarsinic acid, AsB:
arsenobetaine, TmetAs (sum of inorganic arsenic and their metabolites): InAs + MMA + DMA, TsumAs
(total sum of arsenic measured): InAs + MMA + DMA + AsB, * p < 0.05, ** p < 0.01
The daily mean food intake of study subject was estimated previously at 1,373.6 ± 652.4 g and 22.0 ± 10.5
g/kg body weight by Seo et al. (2016). Generally, no significant correlation coefficients were observed
between total food consumption and urinary arsenic species, such as InAs, DMA, AsB, TmetAs, and TsumAs,
concentrations (Table 4). However, the consumption of specific food groups significantly correlated with
urinary arsenic levels. Namely, the consumption of fish&shellfish and seaweeds positively correlated with the
concentrations of InAs (r = 0.108, p < 0.01 for fish&shellfish; r = 0.234, p < 0.01 for seaweeds) and DMA (r =
0.167, p < 0.01 for fish&shellfish; r = 0.178 p < 0.01 for seaweeds), but not with the MMA concentration
(Table 4). The concentration of AsB showed a significantly high association with the consumption of
fish&shellfish (r = 0.234, p < 0.01) but was not related to seaweeds consumption (Table 4). Furthermore,
dose-dependent increases of InAs, DMA, and AsB levels were observed according to the amount of
fish&shellfish consumed. However, dose-dependent increases based on the level of seaweeds consumption
were observed for InAs and DMA only, and AsB levels did not significantly differ statistically based on the
amount of seaweeds consumed (Table 5). Daily intake of grain, which included 17 kinds of food items
including rice, wheat, noodles, and so on, as described in a previous study (Seo et al., 2016), was positively
correlated with the concentrations of MMA and DMA but not with those of InAs and AsB. Specifically, the
amount of rice intake was statistically significantly correlated with the concentrations of InAs, MMA, DMA,
and TmetAs, but not of AsB (Tables 4 and 5). Flavorings also correlated with various urinary arsenic species,
except for MMA (Table 4). Moreover, the urinary concentrations of MDA and c-peptide significantly increased
according to the levels of all arsenic species as well as TmetAs and TsumAs in a dose-dependent manner
(Table 6).
Page 11/24Table 4
Daily food intakes and Spearman's correlation coefficients, adjusted for sex, age, inhabitant area, and body
weight, in different concentrations of urinary arsenic (As) species and daily consumption from each food
group
Group Food intake InAs MMA DMA AsB TmetAs TsumAs
(g/day,%)‡
Grains 390.6 ± 351.7 0.035 0.078** 0.063** -0.016 0.058** 0.005
(28.4%)
Potatoes 35.9 ± 86.6 (2.6%) -0.008 0.009 -0.041 -0.075** -0.035 -0.067**
Sugars 10.5 ± 9.9 (0.8%) 0.030* -0.014 0.020 -0.004 0.021 0.008
Pulse 35.0 ± 64.2 (2.5%) 0.024 0.031 0.005 -0.032 0.010 -0.014
Seeds 0.8 ± 3.2 (0.1%) 0.020 -0.012 0.014 0.001 0.013 0.001
Vegetables 288.7 ± 201.2 0.011 -0.035 0.026 0.035 0.019 0.031
(21.0%)
Mushrooms 3.5 ± 15.4 (0.3%) 0.021 0.016 0.006 -0.001 0.008 0.000
Fruits 138.8 ± 252.9 -0.032 -0.029 -0.017 -0.014 -0.023 -0.021
(10.1%)
Meats 64.1 ± 98.0 (4.7%) -0.006 -0.048* -0.037 -0.011 -0.034 -0.022
Eggs 25.3 ± 40.7 (1.8%) 0.011 -0.026 -0.013 -0.020 -0.012 -0.021
Fish/Shellfish 59.0 ± 82.0 (4.3%) 0.108** 0.032 0.167** 0.234** 0.160** 0.236**
Seaweeds 1.8 ± 9.0 (0.1%) 0.234** 0.039 0.178** 0.037 0.197** 0.108**
Milks 76.9 ± 148.5 (5.6%) 0.016 -0.007 0.003 -0.004 0.006 -0.001
Oils 11.6 ± 9.4 (0.8%) 0.065** -0.025 0.027 -0.024 0.034 -0.003
Beverage 197.1 ± 346.3 -0.023 -0.114** -0.045* 0.023 -0.050* 0.002
(14.4%)
Flavorings 34.1 ± 33.9 (2.5%) 0.045* -0.022 0.050* 0.067** 0.046* 0.063**
Total 1373.6 ± 652.4 -0.003 -0.044* 0.018 0.021 0.009 0.016
(100%)
(22.0 ± 10.5)a
InAs: inorganic As [As(III) + As(V)], MMA: monomethylarsonic acid, DMA: dimethylarsinic acid, AsB:
arsenobetaine, TmetAs (sum of inorganic arsenic and their metabolites): InAs + MMA + DMA, TsumAs
(total sum of arsenic measured): InAs + MMA + DMA + AsB, ‡: Seo et al. (2016), a: Values per kg body
weight basis (g/kg body weight/day); data are presented as mean and standard deviation, * p < 0.05, ** p
< 0.01
Page 12/24Table 5
Mean concentrations of various urinary arsenic (As) species (㎍/L) according to the consumption amounts of
fish/shellfish, seaweeds, and rice
Group N InAs MMA DMA AsB TmetAs TsumAs
Fish/shellfish below 1263 2.7 1.4 22.5 32.7 28.3 71.1
consumption (g) 50 (3.4)a (3.6) (2.2)a (4.1)a (2.2)a (2.5)a
50– 358 3.3 1.5 26.4 50.4(4.1)b 33.0 98.3
99 (2.9)b (3.0) (2.2)b (2.1)b (2.5)b
100– 310 3.4 1.4 28.5 60.5(3.9)b 35.2 111.0
199 (3.4)b (3.5) (2.3)b (2.2)b (2.7)b
≥ 200 131 3.8 1.7 35.6 91.9 43.2 153.8
(3.2)b (2.9) (2.3)c (3.7)c (2.2)c (2.8)c
F- 6.55** 1.54 18.68** 35.87** 17.26** 43.25**
value
Seaweeds below 1325 2.5 1.4 22.4 39.4 (4.2) 27.9 78.2
consumption (g) 1.0 (3.2)a (3.4) (2.2)a (2.2)a (2.6)a
1.0- 174 3.2 1.5 25.3 45.2 (4.7) 31.7 92.7
1.9 (3.1)b (3.2) (2.2)ab (2.1)a (2.8)b
2.0- 163 3.6 1.5 28.8 43.8 (3.9) 36.2 93.3
2.9 (3.3)b (3.5) (2.1)bc (2.00)b (2.4)b
≥ 3.0 400 4.8 1.5 31.5 45.4 (4.1) 40.2 100.8
(3.3)c (3.9) (2.2)c (2.2)b (2.6)b
F- 34.01** 0.28 20.70** 1.36 25.86** 8.29**
value
Rice below 437 2.5 1.3 22.3 37.0 (4.0) 28.0 75.7
100 (3.5)a (3.2)a (2.3)a (2.2)a (2.6)a
consumption
100– 809 3.0 1.4 23.8 40.4 (4.1) 29.8 82.3
(g) 199 (3.3)ab (3.4)ab (2.2)ab (2.2)a (2.6)ab
200– 641 3.2 1.6 26.9 44.3(4.4) 33.6 92.0
299 (3.3)b (3.5)ab (2.2)bc (2.1)b (2.6)b
≥ 300 143 3.2 1.6 28.5 48.0 (4.0) 35.2 94.3
(3.2)b (4.4)b (2.3)c (2.2)b (2.9)b
F- 3.46* 2.65* 6.91** 1.99 6.74** 4.38**
value
InAs: inorganic As [As(III) + As(V)], MMA: monomethylarsonic acid, DMA: dimethylarsinic acid, AsB:
arsenobetaine, TmetAs (sum of inorganic arsenic and their metabolites): InAs + MMA + DMA, TsumAs
(total sum of arsenic measured): InAs + MMA + DMA + AsB; data are presented as geometric mean and
geometric standard deviation, a,b,c Duncan grouping, * p < 0.05, ** p < 0.01
Page 13/24Table 6
Mean urinary concentrations of MDA (µmol/g creatinine) and c-peptide (µg/day) according to the urinary
arsenic (As) levels in study subjects
As Level MDA c-peptide
Mean ± SD F-value Mean ± SD F-value
InAs G1 1.389 ± 1.308a 8.54** 34.048 ± 29.756a 5.43**
G2 1.676 ± 1.491b 40.629 ± 37.066b
G3 1.753 ± 1.476b 40.990 ± 32.899b
G4 1.826 ± 1.628b 41.305 ± 34.604b
MMA G1 1.330 ± 1.282a 33.04** 34.137 ± 30.989a 10.69**
G2 1.448 ± 1.141a 36.354 ± 33.159a
G3 1.697 ± 1.495b 41.790 ± 34.088b
G4 2.168 ± 1.812c 44.712 ± 35.821b
DMA G1 1.267 ± 1.182a 28.13** 33.406 ± 29.838a 10.35**
G2 1.509 ± 1.132b 37.426 ± 32.140a
G3 1.815 ± 1.513c 44.082 ± 38.254b
G4 2.049 ± 1.883d 42.046 ± 33.450b
AsB G1 1.370 ± 1.318a 13.59** 33.509 ± 30.228a 13.68**
G2 1.568 ± 1.443b 36.374 ± 31.655a
G3 1.790 ± 1.551c 41.070 ± 35.443b
G4 1.914 ± 1.573c 46.004 ± 36.231c
TmetAs G1 1.271 ± 1.197a 27.87** 33.416 ± 29.749a 10.98**
G2 1.522 ± 1.212b 37.019 ± 31.129a
G3 1.783 ± 1.394c 44.131 ± 39.042b
SD: standard deviation, InAs: inorganic As [As(III) + As(V)], MMA: monomethylarsonic acid, DMA:
dimethylarsinic acid, AsB: arsenobetaine, TmetAs: InAs + MMA + DMA, TsumAs: InAs + MMA + DMA +
AsB. The levels of various As species were divided into quartiles, such as G1, G2, G3 and G4; Urine As
level criteria are as follows: P25 = 1.539, P50 = 2.949, P75 = 6.205 ㎍/L for InAS; P25 = 1.033, P50 = 1.728,
P75 = 2.773 ㎍/L for MMA; P25 = 15.199, P50 = 25.286, P75 = 42.207 ㎍/L for DMA; P25 = 19.867, P50 =
43.820, P75 = 99.757 ㎍/L for AsB; P25 = 18.766, P50 = 31.875, P75 = 51.141 ㎍/L for TmetAs; P25 =
45.460, P50 = 82.854, P75 = 157.769 ㎍/L for TsumAs, Data are presented as mean and standard
deviation, a,b,c,d Duncan grouping, ** p < 0.01
Page 14/24G4 2.065 ± 1.916d 42.396 ± 33.514b
TsumAs G1 1.249 ± 1.119a 24.22** 32.132 ± 29.243a 15.39**
G2 1.638 ± 1.563b 37.195 ± 33.626b
G3 1.732 ± 1.276b 42.283 ± 34.185c
G4 2.022 ± 1.800c 45.352 ± 36.316c
SD: standard deviation, InAs: inorganic As [As(III) + As(V)], MMA: monomethylarsonic acid, DMA:
dimethylarsinic acid, AsB: arsenobetaine, TmetAs: InAs + MMA + DMA, TsumAs: InAs + MMA + DMA +
AsB. The levels of various As species were divided into quartiles, such as G1, G2, G3 and G4; Urine As
level criteria are as follows: P25 = 1.539, P50 = 2.949, P75 = 6.205 ㎍/L for InAS; P25 = 1.033, P50 = 1.728,
P75 = 2.773 ㎍/L for MMA; P25 = 15.199, P50 = 25.286, P75 = 42.207 ㎍/L for DMA; P25 = 19.867, P50 =
43.820, P75 = 99.757 ㎍/L for AsB; P25 = 18.766, P50 = 31.875, P75 = 51.141 ㎍/L for TmetAs; P25 =
45.460, P50 = 82.854, P75 = 157.769 ㎍/L for TsumAs, Data are presented as mean and standard
deviation, a,b,c,d Duncan grouping, ** p < 0.01
Discussion
In our study, the geometric mean concentrations of various arsenic species in urine were 3.0, 1.4, 24.7, and
41.4 ㎍/L of inorganic arsenic, MMA, DMA, and AsB, respectively; therefore, TmetAs and TsumAs were 30.9
and 84.7 ㎍/L, respectively. The urinary arsenic level in the general adult population of Korea was
considerably higher than that of the United States (7.3 ㎍/L < no seafood > and 24.5 ㎍/L < with seafood > of
the median total arsenic, Navas-Acien et al., 2011; 4.76 ㎍/L of the median TmetAs and 5.79 ㎍/L of the
median AsB, Gilbert-Diamond et al., 2013), France (3.75 ㎍/L of of the geometric mean TmetAs and 13.42 ㎍/L
of the geometric mean total arsenic, Saoudi et al., 2012), Germany (4.9 ㎍/L of the arithmetic mean TmetAs
and 10.8 ㎍/L of the arithmetic mean TsumAs, Heitland and Köster, 2008), and United Kingdom (3.6 ㎍/L of the
arithmetic mean TmetAs and 33.9 ㎍/L of the arithmetic mean TsumAs, Morton and Leese, 2011), but was
similar to or lower than that of Taiwan (86.08 ㎍/L of the arithmetic mean TmetAs and 267.05 ㎍/L of the
arithmetic mean total arsenic in a previously contaminated area, Hsueh et al., 1998; 57.08 ㎍/L of the
arithmetic mean TmetAs in a previously contaminated area, Huang et al., 2009; 20.94 ㎍/g creatinine of the
arithmetic mean TmetAs, Huang et al., 2012), Japan (141.3 ㎍/L of the median total arsenic, Hata et al., 2007;
132.2 ㎍/L of the median total arsenic, Suzuki et al., 2009), and China (28.3 ㎍/L of the arithmetic mean
TmetAs of the control, Wen et al., 2011; 56 ㎍/L of the arithmetic mean TmetAs, Cui et al., 2013). In addition,
approximately 44.0% of this study subjects (900/2,044) had urinary TmetAs over 35 ㎍/L of the biological
exposure index (BEI, ACGIH, 2014); approximately 26.3% of study subjects (537/2,044) had urinary TmetAs
exceeding 50 ㎍/L of the biological limit value (BLV, DFG, 2017).
Diet, especially seafood, was the main source of arsenic exposure in the general population who lived in
arsenic non-polluted areas. Previously, several studies reported that seafood intake was associated with
urinary arsenic concentrations (Navas-Acien et al., 2011; Bae et al., 2017; Signes-Pastor et al., 2017). In our
study, urinary concentrations of various arsenic species, such as InAs, DMA, and AsB, were significantly
higher in people who ate seafood, including fish/shellfish and seaweeds, during the 3 days before the
Page 15/24personal interview than in those who did not. Additionally, the urinary concentrations of arsenic were higher
in inhabitants of the coastal area than in those living inland, highlighting that seafood may be a major
source of arsenic exposure in the general population (Luvonga et al., 2020). In our study, the distributions of
urinary arsenic profiles were quite different from those in Western countries, including the United States. The
relative proportions of AsB and TmetAs in relation to TsumAs were approximately 57% and 43%, respectively,
in our study population. In contrast, the relative proportions of AsB in relation to TsumAs or the levels of AsB
in urine were much lower in the general populations of Western countries, such as the United States,
Germany, and France, than in Koreans (Heitland and Köster, 2008; Caldwell et al., 2009; Saoudi et al., 2012).
Thus, the Korean general population is exposed to a higher arsenic level than the populations of Western
countries, and AsB was a dominant contributor to the total arsenic exposure.
AsB is essentially a non-toxic and rapidly excreted compound, with a relatively high concentration in seafood
(Wolle and Conklin, 2018). In our previous study, total urinary arsenic concentrations measured using ICP-
MS were associated with the amount of seafood consumption (Bae et al., 2017). Furthermore, the speciation
analyses of urinary arsenic indicated a major source of organic arsenic, namely, AsB, which was
significantly associated with the consumption of fish/shellfish but not of seaweeds. Moreover, the urinary
AsB concentration increased with the amount of fish/shellfish consumption in a dose-dependent pattern;
seaweeds intake positively correlated with urinary InAs and DMA concentrations, and dose-dependent
increases of InAs and DMA were observed according to the seaweeds consumption. However, seaweeds
intake was not statistically associated with urinary concentrations of AsB. These findings indicate that
seaweeds might afford inorganic arsenic rather than organic species (from fish/shellfish) in the Korean
population. Nonetheless, the urinary concentrations of InAs and DMA positively correlated with fish/shellfish
intake and increased according to the amount of fish/shellfish consumption, which might indicate that
fish/shellfish is a part of InAs exposure source in Koreans.
However, the contributing mechanism remains to be understood as to whether a little amount of InAs in
fish/shellfish, which is much consumed favorite food in Korea (Sirot et al., 2009; Seo et al., 2016), any kind
of labile organic arsenic in fish/shellfish (Choi et al., 2010; Luvonga et al., 2020) as well as both and other
foods might be source of arsenic exposure.
Inhabitants in arsenic contaminated area could be exposed to arsenic mainly through contaminated drinking
water or harvested crops in the contaminated soil, which has previously caused the so-called “black foot
disease” in Taiwan, Bangladesh, and elsewhere (Tseng, 1977; Smith et al., 2000; Nordstrom, 2002; Sun et al.,
2007). Others could be exposed through inhalation or ingestion in the industry or accidentally (Morton and
Mason, 2006; Heitland and Köster, 2008; Wen et al., 2011). However, urinary arsenic profiles show a different
pattern according to the exposure source of arsenic. Our data present a high proportion of AsB (56.7%) and
a relatively low proportion of TmetAs (43.3%) in TsumAs, but a relatively high proportion of DMA (80.8%) in
TmetAs with low proportions and concentrations of InAs and MMA. Despite a relatively low concentration of
AsB and high concentration of TmetAs, a relatively low concentration of DMA with a high concentration of
InAs and MMA in TmetAs were observed in inhabitants of arsenic-contaminated areas or in workers
occupationally exposed to arsenic in industries (Morton and Mason, 2006; Sun et al., 2007; Wen et al., 2011).
Differences in urinary arsenic profiles by arsenic exposure levels could be explained based on a previous
Page 16/24study by Huang et al. (2009), which presented changes in urinary arsenic profiles, such as the decreased
proportion of InAs (–4.9%) and MMA (–6.8%) and increased DMA (11.7%), after cessation of arsenic
ingestion for 15 years in people residing in the arsenic-contaminated area of Taiwan. Therefore, the
speciation analyses of arsenic are essential for evaluating the health risk from arsenic exposure, especially
in countries where populations mainly consume seafood, such as Korea.
In our previous study, increased urinary excretion of DMA was observed after seafood consumption in
volunteers (Choi et al., 2010). Thus, a labile organoarsenic such as arsenosugar and arsenolipd could be
metabolized to DMA, which is more toxic than the original form of organoarsenic (Molin et al., 2014;
Luvonga et al., 2020). Furthermore, this study showed significantly higher urinary DMA concentrations in
subjects who consumed seafood during the 3 days before the personal interview than in those who did not.
Seafood is known as a healthy food, especially for growing children, pregnant women, and the elderly, as it
is a rich source of essential amino acids, unsaturated fatty acids (omega 3 & 6), vitamins, and minerals
(Mozaffarian and Rimm, 2006; Venugopal and Gopakumar, 2017). However, it remains to be elucidated
whether overconsumption of seafood may increase exposure to hazardous arsenic species and result in
toxicological implications.
Human exposure to the most hazardous metals, such as lead, mercury, and cadmium, are generally
influenced by individual lifestyles, such as smoking and alcohol consumption, socioeconomic status, as well
as sex and age in the general population (McKelvey et al., 2007; Eom et al., 2018). However, there were no
observed prominent differences in urinary arsenic levels based on sex, smoking and alcohol consumption,
economic and educational levels, residential area size, and pesticide used in our study. The factors affecting
arsenic exposure in humans were quite different from those for other metals. Diet, especially seafood, and
residential area (inland or coastal) mainly contributed to determining the human exposure levels to various
arsenic species in our study population. Additionally, the amount of rice intake associated with the urinary
levels of inorganic arsenic and its metabolites. Our finding is consistent with previous reports where rice
consumption contributed to inorganic arsenic exposure (Wei et al., 2014; Signes-Pastor et al., 2017). Rice is a
staple food and one of the major sources of inorganic arsenic exposure in Koreans (Seo et al., 2016).
However, the levels of human arsenic exposure among individuals or countries could be affected by several
factors, including lifestyles, dietary habits, and geological contamination (Vahter et al., 2000; Mandal and
Suzuki, 2002; Minatel et al., 2018). Moreover, it is well known that drinking water is a principal contributing
factor to arsenic exposure (Smith et al., 2000; Sun et al., 2007; Huang et al., 2009). In this study, there was no
difference in the urinary concentrations of various arsenic species in the study subjects according to the
type of drinking water used. The concentration of arsenic in drinking water is well regulated, with a standard
limit of < 10 ㎍/L in Korea. Water supply is available for 99.3% of the population, the mean arsenic
concentration in the water supply is < 1 ㎍/L, and only 3 times were reported as exceeding a standard limit in
the supplied water during the last 10 years (MOE, 2021). Nevertheless, as the concentration of arsenic in
drinking water was not analyzed in this study, our findings do not suggest that groundwater is safe from
arsenic contamination. In a previous nationwide survey of arsenic concentrations in groundwater, about 98%
of 722 groundwater had < 10 ㎍/L (Park et al., 2016).
Page 17/24Taken together, the big difference in the urinary concentrations of TmetAs, which is a toxicologically relevant
arsenic species, between Korean (30.9 ㎍/L) and European/American (3–5 ㎍/L) populations could be possibly
explained mainly by their dietary habits. Particularly, the amount of rice consumption is much higher in
Koreans, at 62 ㎏/person/year, than in Europeans, at 6 ㎏/person/year (OECD/FAO, 2021). Moreover, Koreans
eat higher amounts of seafood and fish, at 56 ㎏/person/year, than Europeans, at 23 ㎏/person/year
(OECD/FAO, 2021). The significant portion of the seafood consumed by Koreans is made up of crustacean
and mollusk which contain relatively high levels of inorganic arsenic and DMA compared to fish (Sioen et al.,
2009; Taylor et al., 2017). Seaweeds, such as dried tangle, dried laver, and kelp, contain high levels of
inorganic arsenic (Seo et al., 2016). Koreans consume considerably more seaweeds, at 33 kg/person/year,
than Europeans/Americans, who consume very little seaweeds, if at all (FAO, 2021). Nevertheless, it is
necessary a more comprehensive study to assess the risk conferred by contributing factors to the arsenic
exposure of Koreans and to develop effective exposure-reduction measures.
Previous epidemiologic studies suggested that chronic arsenic exposure may induce metabolic syndrome,
diabetes, atherosclerosis and cancer, which could be associated with the increased oxidative stress (De
Vizcaya-Ruiz et al., 2009; James et al., 2015; Kuo et al., 2017; Spratlen et al., 2018). C-peptide is a small
peptide by-product of insulin synthesis from proinsulin that may be associated with metabolic disease
(Suzuki et al., 1997; Kim and Lee, 2017; Yaribeygi et al., 2019). In our study, the increase of MDA and c-
peptide concentrations was shown to occur in a dose-dependent pattern according to the urinary
concentrations of various arsenic species. These findings suggest that environmental arsenic exposure
might be a potential cause of metabolic diseases, such as diabetes mellitus and atherosclerosis, through
oxidative stress and endogenous endocrine effects; however, further studies are needed to improve our
understanding and to protect the general public from environmental pollutants.
In summary, urinary arsenic concentrations in the adult population in the Republic of Korea was similar to or
lower than those in other Asian countries but higher than those in Western countries, including the United
States. Overall, our findings suggest that seafood and rice are the main sources of arsenic exposure in
Korean adults. Furthermore, overconsumption of seafood might be the main source of exposure to organic
arsenic also additional exposure source to inorganic arsenic, which primarily exposed by rice. All of this
might have a potentially detrimental effect on human health.
Declarations
Acknowledgements
This study was supported by a Grant (14162MFDS654) from the Ministry of Food and Drug Safety in 2014.
Conflicts of interest
The authors declare no conflicts of interest.
Authors’ contributions
Page 18/24Seul-Gi Lee: Writing – Original Draft, Investigation. Ingu Kang: Investigation, Methodology. Mi-Na Seo:
Investigation, Resources. Jung-Eum Lee: Formal Analysis, Data Curation. Sang-Yong Eom: Resources,
Formal Analysis, Software. Myung-Sil Hwang: Formal Analysis, Data Curation. Kyung Su Park: Methodology,
Validation. Byung-Sun Choi: Methodology, Resources, Formal Analysis, Data Curation. Ho-Jang Kwon:
Conceptualization, Resources, Data Curation. Young-Seoub Hong: Resources, Methodology. Heon Kim:
Conceptualization, Resources, Writing - Review & Editing. Jung-Duck Park: Conceptualization, Writing -
Original Draft, Writing - Review & Editing, Supervision.
References
1. ACGIH (2014) TLV® and BEIs based on the documentation of the threshold limit values for chemical
substances and physical agents & biological exposure indices. ACGIH, Cincinnati
2. Agarwal R, Chase SD (2002) Rapid, fluorimetric-liquid chromatographic determination of
malondialdehyde in biological samples. J Chromatogr B Analyt Technol Biomed Life Sci 775:121–126
3. ATSDR (2007) Toxicological profile for arsenic. Agency for Toxic Substances and Disease Registry.
Division of Toxicology, Atlanta
4. Bae HS, Kang IG, Lee SG, Eom SY, Kim YD, Oh SY, Kwon HJ, Park KS, Kim H, Choi BS, Yu IJ, Park JD
(2017) Arsenic exposure and seafood intake in Korean adults. Hum Exp Toxicol 36:451–460
5. Buchet JP, Lauwerys R, Roels H (1981) Comparison of the urinary excretion of arsenic metabolites after
a single oral dose of sodium arsenite, monomethylarsonate, or dimethylarsinate in man. Int Arch Occup
Environ Health 48:71–79
6. Caldwell KL, Jones RL, Verdon CP, Jarrett JM, Caudill SP, Osterloh JD (2009) Levels of urinary total and
speciated arsenic in the US population: National Health and Nutrition Examination Survey 2003–2004.
J Expo Sci Environ Epidemiol 19:59–68
7. Choi BS, Choi SJ, Kim DW, Huang M, Kim NY, Park KS, Kim CY, Lee HM, Yum YN, Han ES, Kang TS, Yu IJ,
Park JD (2010) Effects of repeated seafood consumption on urinary excretion of arsenic species by
volunteers. Arch Environ Contam Toxicol 58:222–229
8. Cui J, Shi J, Jiang G, Jing C (2013) Arsenic levels and speciation from ingestion exposures to
biomarkers in Shanxi, China: implications for human health. Environ Sci Technol 47:5419–5424
9. De Vizcaya-Ruiz A, Barbier O, Ruiz-Ramos R, Cebrian ME (2009) Biomarkers of oxidative stress and
damage in human populations exposed to arsenic. Mutat Res 674:85–92
10. Deutsche Forschungsgemeinschaft (DFG) (2017) List of MAK and BAT Values 2017. Permanent Senate
Commission for the Investigation of Health Hazards of Chemical Compounds in the Work Area. Report
53. WILEY-VCH Verlag GmbH & Co. KGaA, Weinheim
11. Eom SY, Choi SH, Ahn SJ, Kim DK, Kim DW, Lim JA, Choi BS, Shin HJ, Yun SW, Yoon HJ, Kim YM, Hong
YS, Yun YW, Sohn SJ, Kim H, Park KS, Pyo HS, Kim H, Oh SY, Kim J, Lee SA, Ha M, Kwon HJ, Park JD
(2014) Reference levels of blood mercury and association with metabolic syndrome in Korean adults.
Int Arch Occup Environ Health 87:501–513
Page 19/2412. Eom SY, Lee YS, Lee SG, Seo MN, Choi BS, Kim YD, Lim JA, Hwang MS, Kwon HJ, Kim YM, Hong YS,
Sohn SJ, Park KS, Pyo HS, Kim H, Kim H, Park JD (2018) Lead, mercury, and cadmium exposure in the
Korean general population. J Korean Med Sci 33:e9
13. FAO (2021) New Food Balances (database). FAOSTAT. http://www.fao.org/faostat/en/#data/FBS.
Accessed 13 May 2021
14. Gilbert-Diamond D, Li Z, Perry AE, Spencer SK, Gandolfi AJ, Karagas MR (2013) A population-based
case–control study of urinary arsenic species and squamous cell carcinoma in New Hampshire, USA.
Environ Health Perspect 121:1154–1160
15. Hata A, Endo Y, Nakajima Y, Ikebe M, Ogawa M, Fujitani N, Endo G (2007) HPLC-ICP-MS speciation
analysis of arsenic in urine of Japanese subjects without occupational exposure. J Occup Health
49:217–223 ()
16. Heitland P, Köster HD (2008) Fast determination of arsenic species and total arsenic in urine by HPLC-
ICP-MS: Concentration ranges for unexposed German inhabitants and clinical case studies. J Anal
Toxicol 32:308–314
17. Hindmarsh JT (2002) Caveats in hair analysis in chronic arsenic poisoning. Clin Biochem 35:1–11
18. Hornung RW, Reed LD (1990) Estimation of average concentration in the presence of nondetectable
values. Appl Occup Environ Hyg 5:46–51
19. Hsueh YM, Huang YL, Huang CC, Wu WL, Chen HM, Yang MH, Lue LC, Chen CJ (1998) Urinary levels of
inorganic and organic arsenic metabolites among residents in an arseniasis-hyperendemic area in
Taiwan. J Toxicol Environ Health Part A 54:431–444
20. Huang CY, Su CT, Chung CJ, Pu YS, Chu JS, Yang HY, Wu CC, Hsueh YM (2012) Urinary total arsenic and
8-hydroxydeoxyguanosine are associated with renal cell carcinoma in an area without obvious arsenic
exposure. Toxicol Appl Pharmacol 262:349–354
21. Huang YK, Huang YL, Hsueh YM, Wang JTJ, Yang MH, Chen CJ (2009) Changes in urinary arsenic
methylation profiles in a 15-year interval after cessation of arsenic ingestion in Southwest Taiwan.
Environ Health Perspect 117:1860–1866
22. James KA, Byers T, Hokanson JE, Meliker JR, Zerbe GO, Marshall JA (2015) Association between
lifetime exposure to inorganic arsenic in drinking water and coronary heart disease in Colorado
residents. Environ Health Perspect 123:128–134
23. Kim MS, Lee DY (2017) Urinary glucose screening for early detection of asymptomatic type 2 diabetes
in Jeonbuk province Korean schoolchildren. J Korean Med Sci 32:985–991
24. Kuo CC, Moon KA, Wang SL, Silbergeld E, Navas-Acien A (2017) The Association of arsenic metabolism
with cancer, cardiovascular disease, and diabetes: a systematic review of the epidemiological evidence.
Environ Health Perspect 125(8):087001
25. Lim JA, Kwon HJ, Ha M, Kim H, Oh SY, Kim JS, Lee SA, Park JD, Hong YS, Sohn SJ, Pyo H, Park KS, Lee
KG, Kim YD, Jun S, Hwang MS (2015) Korean research project on the integrated exposure assessment
of hazardous substances for food safety. Environ Health Toxicol 30:e2015004
26. Link B, Gabrio T, Piechotowski I, Zöllner I, Schwenk M (2007) Baden-Wuerttemberg environmental health
survey (BW-EHS) from 1996 to 2003: toxic metals in blood and urine of children. Int J Hyg Environ
Page 20/24Health 210:357–371
27. Luvonga C, Rimmer CA, Yu LL, Lee SB (2020) Organoarsenicals in seafood: occurrence, dietary
exposure, toxicity, and risk assessment considerations – a review. J Agric Food Chem 68:943–960
28. Ma M, Le XC (1998) Effect of arsenosugar ingestion on urinary arsenic speciation. Clin Chem 44:539–
550
29. Mandal BK, Suzuki KT (2002) Arsenic round the world: a review. Talanta 58:201–235
30. McKelvey W, Gwynn RC, Jaffery N, Kass D, Thorpe LE, Garg RK (2007) A biomonitoring study of lead,
cadmium and mercury in the blood of New York city adults. Environ Health Perpect 115:1435–1441
31. Middleton DRS, Watts MJ, Hamilton EM, Fletcher T, Leonardi GS, Close RM, Exley KS, Crabbe H, Polya
DA (2016) Prolonged exposure to arsenic in UK private water supplies: toenail, hair and drinking water
concentrations. Environ Sci Process Impacts 18:562–574
32. Minatel BC, Sage AP, Anderson C, Hubaux R, Marshall EA, Lam WL, Martinez VD (2018) Environmental
arsenic exposure: From genetic susceptibility to pathogenesis. Environ Int 112:183–197
33. Ministry of Environment (MOE) (2021) National Waterworks Information System.
https://www.waternow.go.kr/web/lawData/search. Accessed 26 May 2021
34. Molin M, Ulven SM, Dahl L, Goessler W, Fliegel D, Holck M, Sloth JJ, Oshaug A, Alexander J, Meltzer HM,
Ydersbond TA (2014) Urinary excretion of arsenicals following daily intake of various seafoods during a
two weeks intervention. Food Chem Toxicol 66:76–88
35. Morton J, Leese E (2011) Arsenic speciation in clinical samples: urine analysis using fast micro-liquid
chromatography ICP-MS. Anal Bioanal Chem 399:1781–1788
36. Morton J, Mason H (2006) Speciation of arsenic compounds in urine from occupationally unexposed
and exposed persons in the U.K. using a routine LC-ICP-MS method. J Anal Toxicol 30:293–301
37. Mozaffarian D, Rimm EB (2006) Fish intake, contaminants, and human health: evaluating the risks and
the benefits. JAMA 296:1885–1899
38. Navas-Acien A, Francesconi KA, Silbergeld EK, Guallar E (2011) Seafood intake and urine concentrations
of total arsenic, dimethylarsinate and arsenobetaine in the US population. Environ Res 111:110–118
39. Nordstrom DK (2002) Public health. Worldwide occurrences of arsenic in ground water. Science
296:2143–2145
40. OECD/FAO (2021) OECD-FAO Agricultural Outlook (Edition 2020). OECD Agriculture Statistics
(database). https://doi.org/10.1787/4919645f-en. Accessed 13 May 2021
41. Park JD, Choi SJ, Choi BS, Lee CR, Kim H, Kim YD, Park KS, Lee YJ, Kang S, Lim KM, Chung JH (2016)
Arsenic levels in the ground waters of Korea and the urinary excretion among contaminated area. J
Expo Sci Environ Epidemiol 26:458–463
42. Petrick JS, Jagadish B, MashEA, Aposhian HV (2001) Monomethylarsonous acid (MMA(III)) and
arsenite: LD(50) in hamsters and in vitro inhibition of pyruvate dehydrogenase. Chem Res Toxicol
14:651–656
43. Saoudi A, Zeghnoun A, Bidondo ML, Garnier R, Cirimele V, Persoons R, Fréry N (2012) Urinary arsenic
levels in the French adult population: the French National Nutrition and Health Study, 2006–2007. Sci
Page 21/24Total Environ 433:206–215
44. Schuhmacher–Wolz U, Dieter HH, Klein D, Schneider K (2009) Oral exposure to inorganic arsenic:
evaluation of its carcinogenic and non-carcinogenic effects. Crit Rev Toxicol 39:271–298
45. Seo MN, Lee SG, Eom SY, Kim J, Oh SY, Kwon HJ, Kim H, Choi BS, Yu IJ, Park JD (2016) Estimation of
total and inorganic arsenic intake from the diet in Korean adults. Arch Environ Contam Toxicol 70:647–
656
46. Signes-Pastor AJ, Vioque J, Navarrete-Muñoz EM, Carey M, García de la Hera M, Sunyer J, Casas M,
Riaño-Galán I, Tardón A, Llop S, Amorós R, Amiano P, Bilbao JR, Karagas MR, Meharg AA (2017)
Concentrations of urinary arsenic species in relation to rice and seafood consumption among children
living in Spain. Environ Res 159:69–75
47. Sioen I, De Henauw S, Van Camp J, Volatier JL, Leblanc JC (2009) Comparison of the nutritional–
toxicological conflict related to seafood consumption in different regions worldwide. Regul Toxicol
Pharmacol 55:219–228
48. Sirot V, Guérin T, Volatier JL, Leblanc JC (2009) Dietary exposure and biomarkers of arsenic in
consumers of fish and shellfish from France. Sci Total Environ 407:1875–1885
49. Smith AH, Lingas EO, Rahman M (2000) Contamination of drinking-water by arsenic in Bangladesh: a
public health emergency. Bull World Health Organ 78:1093–1103
50. Spratlen MJ, Grau-Perez M, Best LG, Yracheta J, Lazo M, Vaidya D, Balakrishnan P, Gamble MV,
Francesconi KA, Goessler W, Cole SA, Umans JG, Howard BV, Navas-Acien A (2018) The association of
arsenic exposure and arsenic metabolism with the metabolic syndrome and its individual components:
prospective evidence from the Strong Heart Family Study. Am J Epidemiol 187:1598–1612
51. Stýblo M, Drobná Z, Jaspers I, Lin S, Thomas DJ (2002) The role of biomethylation in toxicity and
carcinogenicity of arsenic: a research update. Environ Health Perspect 110(Suppl 5):767–771
52. Sun G, Xu Y, Li X, Jin Y, Li B, Sun X (2007) Urinary arsenic metabolites in children and adults exposed to
arsenic in drinking water in Inner Mongolia, China. Environ Health Perspect 115:648–652
53. Suzuki Y, Iizuka T, Kobayashi T, Nishikawa T, Atsumi Y, Kadowaki T, Oka Y, Kadowaki H, Taniyama M,
Hosokawa K, Asahina T, Matsuoka K (1997) Diabetes mellitus associated with the 3243 mitochondrial
tRNALeu(UUR) mutation: insulin secretion and sensitivity. Metabolism 46:1019–1023
54. Suzuki Y, Shimoda Y, Endo Y, Hata A, Yamanaka K, Endo G (2009) Rapid and effective speciation
analysis of arsenic compounds in human urine using anion-exchange columns in HPLC-ICP-MS. J
Occup Health 51:380–385
55. Taylor V, Goodale B, Raab A, Schwerdtle T, Reimer K, Conklin S, Karagas MR, Francesconi KA (2017)
Human exposure to organic arsenic species from seafood. Sci Total Environ 580:266–282
56. Tseng WP (1977) Effects and dose-response relationships of skin cancer and blackfoot disease with
arsenic. Environ Health Perspect 19:109–119
57. Tucker KL (2007) Assessment of usual dietary intake in population studies of gene-diet interaction. Nutr
Metab Cardiovasc Dis 17:74–81
Page 22/2458. Vahter M, Concha G, Nermell B (2000) Factors influencing arsenic methylation in humans. J Trace Elem
Exp Med 13:173–184
59. Venugopal V, Gopakumar K (2017) Shellfish: nutritive value, health benefits, and consumer safety.
Compr Rev Food Sci Food Saf 16:1219–1242
60. Wei Y, Zhu J, Nguyen A (2014) Rice consumption and urinary concentrations of arsenic in US adults. Int
J Environ Health Res 24:459–470
61. Wen W, Wen J, Lu L, Liu H, Yang J, Cheng H, Che W, Li L, Zhang G (2011) Metabolites of arsenic and
increased DNA damage of p53 gene in arsenic plant workers. Toxicol Appl Pharmacol 254:41–47
62. Wolle MM, Conklin SD (2018) Speciation analysis of arsenic in seafood and seaweed: Part I-evaluation
and optimization of methods. Anal Bioanal Chem 410:5675–5687
63. Yaribeygi H, Maleki M, Sathyapalan T, Sahebkar A (2019) The effect of c-peptide on diabetic
nephropathy: A review of molecular mechanisms. Life Sci 237:116950
Figures
Figure 1
Distribution of urinary concentrations of various arsenic species according to age in Korean adults
Page 23/24Figure 2
The relative proportions of TmetAs and AsB in relation to TsumAs (A), and the relative proportions of InAs
and their metabolites (MMA and DMA) in relation to TmetAs (B). InAs: inorganic As [As(III)+As(V)], MMA:
monomethylarsonic acid, DMA: dimethylarsinic acid, AsB: arsenobetaine, TmetAs (sum of inorganic arsenic
and their metabolites): InAs+MMA+DMA, TsumAs (total sum of arsenic measured): InAs+MMA+DMA+AsB
Page 24/24You can also read