Extreme weather events in early summer 2018 connected by a recurrent hemispheric wave-7 pattern - QualEnergia
←
→
Page content transcription
If your browser does not render page correctly, please read the page content below
Environmental Research Letters

LETTER • OPEN ACCESS

Extreme weather events in early summer 2018 connected by a recurrent
hemispheric wave-7 pattern
To cite this article: Kai Kornhuber et al 2019 Environ. Res. Lett. 14 054002

View the article online for updates and enhancements.

                                This content was downloaded from IP address 2.34.21.115 on 13/05/2019 at 14:26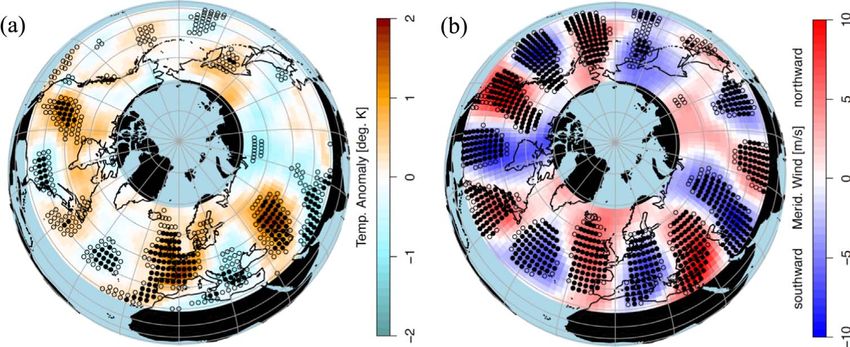
Environ. Res. Lett. 14 (2019) 054002                                                       https://doi.org/10.1088/1748-9326/ab13bf

                              LETTER

                              Extreme weather events in early summer 2018 connected by a
OPEN ACCESS
                              recurrent hemispheric wave-7 pattern
RECEIVED
18 January 2019
                              Kai Kornhuber1,2 , Scott Osprey1,2, Dim Coumou3,4, Stefan Petri3 , Vladimir Petoukhov3,
REVISED
25 March 2019
                              Stefan Rahmstorf3 and Lesley Gray1,2
                              1
                                  Atmospheric, Oceanic and Planetary Physics, University of Oxford, Oxford, United Kingdom
ACCEPTED FOR PUBLICATION      2
27 March 2019                     National Centre for Atmospheric Science, United Kingdom
                              3
                                  Earth System Analysis, Potsdam Institute for Climate Impact Research, Member of the Leibniz Association, Potsdam, Germany
PUBLISHED                     4
26 April 2019
                                  Institute for Environmental Studies, Vrije Universiteit Amsterdam, Amsterdam, The Netherlands
                              E-mail: kai.kornhuber@physics.ox.ac.uk
Original content from this    Keywords: extreme weather, Rossby waves, teleconnections, heat waves, atmosphere dynamics
work may be used under
the terms of the Creative     Supplementary material for this article is available online
Commons Attribution 3.0
licence.
Any further distribution of
this work must maintain       Abstract
attribution to the
author(s) and the title of    The summer of 2018 witnessed a number of extreme weather events such as heatwaves in North
the work, journal citation
and DOI.
                              America, Western Europe and the Caspian Sea region, and rainfall extremes in South-East Europe and
                              Japan that occurred near-simultaneously. Here we show that some of these extremes were connected
                              by an amplified hemisphere-wide wavenumber 7 circulation pattern. We show that this pattern
                              constitutes an important teleconnection in Northern Hemisphere summer associated with prolonged
                              and above-normal temperatures in North America, Western Europe and the Caspian Sea region. This
                              pattern was also observed during the European heatwaves of 2003, 2006 and 2015 among others. We
                              show that the occurrence of this wave 7 pattern has increased over recent decades.

                              1. Introduction                                                       atmospheric circulation, especially at mid-latitudes.
                                                                                                    Large-scale weather systems typically move eastward,
                              Extreme weather events such as heatwaves and floods                    but when the Jetstream strongly meanders this trans-
                              are harmful to society and can lead to increased                      port can come to a halt [9]. Meanders in the jet are
                              mortality, crop losses, and damage to infrastructure                  referred to as Rossby- or planetary waves and previous
                              and economy [1–3]. The European heatwave of                           studies have pointed out that slow moving amplified
                              summer 2003 is considered one of the most severe                      Rossby waves favor the occurrence of extreme weather
                              natural disasters in recent European history, with the                conditions at mid-latitudes [10–12]. Such quasi-sta-
                              number of excess deaths reaching tens of thousands                    tionary Rossby waves can form (fully or nearly) cir-
                              and sizable losses to agricultural production across                  cum-global teleconnections leading to the co-
                              Europe [1]. The persistent Moscow heatwave in July—                   occurrence of unusual weather across the mid-lati-
                              August 2010 led to 55 000 casualties and 30% crop-                    tudes [13–18]. Moreover, the extreme heatwaves of
                              yield losses in Russia, whilst the Indus-River flood in                2003, 2010 and 2015 have been linked to high ampl-
                              Pakistan destroyed infrastructure and affected mil-                   itude Rossby waves. These heatwaves coincided with
                              lions of people [4, 5]. More recently, the record                     weather extremes occurring in other regions of the
                              breaking heatwave of summer 2015 caused widespread                    Northern Hemisphere (NH) [12].
                              water shortages, agricultural damages and wildfires                        Early summer 2018 witnessed several record-
                              throughout Europe [6].                                                breaking and persistent heat and rainfall extremes
                                  While frequency and intensity of heat waves and                   occurring near simultaneously in the NH mid-lati-
                              heavy rainfall events are expected to increase in a                   tudes [19–21]. These extremes include all-time temp-
                              warming world due to thermodynamic arguments                          erature records measured in North America (e.g. Los
                              [7, 8], the exact location and duration of these events               Angeles and Montreal), in Western Europe (e.g. Glas-
                              are more uncertain and largely controlled by the                      gow, Belfast), the Caucasus (Tblisi, Yerevan) and

                              © 2019 The Author(s). Published by IOP Publishing Ltd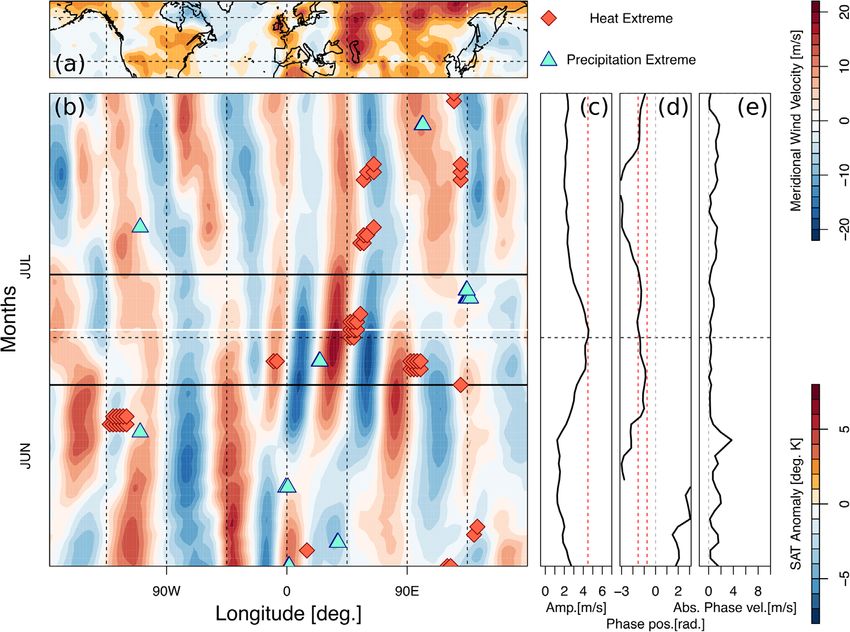
Environ. Res. Lett. 14 (2019) 054002
Siberia as well as heavy rainfall in the Balkans and over that encircled the NH in a regular pattern (figure 1(b)).
Japan during two weeks in late June and early July. The circulation regime of summer 2018 was remark-
Here we analyze the role of the atmospheric circu- able, not only in terms of the amplitude and regularity
lation in setting favorable locations of extreme of the wave-pattern but also due to its persistence,
weather events in early Summer 2018 and show that lasting for about two weeks from late-June to
they were part of a recurrent wave-7 pattern [18]. This early-July.
wave-7 pattern is shown to constitute a recurrent tele- Figure 2(b) shows the onset and persistence of the
connection in NH summer associated with persistent wave pattern as a Hovmöller plot (longitude versus
and above-normal temperatures in North America, time) of the meridional winds averaged over the mid-
Western Europe and the Caspian Sea region. We pro- latitudes (37.5°N–57.5°N, with the timing and long-
vide evidence that this pattern was also active during itude of persistent extreme weather events super-
past episodes of extreme weather events, including the imposed. Here, persistent heat extremes shown in
extreme summer heatwaves of 2003, 2006 and 2015 figure 2(b) are defined using the 0.995 percentile
among others [12, 22, 23]. Furthermore, we show that threshold determined per grid-point based on detren-
the identified pattern has increased in frequency and ded daily temperature anomalies (June–July
persistence over recent decades. 1979–2018, also see sensitivity analysis figure S11,
available online: stacks.iop.org/ERL/14/054002/
mmedia). Precipitation fields contain many ‘zeros’
2. Data and methods
and thus distributions of daily rain are highly skewed
making thresholds based on percentiles challenging.
Daily wind and temperature data were taken from the
Record statistics are commonly used when analyzing
archives of the National Oceanic and Atmospheric
precipitation extremes [8]. Here we define precipita-
Administration (NOAA, NCEP-NCAR reanalysis
tion extremes as the highest value measured at a grid-
[24]). In order to avoid spurious trends due to the
point in June–July 1979–2018. Only events that were
introduction of satellite-measurements in the late
persistent in time (i.e. meeting the extreme weather
seventies, we limited the analysis to years 1979–2018.
conditions for t 2 d) in the mid-latitude (heat: 37.5°
Wind fields and surface temperature anomaly fields
N–57.5°N, rain: 35.25°N–57.75°N) land-areas were
are of a 2.5°×2.5° lat./lon. resolution and precipita-
considered.
tion fields are 0.5°×0.5° resolution.
In general, the westerly circulation is baroclinic,
Phase velocities shown in figure 2(e) were deter-
meaning that there is a displacement between the cir-
mined using a fourth-order accurate numerical
culation at upper and lower pressure levels. However,
approximation of the transient derivative of phase
during episodes of amplified Rossby waves the atmo-
based on daily data, following Coumou et al 2014 [3].
spheric circulation can be considered as near-baro-
In a second step 15 d running mean values of these
tropic, thus circulation patterns are vertically aligned
daily phase velocities are calculated. Spectral decom-
[9] (also see figure S13). In such a situation, the long-
position of meridional wind at 300 mb to determine
itudinal position of southward and northward mer-
phase and amplitude of Rossby-waves was done using
idional winds in figure 2(b) can be understood as
a fast Fourier transformation applied on the mid-lati-
alternating troughs (southward followed by north-
tude band averaged over 37.5° N–57.5° N [9]. The sur-
ward wind) and ridges (northward followed by south-
face temperature composite anomaly field (figure 4(a))
ward wind) that relate to local cyclonic and anti-
was compiled using weekly temperature anomaly
cyclonic circulation, respectively.
fields based on grid-point-wise detrended daily sur-
Consistent with this circulation, heat extremes
face temperature fields. Statistical significance was
(red diamonds in figure 2(b)) are generally located
assessed by comparing high amplitude events (>1.5σ,
below a ridge, associated with anticyclonic conditions.
where σ refers to standard deviation above mean) with
In contrast, precipitation extremes (blue triangles) are
the mean of all remaining weeks using a two sided
generally below a trough, i.e. cyclonic conditions.
t-test and an adjusted p-value determined by false dis-
While two thirds of the detected extremes are con-
covery rate testing [25].
sistent with this description, there are some excep-
tions. Events not consistent with this behavior include
3. Results heat extremes over the North American west coast
(∼125°W) during June and over East Asia (∼135°E in
At the end of June, early July 2018 temperatures were early June and the precipitation extremes over central
anomalously high in specific regions of the NH, North America mid-July (∼120°W) and central Asia
namely the West-Coast of the US, Eastern Canada, (∼125°E) end of July. Relatively low meridional wind
western Europe including Scandinavia, the Central speeds in these regions suggest that these events might
Asian regions around and to the North of the Caspian not be directly linked to the large-scale circulation
Sea and Siberia (figures 1(a) and 2(a)). Over the same (figure S6(a)).
time the mid-latitudinal upper tropospheric circula- The mid-latitude circulation can be quantified in
tion was characterized by a strongly meandering jet terms of Rossby waves by decomposing it into its
2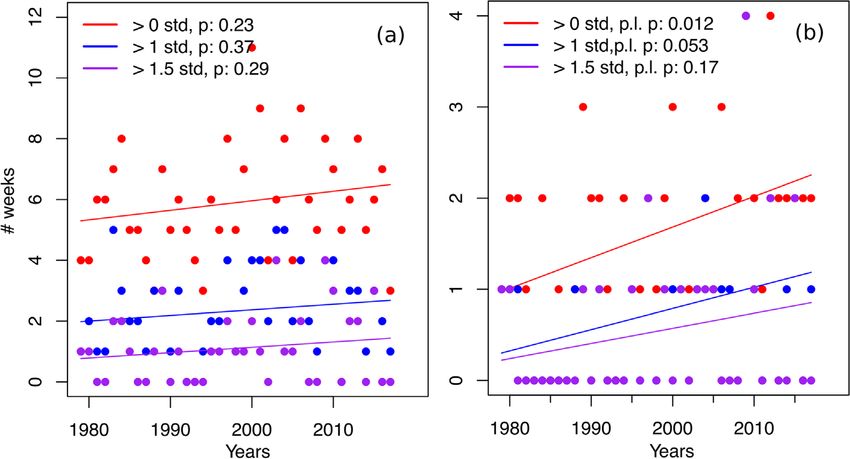
Environ. Res. Lett. 14 (2019) 054002

   Figure 1. Northern Hemisphere temperature anomalies and stationary Rossby wave pattern in early July 2018. (a) Surface temperature
   anomalies (from 1981 to 2010 climatology; 15 d mean, centered on 1 July 2018). (b) As (a) but for meridional wind V (m s−1) in the
   upper troposphere (300 mb). Dashed lines indicate the longitudes and latitudes grid at 30° separation.

   Figure 2. Time evolution of persistent wave-7 circulation pattern. (a) NH surface air temperatures (15 d mean centered on 1st July
   2018). (b) Hovmöller (longitude-time) time evolution of the mid-latitude (averaged over 37.5°N–57.5°N) 300 mb meridional winds.
   A stationary wave-7 pattern evolves during mid-June. The location and timing of persistent extreme events are marked by orange
   diamonds (heat extreme) and blue triangles (precipitation extreme). 1 July is marked by a horizontal white line, while the 15 d mean
   period is marked by horizontal black lines. The horizontal dashed lines mark the last day of June, while the vertical dashed lines
   separate the longitudes at 45° steps. (c) The amplitude of wave 7 increases and exceeds the 1.5σ (red dashed line) end of June/early July
   when heat records are broken across the mid-latitudes. (d) Phase of wave-7 (radians). The phase becomes locked within its preferred
   position (marked by red dashed lines) by end of June. (e) Phase speed of wave 7 (m s−1). The phase speed slows down in concert with
   the increasing amplitude and the phase locking of wave-7.

principal wave components using a Fourier transfor-                      amplitude (figures 2(b), (c), S3(c)), near-stationary
mation [10, 26]. Starting at the end of June, a quasi-                   phase position (figure 2(d)) and near-zero phase speed
stationary wavenumber 7 (wave-7 from hereon)                             (figure 2(e)). Although early Summer 2018 saw several
Rossby wave evolves (figures S3(a), (b)) to large                         persistent heat and rainfall extremes, simultaneous

                                                          3
Environ. Res. Lett. 14 (2019) 054002
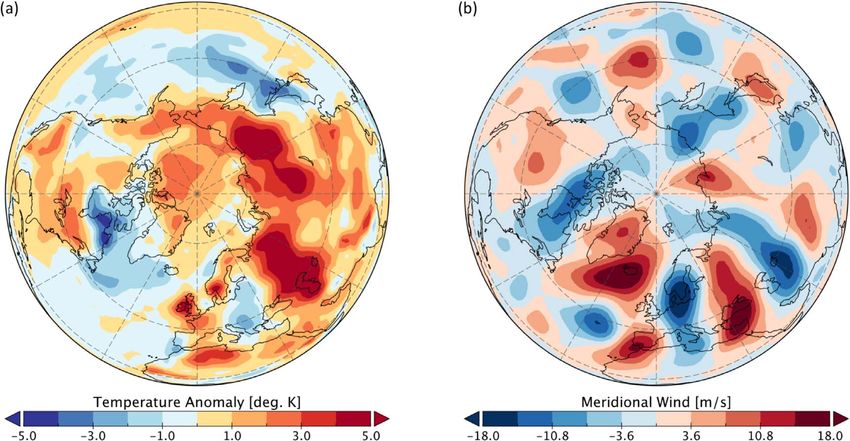
Figure 3. Composite plots of wave-7 events: a recurrent teleconnection. (a) Composite plot of surface temperature anomalies over the
NH mid-latitudes (30°N–67.5°N) during weeks of high wave-7 amplitudes (>1.5σ, N: 43 weeks, see table S1) in summer (JJA) over
the NH mid-latitudes (30°N–67.5°N) observed over the period 1979–2017. (b) 300 mb meridional wind speeds (northward: red;
southward: blue) during those events. The filled stippling in (a) and (b) indicates grid-cells with significant deviations from JJA
climatology using a significance test that accounts for the false discovery rate (FDR) associated with multiple testing [25], while the
grid-points marked with hollow stippling indicate local significance.
extremes in the mid latitudes occurred mostly during central North America, Western/Central Europe and
the period of amplified wave-7, specifically over the the Caspian Sea region (figure 3(a)). Here, high ampl-
Eurasian continent (figure 2(b)). Those include the itude wave-7 events are defined by weeks in JJA where
heat extremes over the British Isles, the rainfall the amplitude exceeds the +1.5σ threshold (the pat-
extreme over SE Europe, the heat extreme over the tern however is independent of the exact choice of
Caspian Sea region and the heat extremes over Siberia threshold; see figure S5). In the regions identified
[19–21]. The precipitation extreme over Japan also above, anomalous circulation arising from the wave-7
occurring within this period was linked to an ex-tropi- circumglobal teleconnection can then intensify the
cal storm but was likely influenced by the large-scale normal summer temperatures, contributing to heat
circulation (see SI for details). waves on weekly to monthly time scales.
Wave-7 shows some unique behavior: it exhibits a To quantify the similarity of the wave-7 pattern
persistent and preferred phase position when its ampl- (figure 3(b)) with the mid-latitude meridional wind in
itude increases [18] (also see figure S4), creating a cir- 2018, we compute their hemispheric spatial correla-
cumglobal teleconnection pattern in NH summer tion in the midlatitudes (57.5–37.5°N) also including
(figures 3(a), (b)). This is consistent with the work separate sectors (Eastern hemisphere: 30 W–150E,
from Branstator et al [27] and Ding and Wang [16] Western hemisphere: 150°E-30°W) (figure S2). Dur-
who showed that zonally elongated zonal winds (see ing the phase-locked period (end of June, early July),
figure S9, S10) can act as waveguides for Rossby waves the spatial correlations ρ peak above a level of 0.4, (sta-
leading to co-variability in far-away regions [28]. The tistically significant at the 99% confidence level) and
amplitude starts to increase from mid-June, exceeding remain over a threshold above 1.5 σ (figure S2(c)).
the 1.5 standard deviation threshold by the end of June Analysis of the separate sectors reveals that this is
(figure 2(c)) and persists at that high level until early mainly due to the very high agreement over the eastern
July. Concurrent with the rising amplitude, the wave hemisphere (30 W–150E, ρ>0.8), although the wes-
shifts into its preferred phase-position (indicated by tern hemisphere nearly exceeds the 1.5σ threshold as
the dashed red lines in figure 2(d), also see figure S4) well. In agreement with summer 2018, notable past
where it persists for almost three weeks. The absolute amplitude wave-7 events coincide with heat extremes
phase speed of wave-7 thus slows down reaching in central Western Europe and the Caspian Sea region
almost zero when the wave enters its preferred phase as suggested by the surface temperature anomaly map
position (figure 2(e)). (figure 3(a)), among them the heatwaves of 2003,
The occurrence of this specific circulation pattern 2006, 2012 and 2015 [12, 18] (also see figure S6,
was not unique to June/July 2018. The hemispheric table S1).
circulation associated with amplified wave-7 is a Over recent decades the number of phase-locked
recurrent pattern observed in other years. As a con- wave-7 events (here defined as weeks with above aver-
sequence of its preferred phase, it exhibits spatially age wave-7 amplitude within its preferred position, see
confined troughs and ridges which then persist over figure S4) have increased significantly (95% con-
specific regions (figure 3) [18, 29]. A characteristic cir- fidence interval, figure 4(b)). Prior to 1999 there were
cumglobal pattern of alternating temperature anoma- no summers with two or more consecutive weeks of a
lies thus arises across the mid-latitudinal belt with wave 7 phase-locked circulation, but since then these
significantly elevated surface temperatures over have occurred (table S2). Thus, the persistence of such
4Environ. Res. Lett. 14 (2019) 054002
Figure 4. Recent trends in the occurrence of the wave-7 teleconnection. (a) Number of weeks per summer season (JJA, 1979–2017)
with wave-7 amplitude above average (>0σ), 1σ and 1.5σ irrespective of phase position. (b) Number of weeks per summer season
(JJA) where wave-7 is in its preferred phase position (see figure S4) and the amplitude of wave-7 is above average (>0σ), >1 σ and
>1.5σ.
situations appears to have increased. In fact, the aver- Circulation [33] and implicated in past European heat
age duration has doubled from about one to two weeks extremes [23] but this needs further investigation.
per year, while the number of years with more than
two events per summer shows an almost eight-fold
4. Discussion
increase (figure S7). Although the trends are always
upward, i.e. independent of the amplitude threshold
Extreme weather events such as the heatwaves
used, their significance is sensitive to the amplitude
observed in summer 2018 are generally the product of
threshold due to the reduction in ensemble size for
several compounding factors acting together. For
high amplitudes (figure 4(b)). The number of wave-7
example it has been shown that the extreme heatwaves
events (i.e. weeks with a high-amplitude wave-7 irre- in Europe (2003) and Russia (2010) were preceded by
spective of its phase position) do not show statistically very low soil moisture content due to an anomalously
significant upward trends for different thresholds used dry spring season [22, 34, 35]. Similarly, during April–
(figure 4(a)). A statistically significant upward trend in May 2018, soil moisture feedbacks may also have
the observed amplitude of summertime wave-7 is only contributed to the magnitude and persistence of the
detected when data from the pre-satellite period is observed heatwaves [34]. Generally, heat waves are
included (figure S8). The more pronounced trends in becoming more intense as the mean climate warms
phase-locked events (figure 4(b)), compared to high- due to increasing greenhouse gas (GHG) concentra-
amplitude events (figure 4(a)) suggests that it is the tions [7]. GHG warming also leads to enhanced water-
phase-locking itself that has increased. In general, holding capacity of the air (Clausius–Clapeyron),
these trends can simply reflect multi-decadal varia- fueling heavier rainfall events [8]. For these thermo-
bility in the Earth system given that the satellite record dynamic reasons, it is thus likely that the observed
is relatively short. Nevertheless, an enhanced land- extremes in 2018 have in part been fueled by the global
ocean temperature contrast as a consequence of warming trend. However the timing, duration and
amplified land warming provides a physical mech- location of a specific extreme weather event, can be
anism for such waves to become preferentially phase- largely controlled by the large scale circulation,
locked. Such temperature contrast creates an especially at mid-latitudes [36].
increased zonal temperature gradient at the coastlines While the direct response of weather extremes to
and provide a stationary vorticity source that triggers thermodynamic drivers is generally well understood,
and maintains atmospheric waves [30, 31]. It is there- large uncertainty remains of the indirect response
fore possible that the relative position of land and from the changing atmospheric circulation under a
ocean areas in the mid-latitudes with high values of warmer climate [36–40]. Dynamical changes in the
dT/dx over the continental West-coasts could favor a circulation have been proposed to explain the increase
hemispheric wave 7 pattern [32]. Such contrast would in persistence and magnitude of recent summer
further be enhanced by the cooling trend of northern extremes that are otherwise unaccounted for using
Atlantic sea surface temperatures linked to a slow- simple thermodynamic arguments [40, 41]. These
down of the Atlantic Meridional Overturning arguments are particularly relevant in the case of
5Environ. Res. Lett. 14 (2019) 054002
Western and Central Europe as well as the Southern required to fully understand the combination of
Central US being repeatedly struck by devastating factors that trigger these observed wave events, and
heatwaves [22, 42–45]. Summer storm tracks have what determines their preferred phase position, so that
been weakening over recent decades [46] which likely predictability of future extreme events can be
influences Rossby wave behavior. In boreal summer improved.
the amplitude of synoptic Rossby waves (waves 5 and
higher) have indeed been increasing recently, in agree- Acknowledgments
ment with our results [47]. However, other studies
have shown that upward trends over a relatively short The federal state of Brandenburg is acknowledged for
period are difficult to assess [48] and traditional block- supporting the used high-performance computing
ing indices also show no changes in summer [49]. resources.
The regions for which an increase in the persis-
tence of regional weather regimes was identified (Eur-
ope and Western Asia) match those related to the Funding
wave-7 teleconnection pattern [50]. Planetary wave
resonance has been discussed as a potential mech- This work was supported by the UK Natural Environ-
anism to generate high amplitude synoptic wave pat- ment Research Council (NERC) National Centre for
terns in boreal summer [9, 12, 18] and necessary Atmospheric Science (NCAS) and NERC grants NE/
conditions were present in June-July 2018 as well (also P006779/1 and NE/N018001/1 (KK, LG and SO) and
see discussion on planetary wave resonance in SI). by the German Federal Ministry of Education and
Recent trends in the zonal-mean temperature profile Research (BMBF Grant: 01LN1304A)) and by the
due to anthropogenic climate change might favor Netherlands Organisation for Scientific Research
resonance conditions [32]. This temperature profile is (NWO Grant: 016.Vidi.171011) (DC).
characterized by enhanced land warming over high
latitudes favouring the formation of an Arctic front jet, Author contributions
and subsequent double jet in the zonal mean [12, 32].
In fact, for 2018 such Arctic front jet is clearly visible KK, SO, DC, LG conceptualized the paper. KK under-
over the Eurasian continent (figure S10), which might took the analysis. All authors contributed to the
be the reason that Rossby wave patterns were specifi- writing of the paper.
cally amplified and persistent.
Competing interests
5. Conclusion
The authors declare no competing interests.
In summary, we have shown that the summer 2018
featured a series of nearly simultaneous extreme Data and materials availability
weather events that coincided in time and space with a
circumglobal teleconnection constituted by an ampli- The data used in this study can be obtained from
fied Rossby wave (wave-7) in the mid-latitude jet NCEP-NCAR websites or via the UK Centre for
stream specifically over Eurasia. These extremes Environmental Data Analysis (CEDA).
include the heat-records of June/July broken in
Western Europe and Caspian Sea region, as well as the
extreme and devastating rainfall events in South-East ORCID iDs
Europe. Tropical ENSO variability in 2018 was in a
neutral state and thus unlikely to be an important Kai Kornhuber https://orcid.org/0000-0001-
factor behind the extreme weather events in the NH. 5466-2059
The identified recurrent wave-7 circulation pattern Stefan Petri https://orcid.org/0000-0002-
conducive for heat waves acts in addition to the 4379-4643
thermodynamically driven increase in heat, creating
possibilities for very-extreme heat waves, specifically References
in the identified regions: Western Europe, North
[1] Mitchell D et al 2016 Attributing human mortality during
America and Caspian Sea region. We show that this extreme heat waves to anthropogenic climate change Environ.
circumglobal teleconnection pattern has increased in Res. Lett. 11 74006
frequency and persistence in recent years. Given the [2] Lesk C, Rowhani P and Ramankutty N 2016 Influence of
high impacts of these extremes in terms of mortality, extreme weather disasters on global crop production Nature
529 84–7
morbidity and agricultural losses, this presents major [3] Wenz L and Levermann A 2016 Enhanced economic
risks for society and global food production in connectivity to foster heat-stress-related losses Sci. Adv. 2
particular, since the main breadbasket regions are e1501026
located in the mid-latitudes. Further research is
6Environ. Res. Lett. 14 (2019) 054002
[4] Coumou D and Rahmstorf S 2012 A decade of weather [27] Branstator G 2002 Circumglobal teleconnections, the jet
extremes Nat. Clim. Change 2 1–6 stream waveguide, and the North Atlantic Oscillation J. Clim.
[5] Russo S et al 2014 Magnitude of extreme heat waves in present 15 1893–910
climate and their projection in a warming world J. Geophys. [28] Branstator G and Teng H 2017 Tropospheric waveguide
Res.: Atmos 119 500–12 teleconnections and their seasonality J. Atmos. Sci. 74 1513–32
[6] NOAA 2016 State of the Climate: Global Climate Report for 2015 [29] Zhang J, Yuanchun J, Haishan C and Zhiwei W 2017 Double-
(https://ncdc.noaa.gov/sotc/global/201513)NOAA National mode adjustment of Tibetan Plateau heating to the summer
Centers for Environmental Information circumglobal teleconnection in the Northern Hemisphere Int.
[7] Coumou D and Robinson A 2013 Historic and future increase J. Climatol. 38 663–76
in the global land area affected by monthly heat extremes [30] Shaw T A and Voigt A 2015 Tug of war on summertime
Environ. Res. Lett. 8 034018 circulation between radiative forcing and sea surface warming
[8] Lehmann J, Coumou D and Frieler K 2015 Increased record- Nat. Geosci. 8 560–6
breaking precipitation events under global warming Clim. [31] Hoskins B J and Karoly D J 1981 The steady linear response of a
Change 132 501–15 spherical atmosphere to thermal and orographic forcing
[9] Petoukhov V, Rahmstorf S, Petri S and Schellnhuber H J 2013 J. Atmos. Sci. 38 1179–96
Quasiresonant amplification of planetary waves and recent [32] Mann M E et al 2017 Influence of anthropogenic climate
Northern Hemisphere weather extremes Proc. Natl Acad. Sci. change on planetary wave resonance and extreme weather
110 5336–41 events Sci. Rep. 7 45242
[10] Screen J A and Simmonds I 2014 Amplified mid-latitude [33] Caesar L, Rahmstorf S, Robinson A and Feulner G 2018
planetary waves favour particular regional weather extremes Observed fingerprint of a weakening Atlantic Ocean
Nat. Clim. Change 4 704–9 overturning circulation Nature 556 191–6
[11] Coumou D, Petoukhov V, Rahmstorf S, Petri S and [34] Fischer E M, Seneviratne S I, Lüthi D and Schär C 2007
Schellnhuber H J 2014 Quasi-resonant circulation regimes and Contribution of land-atmosphere coupling to recent European
hemispheric synchronization of extreme weather in boreal summer heat waves Geophys. Res. Lett. 34 L06707
summer Proc. Natl Acad. Sci. 111 12331–6 [35] Miralles D G, Teuling A J, van Heerwaarden C C and
[12] Kornhuber K, Petoukhov V, Petri S, Rahmstorf S and Vilà-Guerau de Arellano J 2014 Mega-heatwave temperatures
Coumou D 2017 Evidence for wave resonance as a key due to combined soil desiccation and atmospheric heat
mechanism for generating high-amplitude quasi-stationary accumulation Nat. Geosci. 7 345–9
waves in boreal summer Clim. Dyn. 49 1961–79 [36] Shepherd T G 2014 Atmospheric circulation as a source of
[13] Deng K, Yang S, Ting M, Lin A and Wang Z 2018 An intensified uncertainty in climate change projections Nat. Geosci. 7 703–8
mode of variability modulating the summer heat waves in [37] Cohen J et al 2014 Recent Arctic amplification and extreme
Eastern Europe and Northern China Geophys. Res. Let. 45 mid-latitude weather Nat. Geosci. 7 627–37
361–9 [38] Barnes E A and Screen J A 2015 The impact of Arctic warming
[14] Lau W K M and Kim K-M 2012 The 2010 Pakistan Flood and on the midlatitude jet-stream: Can it? Has it? Will it? WIREs
Russian heat wave: teleconnection of hydrometeorological Clim. Change 6 277–86
extremes J. Hydrometeorol. 13 392–403 [39] Hoskins B and Woollings T 2015 Persistent extratropical
[15] Saeed S, Van Lipzig N, Müller W A, Saeed F and Zanchettin D regimes and climate extremes Curr. Clim. Change Rep. 1
2014 Influence of the circumglobal wave-train on European 115–24
summer precipitation Clim. Dyn. 43 503–15 [40] Horton R M, Mankin J S, Lesk C, Coffel E and Raymond C
[16] Ding Q and Wang B 2005 Circumglobal teleconnection in the 2016 A review of recent advances in research on extreme heat
Northern Hemisphere summer J. Clim. 18 3483–505 events Curr. Clim. Change Rep. 2 242–59
[17] Teng H, Branstator G, Wang H, Meehl G A and [41] Luterbacher J et al 2004 European seasonal and annual
Washington W M 2013 Probability of US heat waves affected temperature variability, trends, and extremes since 1500
by a subseasonal planetary wave pattern Nat. Geosci. 6 1056–61 Science 303 1499–503
[18] Kornhuber K et al 2017 Summertime planetary wave- [42] Hoy A, Hänsel S, Skalak P, Ustrnul Z and Bochníček O 2016
resonance in the Northern and Southern Hemisphere J. Clim. The extreme European summer of 2015 in a long-term
30 6133–50 perspective Int. J. Climatol. 37 943–62
[19] NOAA 2018 State of the Climate: Global Climate Report for July [43] Rebetez M, Dupont O and Giroud M 2009 An analysis of the
2018 (https://ncdc.noaa.gov/sotc/global/201807)NOAA July 2006 heatwave extent in Europe compared to the record
National Centers for Environmental Information year of 2003 Theor. Appl. Climatol. 95 1–7
[20] NOAA 2018 State of the Climate: Global Climate Report for June [44] Hoerling M, Eischeid J K, Quan X and Xu T 2007 Explaining
2018 (https:/ncdc.noaa.gov/sotc/global/201806)NOAA the record US warmth of 2006 Geophys. Res. Lett. 34 1–4
National Centers for Environmental Information [45] Diffenbaugh N S and Scherer M 2013 Likelihood of July 2012
[21] 2018 Flash floods in Europe - Information bulletin no. 1 US temperatures in preindustrial and current forcing regimes
International Federation of Red Cross and Red Crescent Bull. Am. Meteorol. Soc. 94 6–9
Societies (https://reliefweb.int/report/world/flash-floods- [46] Coumou D, Lehmann J and Beckmann J 2015 The weakening
europe-information-bulletin-no-1) summer circulation in the Northern Hemisphere mid-
[22] Black E, Blackburn M, Harrison G, Hoskins B and Methven J latitudes Science 348 324–7
2004 Factors contributing to the summer 2003 European [47] Wang S-Y, Davies R E and Gillies R R 2013 Identification of
heatwave Weather 59 217–23 extreme precipitation threat across midlatitude regions based
[23] Duchez A et al 2016 Drivers of exceptionally cold North on short-wave circulations J. Geophys. Res. Atmos. 118
Atlantic Ocean temperatures and their link to the 2015 11059–74
European heat wave Environ. Res. Lett. 11 074004 [48] Screen J A and Simmonds I 2013 Exploring links between
[24] Kalnay et al 1996 The NCEP/NCAR 40-year reanalysis project Arctic amplification and mid-latitude weather Geophys. Res.
Bull. Am. Meteorol. Soc. 77 437–70 Lett. 40 959–64
[25] Wilks D 2016 The stippling shows statistically significant grid [49] Woollings T et al 2018 Blocking and its response to climate
points Bull. Am. Meteorol. Soc. 97 2263–74 change Curr. Clim. Change Rep. 4 287–300
[26] Coumou D, Kornhuber K, Lehmann J and Petoukhov V 2017 [50] Horton D E et al 2015 Contribution of changes in atmospheric
Weakened flow, persistent circulation, and prolonged weather circulation patterns to extreme temperature trends Nature 522
extremes in boreal summer Climate Extremes: Patterns and 465–9
Mechanisms (Geophysical Monograph Series) ed S-Y S Wang
et al 1st edn (New York: Wiley) pp 61–73
7You can also read