F2021 Australian Affordable Housing Report - STANDARD HOUSE ENVIRONMENTAL SCAN Australian Affordable Housing Report F2021
←
→
Page content transcription
If your browser does not render page correctly, please read the page content below
COVID-19
                                     RESPONSE
                                      EDITION

                 F2021
    Australian Affordable
         Housing Report
STANDARD HOUSE ENVIRONMENTAL SCAN
           Australian Affordable Housing Report F2021   1
Contents
                                                              01 Introduction................................................................................................................3

                                                              02 Executive Summary...................................................................................................5

                                                              03 Section A – The need and market for housing.....................................................8

                                                              04 Section B – The Impacts of a Standard House................................................. 29
                                                                                         Construction..................................................................................... 30
                                                                                         Manufacturing Jobs and Housing Innovations............................. 33
                                                                                         Retail Impacts................................................................................... 36

                                                              05 Section C – Housing’s renewed role in building resilient .................................. 39
                                                                             Australian Communities

                                                              06 Appendix One......................................................................................................... 51

                                                              07 Appendix Two......................................................................................................... 54

                                                              Foreword
                                                              “The concept of the standard house project was developed out of engagement between PowerHousing
COVER IMAGE: Byfield, Standard House Design - Simonds Homes

                                                              Australia, Simonds Homes and Community Sector Banking to determine what the impact would be on the
                                                              residential construction workforce as Australia’s record home building run wound back from 2018. CoreLogic
                                                              has analysed the first three months of Australia’s economic response to the COVID-19 pandemic with respect
                                                              to housing data: this is vital to setting a baseline that helps form an understanding of what will happen next.
                                                              Analysing the forecasts of the next year and recognising the importance of the residential construction
                                                              workforce in terms of jobs is important, but the value of housing to our communities in this time cannot be
                                                              understated as an output of this project. As the Standard three bedroom House analysis shows, we see 43
                                                              trades and subtrades gain employment when a stand-alone home is built. Our three organisations - one of the
                                                              nation’s largest residential builders, a supporting lender to the CHP sector and a CHP peak body - all recognise
                                                              the importance of this to our social and economic resilience as a country. This document really speaks to
                                                              people’s livelihoods today and considers the homes needed for the lives of generations to come long after we
                                                              have beaten this crisis.”

                                                              Kelvin Ryan – CEO, Simonds Homes
                                                              Andrew Cairns – CEO, Community Sector Banking (Bendigo Bank)
                                                              Nicholas Proud – CEO, PowerHousing Australia
HousingFirst

                                                                                                   Beyond Housing (VIC)

01                    Introduction

There are 25 million people in Australia living in       in the COVID-19 environment. A home has emerged
over ten million homes: as renters; owner-occupiers      as the first principle of stability if individuals (and,
with mortgages; and mortgage-free home-owners.           therefore, communities) are to be resilient in the face
Amongst these, there are 2.1 million people who          of ongoing economic and social challenges.
own a rental property, which provides a home for
                                                         Housing is a necessity good – it provides one of the
others. During the COVID-19 crisis, most Australians
                                                         fundamental requirements for Australians - shelter.
have been able to retain the security of their housing
                                                         The COVID-19 crisis has highlighted the lack of
situation and have kept a roof over their heads.
                                                         social and affordable housing provision in Australia
The residential property in which an individual or       with uncertainty and pressure mounting for renters,
household lives has become more than just a home         investors and owner occupiers.

                                                                    Australian Affordable Housing Report F2021   3
If in 2020 you are a renter living in one of the 2.8      Understanding what will be an uncertain and
million rental properties in Australia the financial      unprecedented change in the housing market,
constraints can be challenging and confronting.           rental conditions, and wage fragmentation is tough
This is particularly the case for casual employees        to pick apart. It is unclear whether the JobKeeper
and the unemployed, a disproportionate amount             allowance, which has been vital in supporting
of whom are renters. It is also a challenge for part      the Australian economy, will continue past the
time and full time workers. There is a big question       end of September 2020. Balancing a new market
mark over whether rent and living costs will be able      equilibrium, with immediate property stimulus, that
to be covered in the immediate future economic            feeds into longer term new build programs is tricky
environment.                                              to get right.
A drop to the lowest interest rates in Australia’s        The HomeBuilder stimulus program is a first cog
history has provided a reprieve for those owner           in the wheel of supporting one of Australia’s most
occupiers (accounting for around three million            crucial industries – residential construction – but
dwellings). Of these, 429,000 families with a loan        also of creating an environment where this industry
have had their mortgages deferred due to COVID-19         can ‘give back’ to the economy in terms of the direct
(totalling $153.5 billioni). Others have had payments     and indirect (multiplier) effects a boost to residential
reduced or held steady for up to six months with an       building has on demand, activity and employment on
extension of up to an additional four months.             the broader economy.
For mortgage-free homeowners, the immediate               Support for the provision of new social housing
challenge with COVID-19 has most likely been the          stock is equally important as any policy aimed at
impact that the volatility of the stock market has had    boosting demand for new private housing stock.
on superannuation, and the weekly income derived          The twin outcomes of economic and social benefit
from that source. The potential to downsize is an         derived from boosting new social housing supply is
option that may provide livable and practical life        not a feature of the HomeBuilder program. However,
choice options, but the decline in property values is     support for new social housing supply is a vital
expected to have a negative impact on the value of        component of any recovery plan for the Australian
any residential property sale for at the least the next   economy.
twelve months.
                                                          Whilst most of the country began easing back
To counter the COVID-19 crisis, the Federal               COVID-19 restrictions, Melbourne went back into
Government allowed for $10,000 of superannuation          lockdown in early July. We see that the long term
to be accessed in each of the 2020 and 2021               economic impacts and full stimulus required is not
financial years for eligible individuals. Long Service    clear, but what creates confidence is to see housing
Leave has been used and holiday accruals depleted         activity locked in. This will be critical to be decided
to retain employment. JobKeeper payments have             upon in the October and May Federal Budgets well
provided financial support for a period to support        before the real depth of the trough in housing activity
living and housing costs.                                 and social impacts in F2021 and F2022 are realised.

4   PowerHousing Australia
City West Housing (NSW)

02                      Executive Summary

Residential home building is a major driver of jobs      This report presents the outlook for Australia’s
and economic activity throughout the Australian          residential housing sector, analyses the implications
economy. A strong and steady pipeline of new             of current forecasts and presents policy options
construction keeps people in jobs and helps prevent      to address the looming challenges this analysis
major price rises that occur when demand outstrips       identifies.
supply, as has recently been the case. But even more
                                                         And those challenges are substantial.
than that, access to housing that is affordable is the
cornerstone of social and economic wellbeing for         An existing downward trend in the supply of new
Australian families.                                     housing has been exacerbated by the COVID-19 crisis.
                                                         Once the tail end of the last home building boom

                                                                    Australian Affordable Housing Report F2021   5
finishes washing through the system, this could lead      jobs lost with the unemployment rate reaching
to a situation where new home supply effectively falls    7.1 per cent, its highest level since 2001, with real
off a cliff, dealing a huge blow to employment and        indicators the rate is actually currently closer to
businesses along the housing supply chain. In the         11 per cent. At 927,600, the number of officially
context of our steeply rising unemployment, this is a     unemployed people has reached its highest level
blow Australia can not afford.                            since December 1993, when the country was in the
                                                          wake of the 1990-91 recession.
As demonstrated in this report, every new home that
is built provides employment for up to 43 trades and      JobKeeper payments for 3.3 million Australians are
sub-trades in construction jobs across Australia’s        costing up to $10 billion per month and if all were
cities, regional and rural areas. It also delivers        unemployed the rate would be in excess of 30 per
a significant boost to manufacturing and retail           cent.ii
demand.
                                                          There are clear buyer demand challenges which
Similarly, National Housing Finance and Investment        will require layers of residential stimulus policy.
Corporation (NHFIC) recently released inaugural           The difference between the COVID-19 crisis in
research report shows that residential construction       2020 and the Global Financial Crisis (GFC) is that
has the second largest economic multiplier of all the     the Australian economy is now in recession and
114 industries that make up the Australian economy.       the unemployment rate will peak at a far higher
                                                          level than that reached during the GFC, while a pre-
Should Australia’s build rate fall from 230,792 homes
                                                          existing issue with underemployment is becoming a
completed in 2008 to only 120,000 in F2021, which is
                                                          much larger problem.
one possible scenario suggested by the most recent
data; this would see the loss of over 4.75 million        Boosting and subsequently stabilising the new
trade type engagements as a result of the shortfall of    housing market beyond the immediate six month
110,000 homes not being built.                            rental policies/JobSeeker/JobKeeper phase of
                                                          recovery is crucial to the Australian economy. Social
This looming trough in new home construction is
                                                          housing can act as a shock absorber to fill the
equivalent to the ‘valley of death’ faced by Australian
                                                          primary gap in Federal and State/Territory funding
manufacturers.
                                                          in late 2020. Post the six month JobKeeper support
Critically, however, our analysis also demonstrates       period, subsidised wage and housing support will be
that it is not too late to intervene and alter this       needed for people if their job is just simply not there
trajectory. Targeted government stimulus that             anymore.
harnesses the potential of affordable housing as an
                                                          A positive note for the overall economy is the
emerging asset class and the proven capabilities
                                                          retention of Australia’s AAA credit rating (one of only
of the social and community housing sector could
                                                          10 countries to do so through the pandemic), which
effectively bridge this gap in the market.
                                                          reflects the stability required to mitigate the crisis.
It is broadly expected that while around 180,000
                                                          While there are a variety of options to support
dwelling completions will be reported for the period
                                                          the health and welfare of Australians through
ending 30 June 2020, residential forecasts of around
                                                          this difficult period, there is more that will need
120,000 commencements for 2020/21 are being
                                                          to be done in housing. Mobilising to drive new
made.
                                                          commencements and support the economy through
Whilst there has been some stability in house and         the Federal Budget, which is less than four months
rental pricing over the first quarter of COVID-19 from    away will be a given.
March to May 2020, there have been over 824,000

6   PowerHousing Australia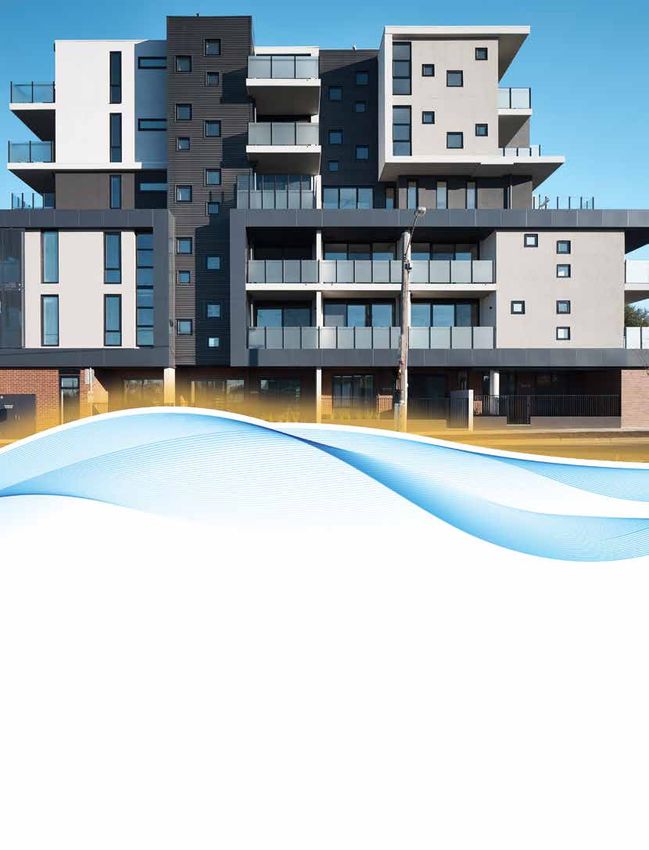
Housing Trust (NSW)

Social housing is a vital component of overall          With elevated annualised ABS Building Approvals still
dwelling investment in an industry that accounts for    coming through, new build activity can be activated
around 5 per cent of GDP. In the last major economic    for shovel ready projects that are today ready to get
downturn, social housing and affordable stimulus        underway, that will flatten the housing supply trough
took up a lot of the slack when the market was          and mobilise the construction and property industry
unable to respond. This meant that the market was       at a time when it has never needed it more.
quick to reactivate the residential activity when new
                                                        In particular, this opens the door for Government
home buyers were not there.
                                                        to incentivise the residential sector through longer
If there are reports for the first half of 2020 of      term tax credits, government subsidies and grant/
elevated stock levels not being sold then social and    equity structures which will assist the throughput
affordable stimulus may support the market if it is     of the rental homes needed today, but also provide
not capable of taking-up of any recently completed      structure for the ongoing delivery of rental homes
residential properties for sale.                        that will be needed as we come out of the crisis in
                                                        F2021-F2022.
Immediate repairs programs that are brought forward
will keep improving the homes of tenants and also
stimulate economic activity and jobs.

                                                                   Australian Affordable Housing Report F2021   7
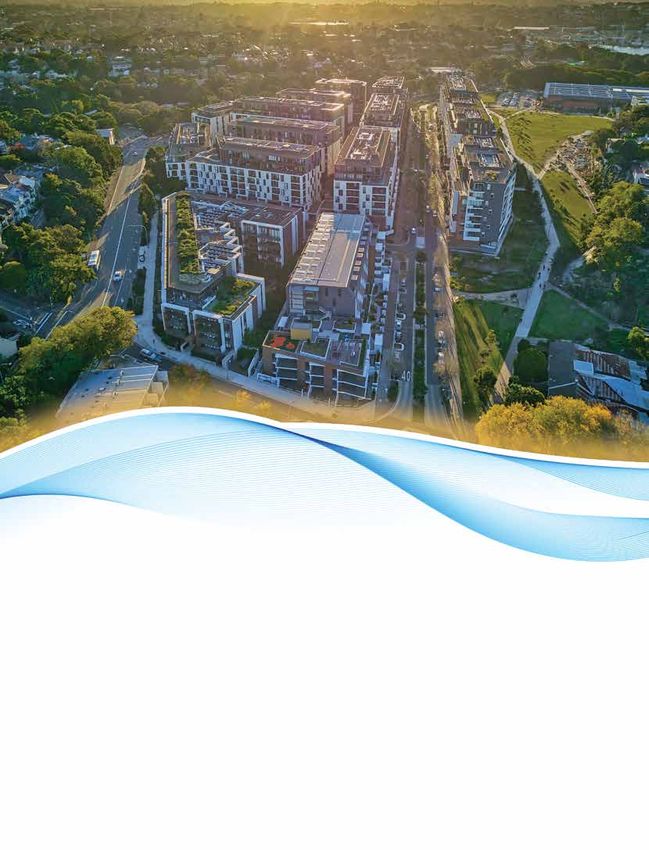
2020 St Kilda Apartment Sod Turn -
HousingFirst (VIC)

         03                          Section A –
                                     The need and market for housing

         In observing first quarter of COVID-19, it is clear the   JobSeeker and JobKeeper has seen arrears drop and
         crisis has unequivocally hammered the Australian          Community Housing Providers seeing exceptional
         economy. Jobs have been lost, forecasts have been         tenant payment behaviour.
         downgraded and expectations are low for economic
                                                                   The wash through of the tail end of the greatest
         recovery over the next two years.
                                                                   housing boom in Australia’s history will take place
         A review of the current market for housing, and           over the next financial period at the same time as
         particularly rentals, is not showing the same distress    elevated completion levels see the keys handed
         with a sense of calm sitting in the market. In social     over to several hundred thousand new home buyers
         housing, the additional support of programs such as       over the next year. But this won’t last. Much will be

         8    PowerHousing Australia
signs that a major downturn in delivery has not yet
                                                           taken hold. This means that an opportunity remains
                                                           to circumvent the forecasts and deliver a different
                                                           housing future for Australia.

                                                           “The housing sector has a pervasive impact on
                                                           the Australian economy. It accounts for the bulk of
                                                           household wealth, and around 6% of employment
                                                           is related to the residential construction sector.
 Southern Cross Housing (NSW)                              The linkages to the rest of the economy through
                                                           consumer spending, manufacturing, and the
made in this report of the fact that, pre-pandemic,        business service sector ensure that housing
Australia was already on its way to its most significant
downturn in housing supply, but the forecasts as
                                                           cycles are very closely related to the broader
presented predict the downturn will be much more           economic cycle in Australia”
severe than anything previously forecasted.
                                                           Felicity Emmett, ANZ Senior Economist,
While forecast new build rates are set to decline
significantly, the picture to date shows positive          June 2020.

A1. COVID Quarter One (Mar-May 2020)
Rental rates                                               On the supply side, anecdotal evidence has emerged
                                                           of a transition from short term rentals to permanent
Rental markets have remained relatively soft over the
                                                           rentals, as well as a recent construction and
past few years with annual growth in capital city rents
                                                           investment boom that has contributed to higher stock
tracking well below the decade average. Based on
                                                           levels. While supply has risen, demand has been
data for the twelve months ending May 2020, capital
                                                           felt the impact of a combination of stalling overseas
city rents were up 0.5 per cent compared with the ten
                                                           migration and falling foreign student numbers.
year annualised growth rate of 1.7 per cent growth.
                                                           Additionally, the unprecedented plunge in jobs through
Across the capital cities, over the twelve months to
                                                           April has had a larger impact across industry sectors
May 2020, Adelaide and Perth recorded the highest
                                                           such as the food and accommodation services.
growth in rents, up 2.2 per cent and 1.8 per cent
                                                           According to data reported in the April 2020 Financial
respectively, while at the other end of the spectrum,
                                                           Stability Review from the Reserve Bank of Australia
rents were down half a per cent in Sydney and 1.3 per
                                                           (RBA), financially constrained people working in these
cent lower in Darwin.
                                                           sectors are more likely to be renting.
The annual change overcompensates for the more
                                                           From a rental pricing perspective, the highest median
recent weakness in rental market indicators. Over the
                                                           rental rates for a detached house are in Canberra, at
two months ending May 2020, rents have fallen across
                                                           $608 per week, while Perth house rents are the lowest
every capital city apart from Perth, where rents (from a
                                                           of any capital city with a median of $380 per week.
low starting base) continued to show a subtle rise. The
                                                           Sydney shows the highest unit rents, with a median
renewed weakness in rental markets can be attributed
                                                           weekly price of $520, while Adelaide unit rents are the
to both a rise in supply and reduction in demand.
                                                           lowest with a median of $350 per week.

                                                                     Australian Affordable Housing Report F2021   9
Graph 1: Annual change in capital city rental rates

            8.0%

            7.0%

            6.0%

            5.0%

            4.0%

            3.0%

                                                                   decade average
            2.0%

            1.0%

            0.0%

           -1.0%
            Oc 0
            M 0

            Au 1

            Ja 1

            Ju 2

            No 2

            Ap 2

            Se 3

            Fe 3
                 14

            De 4
            M 4

            Oc 5
            M 5

            Au 6

            Ja 6

            Ju 7

            No 7

            Ap 7

            Se 8

            Fe 8
                 19

            De 9
            M 9
                 20
                 1
               t1

                 1

                 1

                 1

                 1

                 1
               r1

                 1

                l1

                 1

                 1
               t1

                 1

                 1

                 1

                 1

                 1
               r1

                 1

                l1

                 1
              ay

              ar

               g

               n

               n

               v

               p

               b

               c
              ay

              ar

               g

               n

               n

               v

               p

               b

               c
              ay
             Ju

             Ju
            M

                   Source: CoreLogic, June 2020

            Graph 2: Changes in rents, 12 months ending May 2020

          National                                                                         0.9%
Combined regionals                                                                                                  2.2%
 Combined capitals                                                            0.5%
         Canberra                                                           0.4%
           Darwin          -1.3%
           Hobart                                                                                 1.2%
             Perth                                                                                          1.8%
          Adelaide                                                                                                  2.2%
          Brisbane                                                                         0.9%
        Melbourne                                                                   0.7%
           Sydney                                   -0.5%

                           -1.5%        -1.0%           -0.5%   0.0%       0.5%        1.0%          1.5%    2.0%     2.5%

                     Source: CoreLogic, June 2020

           10      PowerHousing Australia
Dwelling values of growth through the second half of 2019, however
values drifted lower in Perth and Darwin; although
As indicated, Australian house prices across each both cities started to show a recovery trend towards
capital city in Australia since 2009 have had a five the end of the year and through early 2020.
year period where house prices grew at over 20 per
cent per year on year, far outstripping wages growth. More recently, the trend in housing values has lost
momentum. The pace of capital gains was already
Whilst record supply of 230,000 home starts were broadly slowing prior to the COVID-19 pandemic,
completed at peak annual build rate to exceed as housing affordability became more challenging.
population need and underlying market demand, the Conditions slowed more sharply from mid-March as
price finally stabilised and then dropped in the major social distancing restrictions were implemented and
capitals. borders closed.
Housing values were well into a strong upswing Housing values recorded their first month-on-
prior to the COVID-19 pandemic. The second half month fall since June 2019 over May, down 0.4 per
of 2019 saw capital city home values surge 7.0 cent nationally. Considering the weak economic
per cent higher, with significantly stronger growth conditions and heightened uncertainty, the declining
in Sydney, where values were up 9.9 per cent over trend in home values looks mild to-date, however
the same time frame, and Melbourne where values there could be additional downward pressure on
jumped 9.6 per cent. Most of the remaining capital home values later this year as stimulus measures are
cities recorded a lower but more sustainable pace tapered or removed and bank leniency policies expire.
Graph 3: Rolling annual change in capital city dwelling values
0.2%
0.15%
0.1%
0.05%
0.0%
-0.05%
-0.1%
00
05
10
15
20
ay
ay
ay
ay
ay
M
M
M
M
M
Source: CoreLogic, June 2020
Australian Affordable Housing Report F2021 11Graph 4: Change in dwelling values, 12 months to May 2020
National 8.3%
Combined regionals 3.5%
Combined capitals 9.7%
Hobart 6.2%
Perth -2.1%
Adelaide 1.8%
Brisbane 4.3%
Melbourne 11.7%
Sydney 14.3%
-4% -2% 0% 2% 4% 6% 8% 10% 12% 14% 16%
Source: CoreLogic, June 2020
Opening of the Phil Brady Community Garden -
Link Housing (NSW)
Dwelling values over the past twenty years
Over the past twenty years the median value of a over this period, although inflation in home values
capital city dwelling has risen by $462,350, or 252 was much stronger over the first decade (between
per cent, with a larger 277 per cent lift in house 2000 and 2010, capital city dwelling values rose
values relative to units (+203 per cent). by +155 per cent) than the second (+38 per cent
between 2010 and 2020).
On an annual compounding basis, capital city home
values have been rising by 6.5 per cent per annum
12 PowerHousing AustraliaTable 1: 20 year property value change
Median dwelling values over the past twenty years
Combined
Month Sydney Melbourne Brisbane Adelaide Perth Hobart Darwin Canberra capitals National
31/05/2000 $283,507 $189,872 $144,767 $127,405 $152,406 $107,446 $154,450 $160,861 $183,159 $159,215
5yr change 60.7% 56.1% 12.9% 20.2% 29.8% 6.2% na 13.0% 38.9% 30.2%
31/05/2005 $432,004 $312,104 $304,248 $262,088 $288,646 $255,985 $252,431 $345,878 $329,482 $307,696
5yr change 52.4% 64.4% 110.2% 105.7% 89.4% 138.2% 63.4% 115.0% 79.9% 93.3%
31/05/2010 $502,694 $490,577 $441,843 $380,023 $486,501 $340,167 $496,764 $504,029 $467,689 $423,317
5yr change 16.4% 57.2% 45.2% 45.0% 68.5% 32.9% 96.8% 45.7% 41.9% 37.6%
31/05/2015 $747,010 $543,062 $458,134 $396,735 $521,936 $322,756 $514,978 $509,595 $565,172 $476,769
5yr change 48.6% 10.7% 3.7% 4.4% 7.3% -5.1% 3.7% 1.1% 20.8% 12.6%
31/05/2020 $885,158 $686,798 $508,386 $441,184 $443,669 $486,056 $393,939 $637,279 $645,511 $557,817
5yr change 18.5% 26.5% 11.0% 11.2% -15.0% 50.6% -23.5% 25.1% 14.2% 17.0%
Median house values over the past twenty years
Combined
Month Sydney Melbourne Brisbane Adelaide Perth Hobart Darwin Canberra capitals National
31/05/2000 $291,390 $199,041 $144,213 $135,268 $156,535 $109,318 $161,051 $172,740 $180,196 $155,371
5yr change 63.6% 56.5% 12.9% 22.8% 30.3% 5.2% na 20.9% 37.2% 29.1%
31/05/2005 $475,309 $336,233 $318,342 $278,652 $298,315 $264,983 $279,578 $368,381 $341,777 $314,128
5yr change 63.1% 68.9% 120.7% 106.0% 90.6% 142.4% 73.6% 113.3% 89.7% 102.2%
31/05/2010 $558,459 $532,988 $463,212 $401,811 $502,594 $356,965 $533,029 $540,446 $489,650 $433,995
5yr change 17.5% 58.5% 45.5% 44.2% 68.5% 34.7% 90.7% 46.7% 43.3% 38.2%
31/05/2015 $860,788 $619,731 $487,413 $424,858 $548,650 $343,716 $565,860 $552,634 $594,692 $485,568
5yr change 54.1% 16.3% 5.2% 5.7% 9.2% -3.7% 6.2% 2.3% 21.5% 11.9%
31/05/2020 $1,016,726 $809,274 $559,975 $478,294 $461,366 $514,496 $473,861 $716,663 $680,577 $571,999
5yr change 18.1% 30.6% 14.9% 12.6% -15.9% 49.7% -16.3% 29.7% 14.4% 17.8%
Median unit values over the past twenty years
Combined
Month Sydney Melbourne Brisbane Adelaide Perth Hobart Darwin Canberra capitals National
31/05/2000 $275,870 $178,693 $146,527 $97,438 $129,242 $98,881 $143,325 $140,193 $191,309 $171,924
5yr change 57.7% 59.4% 12.6% 6.4% 24.6% 9.8% na -0.8% 43.6% 33.8%
31/05/2005 $380,874 $286,347 $255,823 $205,135 $234,242 $218,214 $185,682 $291,200 $302,521 $290,435
5yr change 38.1% 60.2% 74.6% 110.5% 81.2% 120.7% 29.6% 107.7% 58.1% 68.9%
31/05/2010 $457,858 $448,261 $380,773 $314,544 $404,941 $277,132 $415,333 $420,060 $424,942 $397,748
5yr change 20.2% 56.5% 48.8% 53.3% 72.9% 27.0% 123.7% 44.3% 40.5% 36.9%
31/05/2015 $658,616 $478,571 $393,140 $316,634 $444,454 $268,524 $447,450 $402,905 $515,691 $455,513
5yr change 43.8% 6.8% 3.2% 0.7% 9.8% -3.1% 7.7% -4.1% 21.4% 14.5%
31/05/2020 $772,204 $580,009 $388,894 $335,052 $355,576 $403,382 $272,648 $444,292 $580,239 $523,326
5yr change 17.2% 21.2% -1.1% 5.8% -20.0% 50.2% -39.1% 10.3% 12.5% 14.9%
Source: CoreLogic, June 2020
Australian Affordable Housing Report F2021 13Proportion of homes sold under $400k
The past five years has seen a reduction in the under $400k reduced from 35.5 per cent in 2015 to
proportion of homes selling at a price point lower 27.7 per cent in 2020, while unit sales under $400k
than $400k. Nationally, the proportion of houses sold reduced from 35.8 per cent to 32.0 per cent.
Table 2: Sales by price point, 12 months to May 2020
% sold under $400k Houses Units
2015 2020 2015 2020
Sydney 8.4% 3.6% 12.2% 6.6%
Melbourne 25.4% 2.7% 28.4% 17.8%
Brisbane 31.9% 23.6% 44.2% 52.0%
Adelaide 44.2% 35.9% 75.8% 68.2%
Perth 17.3% 33.7% 37.7% 56.8%
Hobart 61.2% 28.3% 78.6% 51.0%
Darwin 22.3% 29.8% 27.4% 76.4%
Canberra 16.8% 3.6% 44.5% 36.5%
Combined capitals 22.7% 15.0% 26.8% 23.5%
National 35.5% 27.7% 35.8% 32.0%
Source: CoreLogic, June 2020
Perth and Darwin, where housing values have moved $400k comprising the smallest proportion in
through a sustained correction, were the only capital Melbourne (2.7 per cent), Sydney (3.6 per cent) and
cities to record a rise in the proportion of houses Canberra (3.6 per cent).
selling under $400k, while across the unit sector,
Every city shows the unit market with more affordable
Brisbane can be added to the list along with Perth
price points, however Sydney stands out with only 6.6
and Darwin.
per cent of unit sales transacting under $400k over
Some cities have seen a material reduction in the past twelve months.
affordably priced homes, with house sales under
Auctions
70.1 per cent across the combined capital cities. This
reflected a market in which housing demand was
strong.
However, once housing-specific social distancing
restrictions were implemented in late March, auctions
markets were negatively impacted. With vendors
unable to hold open homes or on-site auctions,
a large proportion of scheduled auctions were
In the four weeks prior to Australia’s 100th confirmed
withdrawn from the market, which skewed clearance
case of COVID-19, auction clearance rates averaged
rates to the low 30 per cent range.
14 PowerHousing AustraliaGraph 5: Auction clearance rate, combined capital cities
100%
90%
80%
70%
60%
50%
40%
30%
20%
10%
0
May 08 May 09 May 10 May 11 May 12 May 13 May 14 May 15 May 16 May 17 May 18 May 19 May 20
Source: CoreLogic, June 2020
Graph 6: Auction clearance rate, Sydney and Melbourne
100%
90%
80%
70%
60%
50%
40%
30%
20%
n Melbourne n Sydney
10%
0
May 08 May 09 May 10 May 11 May 12 May 13 May 14 May 15 May 16 May 17 May 18 May 19 May 20
Source: CoreLogic, June 2020
Australian Affordable Housing Report F2021 15House price forecast by capital city
CoreLogic and ANZ Researchiii expects a peak-to- Perth market to perform the best with a decline of
trough decline of 10 per cent on average across just 2 per cent expected. Prices in Brisbane, Darwin,
the capital cities, with the sharpest falls in Sydney, Adelaide and Canberra are all expected to fall solidly.
Melbourne and Hobart. ANZ Research expects the
Graph 7: Change in dwelling values, 12 months to May 2020
12
10
8
6
4
2
0
-2
-4
-6
-8
-10
National Sydney Melbourne Brisbane Adelaide Perth Hobart Darwin Canberra
n 2017 n 2018 n 2019 n 2020 (forecast) n 2021 (forecast)
Source: CoreLogic, ANZ Research, May 2020
Access Housing (WA)
16 PowerHousing AustraliaA2. RESIDENTIAL HOUSING FORECASTS
We learn less than usual from history in the While these numbers present a mixed position for
COVID-19 environment. The outlook for housing housing, the initial forecasts tell a different story.
starts is very uncertain, as is the case for the
broader domestic and global economic dynamic.
Key forecasters provide low
Recent new home sales fell by 22.8 per cent in the
forecasts for new housing delivery
two months following the introduction of tough
pandemic social restrictions, triggering a wave of HIA F2021 111,510 commencementsvi
project cancellations that could derail the economic MBA F2021 115,822 commencementsvii
recovery in 2021.iv
UBS F2021 100-120,000 commencementsviii
Builders and subcontractors were also forced to
slash their rates and forgo profits as contract work
dries up in the wake of the economic slowdown.v
Graph 8: New residential construction and HIA forecasts
Seasonally adjusted
240,000
220,000
200,000
180,000
160,000
140,000
120,000
100,000
80,000
60,000
40,000
159,820
132,630
185,120
219,480
234,120
221,580
230,480
111,510
162,420
145,260
166,020
196,430
160,200
20,000
0
8
9
0
1
2
3
4
5
6
7
8
9*
1*
/0
/0
/1
/1
/1
/1
/1
/1
/1
/1
/1
/1
/2
07
08
09
10
11
12
13
14
15
16
17
18
20
20
20
20
20
20
20
20
20
20
20
20
20
20
Source: HIA, May 2020 * Forecast
Australian Affordable Housing Report F2021 17UBS expects housing starts to fall to around 120,000 commencements per year. The key point here is that
in the 2020 calendar year. Housing starts could well new commencements could be activated based on
dip below 100,000 in coming quarters, which would Government investment and the intervention that has
be the lowest level since 1960. Investment bank UBS been made.
has already forecast new housing starts nationally
Whilst providing a trough projection, point projections
– to fall below an annualised 100,000 in coming
of forecasts are much more difficult in the current
quarters, which is down to 1960s levels.ix
environment as the situation is extremely fluid. The
With the release of the HomeBuilder package table developed by respected housing economist
and some state stimulus announcements from Harley Dale below provides four distinct scenarios as
Tasmania, Western Australia and South Australia, the to where housing starts (and dwelling completions)
above forecasts could rise by 15-25,000 new dwelling may end up over the period to the end of 2020/21.
Table 3: New dwelling commencements and completions - scenario analysis
Commencements
Worst Case Low Medium High
Number % change Number % change Number % change Number % change
2018/19 197,000 197,000 197,000 197,000
2019/20 153,600 -22% 153,600 -22% 153,600 -22% 153,600 -22%
2020/21 98,300 -36% 112,000 -27% 127,900 -17% 135,704 -12%
Completions
Worst Case Low Medium High
Number % change Number % change Number % change Number % change
2018/19 215,200 215,200 215,200 215,200
2019/20 182,800 -15% 182,800 -15% 182,800 -15% 182,800 -15%
2020/21 96,345 -47% 96,345 -39% 96,345 -31% 96,345 -27%
Source: HDD Consulting, June 2020
The ‘Worst Case’ scenario presented in the table new home stakeholders such as first home buyers
above would take new home building activity to an (FHBs), at least partially offsetting the overall lack
unprecedented low. We are looking at a virtually of private demand for new housing which will be
unprecedented economic and social crisis, evident for some time to come.
including the possibility of the lowest immigration
The 2009 Social Housing Initiative and grant boost
levels since 1870 (World War One excluded).
to FHBs of new homes both played a significant role
The ‘Low’ scenario is the most likely in the absence in safeguarding Australia from the most damaging
of government stimulus to the new home building impacts of the GFC. While an on-going exodus of
sector. The ‘Medium’ scenario presumes some residential investors will now leave a potential gap
government stimulus, which we now have, but for FHBs and existing owner occupiers, broader
recognises that private demand for new housing may economic constraints mean private sector housing
be constrained by broader economic factors. The demand may not be stimulated to the extent that
‘High’ scenario incorporates government stimulus occurred around the GFC. This assumption is
which targets social housing, as well as broader incorporated in the figures outlined in Table 3.
18 PowerHousing AustraliaThe ‘High’ scenario also recognises the possibility • Value of foreign investment approvals in
that the economy begins to rebound faster than residential real estate increasing from $36.5b in
anticipated. By the time it becomes evident as to 2013-14 to $72.4b in 2015-16:
whether the Australian economy is performing
> the massive spike in new housing starts was
better than expected in 2020/21 - but (inevitably)
driven to a considerable extent by foreign
still not well - the time for housing stimulus will
investment. As the foreign investment
have come and gone.
component of a new development, particularly
All the industry forecast figures presented in the in the medium/high density space’ saw
Table 3 are bleak, at best, by historical standards. 20-40 per cent of a development presold,
In our view, properly targeted assistance to the then the remaining buyer groups from first
new home building sector can mitigate the risk home buyers, investors and owner occupiers
of Australia confronting the two worst scenarios purchased the rest;
outlined above and potentially bolster the final
• The sustainment of elevated levels of new home
outcomes of the other two scenarios.
building in Victoria over an extended period,
While the nation’s leading economists were around driven by a very high NOM rate of population
55,000 homes short of the 230,000 new homes growth.
commenced at the 2018 peakx (and it is hoped
This confluence of factors saw dwelling
that forecasters in this case are overestimating the
completions in Australia reach a record of 223,701
trough) this does provide a baseline from which to
in the year to the March 2017 quarter. Completions
consider the future outlook, need and options for
remained above the annual level of 215,000 until the
recovery.
end of 2018/19.
A reasonable starting point for considering
2018-2021 from peak to trough Australia’s unprecedented residential building
The historic requirement for new housing in boom underlying demand and future demand is
Australia has changed markedly in recent years. the September 2013 quarter, when completions
This is a result of the unprecedented residential were running at an annual level of 150,488. These
building boom which began in 2012/13 and recorded figures start to bring the magnitude of
plateaued from June 2016 to September 2018. the latest cycle to prominence, with the level of
nearly 150,500 providing some one-third fewer new
The boom was driven by a number of factors, which
dwellings than the record two year peak plateau.
are important to recognise prior to considering
projections for underlying housing demand and Dwelling completions averaged 197,516 per annum
new residential construction activity from 2019/20 over the period from the September 2013 quarter to
onwards. the December 2019 quarter. This level is 25 per cent
higher than the average of 147,399 for the period
Key factors include:
over 1984/85 -2012/13. Dwelling completions in
• Historically (very) low borrowing costs; the December 2019 quarter were still running at an
• Historically high levels of Net Overseas Migration annual level exceeding 200,000.
(NOM), the majority of which was for temporary While the actual data will not be released until
visa holders, but that also included high levels of ABS numbers arrive in mid October 2020, housing
permanent (skilled) migration; completions will be shown to remain bouyant at
• The strong recovery in new home building in 180,000 for the twelve months ending 30 June
New South Wales, which followed a decade of 2020. These actual elevated numbers when
recessionary levels of activity for the state; presented will be out of step with forecast demand.
Australian Affordable Housing Report F2021 19Graph 9: National Building Activity
Forecast to June 30,2020 (ABS 8752.0)
250,000
200,000
150,000
100,000
Completions
Average completions
50,000
0
Jun 1994
Dec 1994
Jun 1995
Dec 1995
Dec 1997
Dec 1999
Jun 1996
Dec 1996
Jun 1997
Jun 1998
Dec 1998
Jun 1999
Jun 2000
Dec 2000
Jun 2001
Dec 2001
Jun 2002
Dec 2002
Jun 12003
Dec 2003
Jun 2004
Dec 2004
Jun 2005
Dec 2005
Jun 2006
Dec 2006
Jun 2007
Dec 2007
Jun 2008
Dec 2008
Jun 2009
Dec 2009
Jun 2010
Dec 2010
Jun 2011
Dec 2011
Jun 2012
Dec 2012
Jun 2013
Dec 2013
Jun 2014
Dec 2014
Jun 2015
Dec 2015
Jun 2016
Dec 2016
Jun 2017
Dec 2017
Jun 2018
Dec 2018
Jun 2019
Dec 2019
Jun 2020
Source: ABS 8752.0, Property and Industry Analytics Australia
While this peak was a response to decades of international border restrictions begin to be relaxed,
undersupply, the huge tail of activity is still washing which it is too early to tell in mid-2020.
though the market in a time now where buyer
In a related manner, outcomes will also depend
capacity to purchase is forecast to fall dramatically.
on the timing and duration of a recovery in labour
market conditions. We know from history that
Where to now for overall underlying when unemployment rises, NOM falls. Once
housing demand and activity? the unemployment rate rises significantly it is
(historically) very difficult to bring it back down.
In such fluid times it is difficult for any organisation
to look beyond 2019/20 with any reasonable degree Prior to the COVID-19 crisis, respected economic
of clarity. forecaster BIS Oxford projected an outlook where
underlying demand (UD) averages 195,800 over
Two factors that are readily apparent are: net
the period 2019-2023. That is a level that is 3,426
immigration has impacts on both the demand for
dwellings fewer per annum than applied to the 2018
and supply of housing; the demand for housing
-2019 period.xi
historically reacts faster to crises than supply and
large declines in net immigration will have a very big For residential housing, any weakness in migration
downward effect on the demand for housing. It is is a significant headwind. UBS estimates there will
clear from early temporary visa data for the March be a fall in underlying annual housing demand from
2020 quarter that levels of NOM are already in steep around 200,000 to only around 130,000 in the near
decline. term – before recovering towards 190,000 by the
end of 2022.xii
It may turn out that the relative success of Australia
(and New Zealand) in combatting COVID-19 According to the ABS, Australia’s population grew
mitigates the substantial downward projection by 239,600 from NOM in 2018-19.
for NOM in 2020/21. That will depend on when
20 PowerHousing AustraliaAustralia’s overseas migration intake is projected and to just 0.7 per cent in 2020/21. Australia’s
to shrink by more than 85 per cent on 2018-19 population growth was previously forecast to have
levels next financial year, due to widespread been 1.42 per cent at the end of 2019. A growth
travel bans brought on by the coronavirus.xiii rate of 0.7 per cent would be the lowest on official
The government estimates long-term migration records in forty years.1
arrivals could fall by around 280,000 over the
Treasury’s forecasts assume a largely steady
next 18 months, with a drop of 72,000 in the first
rate of natural population growth. The rate of
half of this calendar year and another 204,000 in
natural population growth feeds into estimates of
the 2020/21 financial year. This is a worst case
underlying housing demand through the outlook
scenario, but highly possible.
for household formation rates. Given Australia’s
The Commonwealth Treasury expects Australia’s ageing population and historical evidence of a
NOM to fall substantially over 2019/20 and decline in fertility rates occurring during periods
2020/21. It projects a decline of 165,000 people in of recession, this assumption appears optimistic.
2019/20 and a further decline of 65,000 people in In turn, that implies downside risk to Treasury’s
2020/21. Under this scenario, population growth forecasts, as previously noted, which in mid-2020
would slow to 1.2 per cent per annum in 2019/20 are the best benchmark available.
Graph 10: Capital City Population Growth
120,000
100,000
80,000
60,000
40,000
20,000
0
-20,000
-40,000
Sydney Melbourne Brisbane Adelaide Perth Hobart Darwin Canberra
n Natural increase n Net internal migration n Net overseas migration — Total change in population
Source: ABS, ANZ Research (May 2020)
This is because prior to the devastating economic The impact on the underlying demand for new
and social impacts of the COVID-19 Pandemic, housing could see a level as low as 140,000
the trajectory for Australia’s population growth dwellings per annum. That would represent an
was already in decline. The rate of population unsustainably low level of new housing provision
growth would have declined further, regardless (see table below). Given the aforementioned
of contemporary circumstances. It is now the constraints on private demand for new housing,
magnitude of the impending decline that counts. the social housing sector can provide vital stimulus
which provides both an economic and social benefit.
1 Excluding World War One, it would represent the lowest level in Australian history since 1870.
Australian Affordable Housing Report F2021 21Table 4: Underlying demand for new housing in Australia – Average annual increase (‘000)
Year ended June Low Medium High Total UD
2017-2018* 199.2 199.2 199.2 199.2
2019-2023 140.0 155.0 168.0 154.3
2024 2028 153.9 159.7 173.4 162.3
2029-2033 158.3 199.7 220.2 192.7
Source: BIS Oxford Economics; HDD Counsulting
Without further housing stimulus and a directed housing will stem from internal sources of ‘market
policy towards encouraging net overseas migration, failure’ which already existed, meaning there was
when borders eventually open, the Australian a pre-existent lack of supply. Market recovery is
economy will fail to recover as strongly and swiftly unlikely to come from overall housing demand which
as Australia requires. is primarily driven by the private sector, as is outlined
further below. The provision of social housing is a
primary example of contemporary demand for new
Projections for the Underlying
housing which reflects a pre-existing shortage of
Demand for Social Housing
dwelling stock.2
The need for additional affordable and social
Contributing to our social housing waiting lists are
housing is real and urgent. This important housing
now the thousands of rough sleepers who had
cohort will continue to grow, especially given that
been placed in accommodation (often hotels) for
almost 600,000 people lost their job in April alone,
protection during COVID-19 lockdowns. The NSW
following the nationwide COVID-19 restrictions
government, amongst others, is looking to find a
implemented by all levels of government.
solution for those in Temporary Accommodation,
The overall implication is that the most direct however the difficulty remains: a lack of dwelling
approach to addressing the demand for new stock.
Our Social Housing Waiting Lists
Number of applicants waiting in each state
Source: Australian Institute of Health and
Welfare, 2019 5,212
34,788
14,330
35,257
51,163
2,189
48,280
2 The recent unprecedented boom in new residential construction activity effectively eradicated
the excess demand for housing in the private sector, an under supply that had persisted since the 3,496
early-mid 2000’s. Pockets of oversupply did emerge, but have tended to be exaggerated. Through
the building boom of the 2010’s, social housing still failed to meet underlying demand.
22 PowerHousing AustraliaAccessible Properties NZ and PowerHousing, 2019
Rental Stress PowerHousing partner Community Sector Banking’s
Rental Affordability Index echoes the same
This lack of supply places increased demand on sentiment. Using data which predates COVID-19
the rental market. In Anglicare Australia’s recent by six months, the report illustrated the decreasing
Rental Affordability Snapshot (April 2020), almost availability of affordable rentals for vulnerable
70,000 private rental listings were assessed for groups, citing that more than a million households
their affordability and suitability for low income need some form of housing assistance.xv Coupled
households. Even in the wake of increased with Anglicare’s Snapshot, the future looks bleak.
government subsidies due to COVID-19, the ability
to find an affordable rental property is dire. With the
high rental prices, people on lower incomes are also Fit for Habitation Rentals
competing with people on higher incomes who are In New Zealand, the government released Healthy
not themselves in homeownership.xiv Homes Standards for rental properties which
The Snapshot reported the following: became law on 1 July 2019. New Zealand CHP and
PowerHousing Associate Accessible Properties
• Only 1.5% of rentals are affordable for a person is implementing the measures across two and
on the new increased Jobseeker payment; a half thousand properties which has been best
• Without the increase, not a single rental would practice for our Australian Members. Like the
be affordable for jobseekers in the major cities of NSW legislation, it aims to improve the quality of
Sydney, Melbourne, Adelaide, Darwin, or Canberra; rental homes, leading to improved health of the
residents, thus lowering medical costs and levels
• 1% of rentals are affordable for a person on the
of hospitalisation. It is also anticipated that warmer
Age Pension;
and drier homes means that landlords are less
• 0.5% of rentals are affordable for a person on the likely to have issues with mould or mildew damage,
Disability Support Pension; and therefore protecting their investment.
• 2.4% of rentals are affordable to a single person The standard of rental properties is varied, not
working full-time on the minimum wage. only in the private rental market. Ageing rentals
maintenance have been forced over COVID-19
Australian Affordable Housing Report F2021 23to be placed on hold as issues (both scheduled 5. Have adequate plumbing and drainage
and non-scheduled) have been backlogged as
6. Be connected to a water supply service or have
a result of COVID-19 lockdowns. Even before
infrastructure that’s able to supply hot and cold
the pandemic, the standard of rental was under
water for drinking, washing and cleaning
review and the NSW government introduced its
Fit for Habitation requirements through its revised 7. Contain bathroom facilities that allow for
Residential Tenancies Act in March 2020 (enforced privacy, including toilet and washing facilities.
has been relaxed over COVID).xvi Both Queensland Whilst these criteria seem fair and logical, it is the
and Victoria are looking to follow suit, to ensure case that there are still rentals (both private and
minimum living standards are reached in rental government) that exist with substandard living
properties. The NSW legislation stipulates that all conditions in which our most vulnerable groups
rental properties must: continue to reside.
1. Be structurally sound (a reasonable state of The Fit for Habitation requirements are expected
repair, no significant dampness, no water to soon be enforced as COVID-19 restrictions
penetration, and structural elements not be ease. Andrew Cox of Property Safe, which has
liable to collapse because of rot or defects) over 50,000 tradies registered and maintenance
2. Have adequate lighting, either natural or artificial contracts across Australia, has seen these trades
(except in storage rooms or garages) pick their tools back up as backlog maintenance
and proactive work is now underway in anticipation
3. Have adequate ventilation
of the requirements being enforced in October.
4. Be supplied with electricity or gas with an These tradies have been seriously grateful to be
adequate number of outlets for lighting and back out on site and this maintenance work will
heating generate thousands of jobs in the coming months.
Case Study – Aaron now enjoying being at home
Newly housed Foundation Housing tenant priority status on the joint housing waitlist
Aaron says being offered a one-bedroom unit enabled him to be offered a tenancy when
in a complex in East Perth during COVID-19 the unit became available. Friends have
restrictions has been life changing. helped him to furnish it and the former baker
is now looking forward to hosting a mini
Aaron, who is in his late 40s, moved in a week
housewarming to watch the footy over burgers
and half ago and says it’s wonderful to have (with homemade buns of course!) now that
a ‘forever home’ he can make his own. Prior restrictions in WA are largely lifted.
to becoming a tenant, Aaron was staying at a
Men’s Shelter operated by the Salvation Army While Foundation Housing moved rapidly
to minimise all non-essential contact when
and said he wasn’t expecting his situation to
COVID-19 restrictions came into place in
change during COVID-19 as restrictions had
March, they have continued to allocate homes
put a ‘stop on everything’.
in their mainstream portfolio to new tenants
While initially hoping to secure a room in in order to house as many people as possible
a lodging house, he was delighted that his during this difficult time.
24 PowerHousing AustraliaA3. WILL THE MARKET KICKSTART ITSELF?
The challenge will be that the housing market may not To put the rescue package into perspective, the 3.3
be capable of being able to kickstart itself, a challenge million Australians and their employers supported by
that may last for many years, due to a combination of JobKeeper today costing around $10 billion a month.
factors. If these people were unemployed the unemployment
rate would be above 30 per cent.
Since 22 March 2020, Australia saw the progressive
introduction of social distancing and business-related Clearly, the ongoing health and economic impacts
operating restrictions to minimise the spread of of COVID-19 are prompting governments, business,
COVID-19. In addition, a range of government support NFPs and the wider community to rethink how society
measures were announced, including changes to the should, and could operate. Employment and housing
JobSeeker program (announced on 24 March), the are two themes in particular that have dominated
temporary suspension of the requirement for people discussion over recent months.
to actively look for work, and the introduction of a
JobKeeper wage subsidy (announced on 30 March).
Graph 11: Employed People (Total)
13,100
12,900
12,700
12,500
12,300
12,100
11,900
11,700
11,500
11,300
5
15
15
6
16
16
7
17
17
8
18
18
9
19
19
0
01
01
01
01
01
02
20
20
20
20
20
20
20
20
20
20
r2
r2
r2
r2
r2
r2
g
c
g
c
g
c
g
c
g
c
Ap
Ap
Ap
Ap
Ap
Ap
De
De
De
De
De
Au
Au
Au
Au
Au
Source: ABS 6202.0 Table 1 (Seasonally Adjusted)
Australian Affordable Housing Report F2021 25Adding to this issue is the growth in the number shape the recovery. It is difficult to be precise about
of underutilised (a combination of unemployed the magnitude and timing of these effects.
and underemployed) workers - rising 6 per cent
The Australian Banking Association recently
to 20 per cent in April alone. A reduction in work
released new figures which showed 429,000
hours and wages will place further pressure on the
mortgages had been deferred totalling $153.5
affordable housing market, given that for many, the
billion.xxii The figures take the total number of loans
proportion of household income spent on housing
deferred to 703,000, worth a value of $211 billion.
will rise past 30 per cent - a common indicator of
As we reach October, with a higher unemployment
housing stress.
rate, the question will be how many of these loans
The ABS wage price index saw wages rise will need to be deferred for a longer period of time.
nationally at just 2.1 per cent for the year ending
March 31 2020.xvii
House prices are forecast to drop
Flatlining wages growth, decades of massive price
UBS expects house prices to decline at least 10
increases for residential property and the looming
per cent in the coming year, in line with our ‘full
largest decline ever in housing commencements
pandemic scenario’. Indeed, without an easing
set to emerge in the next calendar year, threatens
of mobility restrictions, and/or more direct policy
to collectively have a very negative impact on the
support, the price falls will likely be larger.xxiii
economy. That was always going to be a challenge
in 2020, even prior to COVID-19.xviii Morgan Stanley’s Australian equity strategists said
this would flow through to house prices and they
• The RBA expects that total hours worked
expected a decline comparable to the previous
will decline by around 20 per cent and the
downturn of 10-15 per cent.xxiv
unemployment rate is forecast to rise to around
10 per cent in the June quarter.xix SQM predicted falls of up to 30 per cent in house
pricing.xxv
Looking at the cumulative change between March
and May, had the increase in the number of people Morgan Stanley joins major bank economists and
who were not in the labour force (623,600) been a investment house AMP Capital in taking a cautious
further increase in unemployment, then the number approach to housing, with researcher SQM also
of unemployed people would have increased to predicting falls of up to 30 per cent.
around 1.55 million people (and an unemployment “We expect a broad housing downturn, with the
rate of around 11.3 per cent).xx rental market in particular likely to weaken, as
In terms of our economy the RBA estimates:xxi higher unemployment and a reduction in net
migration both work to reduce housing demand,
• The Australian economy is expected to record
pushing vacancy rates higher and rental prices
a contraction in GDP of around 10 per cent over
lower”, Morgan Stanley, May 2020.xxvi
the first half of 2020;
“The deterioration in established housing market
• Headline CPI is expected to fall by around 2¼ per
conditions is expected to prolong the decline
cent in the June quarter and headline inflation is
in dwelling investment. Dwelling investment is
expected to be negative in year-ended terms for
expected to be significantly lower over most of
the first time since the early 1960s.
the forecast period than forecast in the previous
The initial phase of the recovery is likely to be primarily Statement. The trough in construction activity is
driven by the easing in restrictions, which will lead now projected to occur in early 2021, half a year
to an improvement in employment outcomes as later than previously expected. The near-term
businesses re-open, as well as a pick-up in household downgrade to activity incorporates information from
spending. In the latter part of the forecast period, liaison citing significantly weaker demand for new
business investment decisions will more strongly dwellings”, Reserve Bank of Australia, May 2020.
26 PowerHousing AustraliaThe analysis points to the devastating impact that Building Approvals and ABS Housing Finance. Both
restrictions on mobility will play in the housing indicators declined significantly from late 2017.
market, hampering not just resident Australians, but Building approvals peaked at a record annual level
staunching the inward flow of migration, a key driver of nearly 226,000 in November 2016. Since that
for the property market. time approvals have fallen by 44 per cent, prior to
The market’s expectation is that it will recover. But mounting a very modest recovery over the nine
the depth and duration of the downturn and the flow months to March 2020.
on impact to employment in trades and subtrades is ABS Building Approvals to the end of April equated to
of deep concern. 173,802 dwellings approved for the past 12 months.
The three months through Feb-Apr 2020 saw 46,000
dwellings approved alone which, would annualise
Future Pipeline
to around 186,000 dwellings approved if carried
Two prominent leading indicators of new housing forward.xxvii This shows a large potential pipeline that
activity and intend to build new homes are ABS can still come through.
Graph 12: Monthly building approvals for Australia
26,000
24,000
22,000
20,000
18,000
16,000
14,000
12,000
10,000
8,000
Mar 99
Mar 00
Mar 01
Mar 02
Mar 03
Mar 04
Mar 05
Mar 06
Mar 07
Mar 08
Mar 09
Mar 10
Mar 11
Mar 12
Mar 13
Mar 14
Mar 15
Mar 16
Mar 17
Mar 18
Mar 19
Mar 20
Source: ABS 8731 Seasonally adjusted Trend
This latest recovery is arguably unsustainable given It is premature to consider the probability of a
the detrimental economic effects of COVID-19. recovery in new home lending figures in 2020/21
or even 2021/22. The Building Approvals measure
Building approvals are projected to display a
outlined above will be critical to observe whether
substantial further step down. One possible scenario
there is a surplus of supply to demand. It will also
is that approvals fall to levels equivalent to those
be critical to watch for a bounce back in activity as
evident for the early months of 2012. That would
monthly updates unfold.
mark a further decline of 30 per cent.
Australian Affordable Housing Report F2021 27You can also read