Faces of Unemployment - April 2020 - Australian Council of Social Service
←
→
Page content transcription
If your browser does not render page correctly, please read the page content below

Faces of Unemployment
April 2020

Faces of Unemployment is a publication by the Australian Council of Social Service and Jobs Australia
Ltd.

It was written by Peter Davidson (Principal Advisor, ACOSS), and Peter Defteros (Policy Analyst, Jobs
Australia Ltd) and research & editorial support from Penny Dorsch (Project Manager & Researcher,
ACOSS). Employment Service Providers ETC, CVGT and BEST Employment, all Members of Jobs
Australia Ltd. provided the case studies. ACOSS and Jobs Australia Ltd. would like to thank the people
who shared their stories for this report, and the agencies that made this possible.

Publicly available data from the Australian Bureau of Statistics and Australian Government departments
were used in the report, along with data on recipients of unemployment payments provided to us by the
Department of Social Services. We would like to thank them for making this data available.

All descriptions, analyses, interpretations and conclusions are solely those of ACOSS and Jobs Australia
Ltd. and cannot be attributed to these government authorities.

First published in 2020 by the Australian Council of Social Service & Jobs Australia Ltd.

Locked Bag 4777
Strawberry Hills, NSW, 2012 Australia
Email: info@acoss.org.au
Website: www.acoss.org.au

ISSN: 1326 7124
ISBN: 978 0 85871 011 5

© Australian Council of Social Service and Jobs Australia Ltd.

Front cover image © Unsplash

This publication is copyright. Apart from fair dealing for the purpose of private study, research, criticism,
or review, as permitted under the Copyright Act, no part may be reproduced by any process without
written permission. Enquiries should be addressed to the Publications Officer, Australian Council of
Social Service. Copies are available from the address above.

Faces of Unemployment 2020                          |2|
Contents
Foreword                                                                                        5
Summary                                                                                         6
      Who receives unemployment payments?                                                       6
      How hard is it for people who are unemployed to find jobs?                                7
      Entry level jobs are declining, and are increasingly part time and casual                 7
      What help do people get to find a job?                                                    8
      What are the outcomes?                                                                    8
      How to reduce poverty and prolonged unemployment                                          9
Part 1: Who receives unemployment payments                                                     12
      What are unemployment payments?                                                          12
      Who receives unemployment payments? It’s not who many people think                       12
      More than half of people on unemployment payments are unemployed long-term               14
      The longer people are unemployed, the more their paid work prospects diminish            14
      Long-term unemployment has many causes                                                   15
      Australia has failed to make serious inroads into long-term unemployment for 3 main
      reasons                                                                               17
People with disabilities: How do they fare in the labour markets and social security system?   19
Dylan’s story                                                                                  22
Part 2: What jobs are available to unemployed people?                                          23
      The roller coaster ride of employment and under employment                               23
      Employment growth picked up during 2017, but recently declined                           24
      The number of people un-and under-employed chasing each job
      vacancy has declined since 2014, but at eight people per job, it remains
      higher than the pre-GFC level                                                            25
      What kinds of jobs are available? The options are narrowing for people
      with low qualifications                                                                  28
      People’s chances of landing a job also depend on where they live                         31
Connie’s story                                                                                 33
Part 3: What help do they get from government?                                                 35
      Are unemployment payments enough to live on and search for jobs?                         35
      What is jobactive, and how do Australian employment services
      compare internationally?                                                                 36
      What are people who are unemployed required to do to receive
      benefits?                                                                                37
      Who receives jobactive services?                                                         37
John’s story                                                                                   38
      What help do people unemployed long-term get, and what are their
      employment outcomes?                                                                     39
      Employment outcomes vary among different programs and for
      different groups                                                                         39
Dave’ story                                                                                    42
      What help do people unemployed long-term need?                                           43
Archie’s story                                                                                 44
Endnotes                                                                                       45

                                                  |3|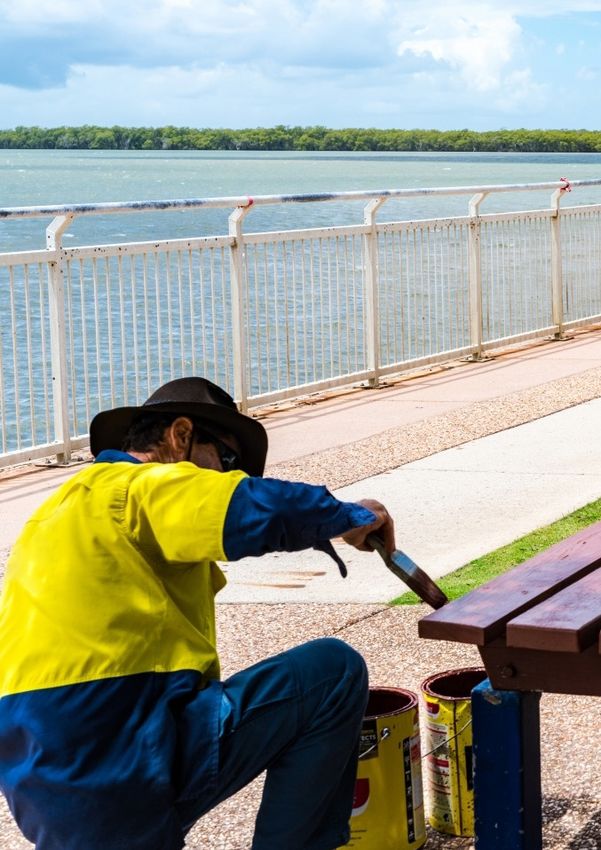
Faces of Unemployment 2020 |4|

Foreword

ACOSS and Jobs Australia Ltd. have partnered to produce this second edition
of Faces of Unemployment. Our shared purpose in producing these reports is to
delve below the official unemployment rate to explore the profile of those people
locked out of paid work, the barriers they face and the enablers to support them
into employment.

This edition of Faces of Unemployment was prepared before the COVID19
pandemic challenge that Australia and the world now face. It analyses
unemployment in Australia in late 2019, including how many people were
unemployed, the challenges they experienced in finding paid work, trends in
employment and unemployment, and which groups in society were most
affected by unemployment.

The current COVID19 crisis means that Australia is likely to experience a period
of high unemployment. This report shows that reform of employment services,
commitment from employers to do the best for current and prospective
employees, and a higher unemployment payment will all play vital roles in
keeping the unemployment rate as low as possible.

ACOSS and Jobs Australia Ltd. would like to thank all those who contributed
to this report: the Australian Bureau of Statistics, the Department of Social
Services and the Department of Education, Skills and Employment for the data
made available to us; and the employment service providers and individuals
who shared their stories with us for this report.

Cassandra Goldie                                                   Debra Cerasa
CEO, ACOSS                                              CEO, Jobs Australia Ltd.

                                       |5|
Summary
This second Faces of Unemployment report looks behind the headline unemployment
statistics to reveal who is affected, why it’s no easy matter for most people who are
unemployed to secure a job, and the disturbing growth in long-term unemployment.
We also look at the chances people on unemployment payments (Newstart and Youth
Allowances, referred to here as NSA and YA) have of getting a job, and the help they
receive from jobactive employment services.1

It is published just as the impact of the coronavirus and government policies to contain
it are reaching the labour market, with hundreds of thousands of people applying for
unemployment payments and economists predicting a large hike in unemployment
that could last for at least six months. It’s too early to assess the impact of this on
unemployment, the profile of people who are unemployed, their future employment
prospects, and the risk that much higher levels of long-term unemployment may
become entrenched. Instead, the report provides a benchmark against which the
changes ushered in by the virus and government and market responses to it can be
assessed. It also serves as a reminder that before the coronavirus, there were already
three quarters of a million people receiving unemployment payments, and that we
must not forget them or leave them behind.

In September 2019, almost half a million people (497,250) had received NSA or YA for
more than a year. They comprised almost two-thirds (64%) of all recipients, compared
with 60% a decade ago (just before the GFC). Of deep concern, almost half (46%)
have received unemployment payments for over two years and 20% for more than five
years.2

The report examines three main reasons for entrenched unemployment:
1.   As unemployment declined, and access to pension payments was closed off, the
     profile of people who are still out of paid work became more disadvantaged.
2. The labour market has changed so that entry-level jobs are either harder to get,
     offer too few paid hours, or are harder to keep.
3. Australia under-invests in employment services, putting social security compliance
     ahead of positive help to secure employment.

Who receives unemployment payments?
In September 2019 there were 756,557 recipients of unemployment payments. They
are largely, but not entirely, the same people as the 715,600 the Australian Bureau of
Statistics classified in that month as unemployed.3

The media presents stereotypical images of people who are unemployed. The real
story is that NSA and YA recipients come from diverse backgrounds and age groups:
•    41% have disabilities (as more people are diverted from Disability Support Pensions
     to NSA);

Faces of Unemployment 2020                |6|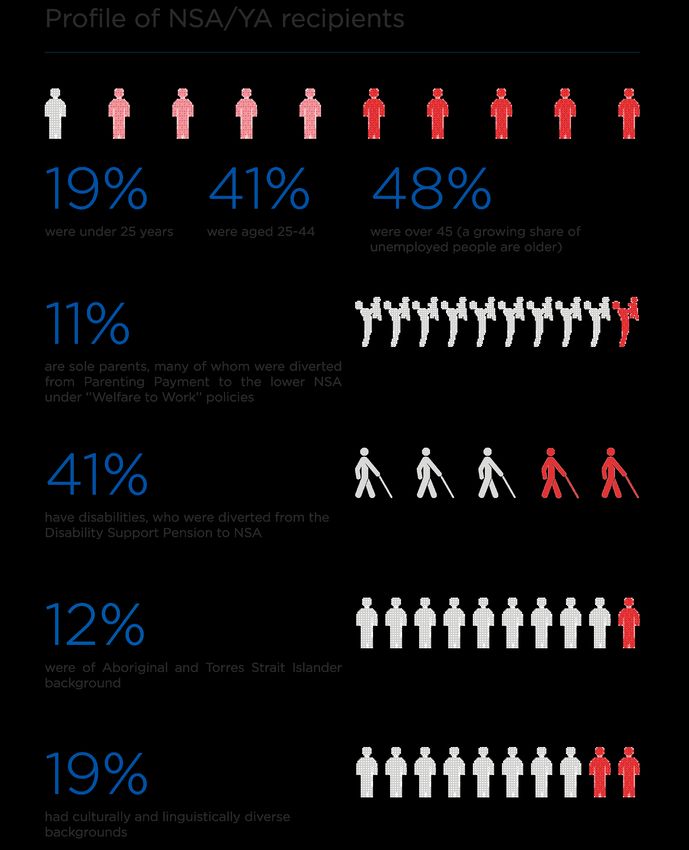
•   19% were under 25 years, 41% were aged 25-44, and 48% were over 45 (a growing
    share of people who are unemployed are older);
•   11% are sole parents, many of whom were diverted from Parenting Payment to the
    lower NSA under ‘’Welfare to Work’’ policies;
•   12% had Aboriginal and Torres Strait Islander backgrounds; and
•   18% had culturally and linguistically diverse backgrounds.4

Most of these groups face significant barriers to employment, including disabilities,
caring roles, and employer discrimination.

How hard is it for people who are unemployed to find jobs?

It’s not easy for people who are unemployed to find a job.

In November 2019 there were eight people unemployed or underemployed (seeking
more paid working hours) for every job vacancy. After declining from 12.2 people
per vacancy in November 2014 to 7.4 in November 2018, competition for jobs has
increased again. For entry-level jobs, competition is tougher, with around a third more
unemployed or underemployed applicants for every job.5

That’s not the whole story, since they are also competing with existing employees
changing jobs and new entrants to paid workforce including school-leavers and
migrants. In 2018 the Department of Education, Skills and Employment estimated there
were an average of 19 applicants in total for every advertised job.6

Following strong growth in employment from 2017 up to June 2019, there has been no
substantial growth in jobs, with 12,281,000 people employed in that month compared
with 12,289,000 in January 2020.

With the bushfires and coronavirus expected to detract from growth in the economy
by at least 0.7% of GDP during the first quarter of 2020, and to have an extended
impact in the second quarter, it is likely that unemployment will rise substantially.7

Entry level jobs are declining, and are increasingly part-time and casual
A further challenge for people who are unemployed (who are twice as likely to have
not completed high school than the broader labour force) is that the share of entry-
level jobs is shrinking. In November 2018, 25.1% of all jobs were in the lowest two levels
(labourer/sales/machinery operators and drivers), down from 27.3% in November 2007.8

Entry-level jobs are increasingly part time or casual jobs. While many people prefer
shorter or flexible working hours, this makes it harder for people to transition from
unemployment payments as they either have insufficient paid hours or are at risk of
losing their casual job. Australia has the second-highest share of casual jobs in the
OECD (25%) and third-highest share of part-time jobs

In 2017-18, among low-paid workers (those receiving less than two-thirds of the median
hourly wage),

                                           |7|
•   67% of award-reliant workers and 48% of non award-reliant workers were classified
    as casuals; and
•   58% of award-reliant workers and 45% of non award-reliant workers were employed
    part-time (with much overlap between these two groups).9

In recent years there has been very strong growth in temporary migration, especially
students and backpackers, of whom 688,402 had visas with employment rights in 2019
(5.6% of the labour force). Many work in entry-level jobs while studying or travelling.
Migration has an overall positive impact on diversity and living standards, but temporary
migrants are vulnerable to exploitation as the 7-11 and Caltex cases demonstrated. The
impact of temporary migration on pay and employment in the entry level labour force
should be assessed.10

What help do people get to find a job?
Activity requirements for people who are unemployed in Australia are among the strictest
in the OECD. They must typically agree to a Job Plan, attend regular appointments
with their jobactive service, look for 20 jobs each month, and for six months of each
year of unemployment participate in or other activities such as part-time work, Work
for the Dole, part-time study, or voluntary work.

jobactive is the government’s main employment services program. In June 2019,
614,000 people were in jobactive services (1,102,000 people were in the program at
some point during 2018-19), of whom 65% were unemployed long-term.11

The government spends $1.3 billion annually on jobactive, an average of $1,630 per
participant (around $2,200 for each person unemployed for 2 years or more).12 In 2017,
overall spending on employment programs for people who are unemployed was less
than half the OECD average level.13

With average caseloads of 140 people, and strict unemployment payment compliance
rules to administer, jobactive services must devote much of their resources to
enforcing compliance with benefit requirements.14 Yet the evidence shows that people
unemployed long-term need much more intensive preparation for jobs, and paid work
experience, mentoring and support to encourage employers to give them a chance.

What are the outcomes?
During 2018-19, among people unemployed for over 12 months, 44% were in employment
3 months after participating in jobactive, compared with 45% in 2016-17.15 Consistent
with the changes in entry-level jobs discussed above, 60% of these jobs were part time
and 54% were casual (compared with 62% and 38% respectively in 2016-17).

In August 2019, of the 88,600 people engaged in the six months of compulsory ‘annual
activity’ described above:
• 36% were in part-time employment (up from 26% in 2016-17);
• 22% were in vocational training (up from 17%);
• 16% were in Work for the Dole (down from 48%);

Faces of Unemployment 2020                 |8|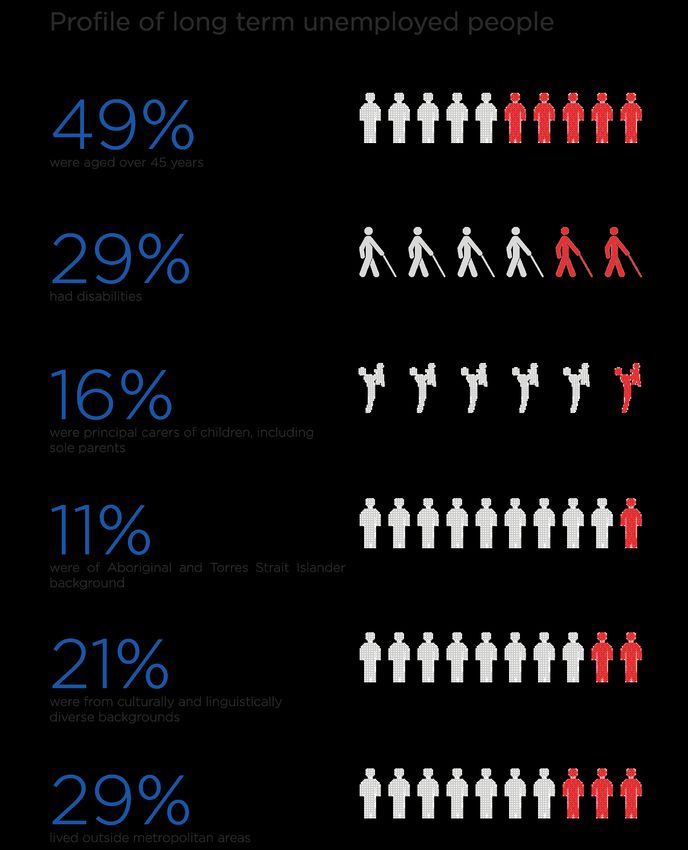
Figure 1: Profile of NSA/YA recipients in September 2019

Sources: Department of Social Services (2019), DSS Payment Demographic Data, September 2019; Available at
http://data.gov.au ; Australian Bureau of Statistics (2019), Australian Demographic Statistics, June 2019

                                                  |9|
•   3% received a wage subsidy for employers to trial them for 3-6 months; and
•   1% were in voluntary work.16

In 2018, employment outcomes (the share of participants in paid employment three
months later) varied among these programs, from:
• 87% after a wage subsidy;
• 34% after vocational training (compared with 36% in 2017-18);
• 24% after voluntary work (compared with 32%); and
• 25% after Work for the Dole (compared with 27%).17

To work out the impact a program has on people’s employment prospects, we need to
know what proportion would have obtained a job without the program. Evidence from
the Department of Employment, Skills, Small and Family Business indicates that:
•   Wage subsidies were relatively effective, lifting the chances of leaving income
    support 12 months after a job placement by an average of 14%; and
•   Work for the Dole was relatively ineffective, increasing the chances of employment
    by an average of just 2%.18

Together with the international evidence on employment programs, this suggests a
greater emphasis on wage subsidies, vocational training, and more efforts to connect
with employers and shape employment assistance around their needs as well as those
of people who are unemployed.

How to reduce poverty and prolonged unemployment
A substantial increase in the single rate of Newstart and Youth Allowances - which has
not been increased in real terms for 25 years – is long overdue, so that people can meet
basic living costs and search for employment.19

In 2019, the government’s Expert Panel on Future Employment Services recommended
major changes to the way employment services are regulated and funded, to reduce
pointless compliance and make room for more intensive assistance for people who
have been unemployed for longer periods of time. The government is now trialling a
new employment services model in two regions over the next two years.20

ACOSS and Jobs Australia welcomed the Panel’s report and urges the government to
implement its recommendations in full and in spirit.

Faces of Unemployment 2020                | 10 |
Figure 2: Profile of long-term NSA/YA recipients in April 2018
Sources: Department of Human Services administrative data (DSS Blue Book dataset), produced in April 2018; Australian
Bureau of Statistics (2018), Australian Demographic Statistics, December 2017
| 11 |Part 1: Who receives unemployment payments? What are unemployment payments? The main unemployment payments are Newstart Allowance or NSA (for those over 21 years of age) and Youth Allowance or YA (for young people who are unemployed, as distinct from fulltime students). As of March 20, 2020, Newstart Allowance has officially been renamed “JobSeeker Payment”, but for the purposes of this publication it will be referred to as NSA. In September 2019, there were 756,557 people receiving NSA or YA.21 There is considerable overlap between that group and the 715,600 people classified by the Australian Bureau of Statistics as unemployed in August 2019, though they are not the same group.22 NSA and YA have become the default payments for people of working age (18-64 years) with low incomes, as more people are required to seek paid work as a condition of benefit. Since 2007, a growing number of sole parents with school-age children and people with disabilities, who previously would have received pension payments (Parenting Payment or Disability Support Pension) have been placed on NSA or YA instead. Many people who are at least temporarily unable to seek employment (for example through illness also receive these payments.23 At $284 a week ($231 for a young person living away from their parents) these payments are well below poverty levels.24 A single adult on NSA would more than double their disposable income if they found a fulltime job at the minimum wage.25 Out of the overall social security budget, just 8.4% was estimated to be spent on unemployment payments in 2018-9.26 Who receives unemployment payments? It’s not who many people think The media presents stereotypical images of people receiving these social security payments. Here we reveal the facts. More people who are unemployed are middle to mature aged (41% of recipients aged 25-44 and 48% over 45) than most people think (Figure 1). Many have dependent children (11% are sole parents, while others are partnered with children). Many find it harder to secure a job because they belong to a group that’s often discriminated against in employment, including 12% of Aboriginal and Torres Strait Islander background, 21% from culturally and linguistically diverse backgrounds and 41% with a disability (partial work capacity – for more details see box on page 19). Faces of Unemployment 2020 | 12 |
| 13 |
More than half of people on unemployment payments are unemployed
long-term
High rates of long-term unemployment are becoming entrenched. In September 2019,
497,250 people (64% of recipients) had received unemployment payments for more
than a year, similar to the 62% in 2016 but well above the less than 40% rate in the early
1990s (Figure 3). Of deep concern, in September 2019, 46% had received unemployment
payments for over two years and 20% for more than five years.27

Figure 3: Trends in the share of long-term NSA/YA recipients (2007-19)

Source: Department of Social Services (various years), Statistical summary of social security payments, Department
of Social Services (2019), DSS Demographics, September 2019. Available at http://data.gov.au

The longer people are unemployed, the more their paid work prospects
diminish
Among recipients of NSA and YA in 2015, the average probability of being off benefits
12 months later (in 2016) was just over 50% for those unemployed for less than 3
months, compared with 30% for those unemployed for 12 to 24 months, and just over
10% for those unemployed for more than 5 years28 (Figure 4).

Faces of Unemployment 2020                            | 14 |
Figure 4: The chances of leaving unemployment payments diminish over time

Source: McGurk E (2016), Analysis of long-term unemployed income support recipients, Long-Term Unemployed
Conference, Brisbane December 2016.

Long-term unemployment has many causes
Long-term unemployment itself puts people at a disadvantage as they lack recent
work experience and references, and employers often use this to screen them out of
job interviews.29

The reasons for long-term unemployment are diverse. Those affected are also more
likely to belong to groups who struggle to secure paid work. Among all long-term
unemployment payment recipients in September 2017:

•   49% were aged over 45 years;
•   29% had disabilities;
•   16% were principal carers of children, including sole parents;
•   11% identified as being of Aboriginal and Torres Strait Islander background;
•   21% were from culturally and linguistically diverse backgrounds; and
•   29% lived outside metropolitan areas.

                                                  | 15 |
Faces of Unemployment 2020 | 16 |
Australia has failed to make serious inroads into long-term
unemployment for 3 main reasons
There are three main reasons Australia has been unable to reduce long-term reliance
on unemployment payments.

First, the profile of recipients of these payments has become more disadvantaged.

One reason for this is as unemployment falls (it is much lower than it was after the
recession in 1991), those who are less disadvantaged in the labour market find jobs
more quickly, leaving behind the more disadvantaged groups.

Another reason, as discussed, is the growing share of unemployment payment recipients
who would previously have received pension payments: people with disabilities and
sole parents with school age children. The welfare ‘reforms’ of the mid 2000s and
2010s were designed to boost paid workforce participation, but in many cases they
simply shifted people from higher to lower social security payments (Figure 5).30

Figure 5: The percentage of recipients of NSA and YA who are sole parents or people
with disabilities has risen as more were diverted from pension payments

Source: Department of Social Services (various years), Statistical summary of social security payments; Department
of Social Services (2019), DSS Demographics, September 2019 Available at http://data.gov.au

*NOTE: Prior to June 2019, statistics for recipients with a partial capacity to work included only those who had a work
capacity assessment completed within the last two years. Subsequent data (including data in the above graph back
to 2014) include all recipients with a work capacity of under 30 hours per week, regardless of when the assessment
was undertaken.

                                                        | 17 |
Second, as discussed later, Australia under-invests in employment services for people who struggle to secure paid employment. Third, the labour market has changed so that jobs that were previously available to people with similar characteristics to today’s recipients of unemployment payments (especially those with lower qualifications) are harder to get, and harder to keep. We turn to this issue next. Faces of Unemployment 2020 | 18 |
People with disabilities: How do they fare in
the labour market and social security system?
Only half (48%) of people of working age with disabilities are employed, compared
with 80% of those without a disability (Figure 6).

Over the past decade and a half, more people with disabilities have moved onto NSA
and YA as governments have restricted access to Disability Support Pension (DSP) (as
we saw from Figure 5).

‘Welfare to Work’ policies introduced in 2007 diverted around 20,000 people with
‘partial work capacity’ (assessed capacity to undertake paid work for 15 to 30 hours a
week) disabilities each year from DSP to NSA or YA. Then in 2010, stricter impairment
tables and related changes made it harder to successfully claim DSP. This particularly
affected older people (Figure 7).31

               Figure 6: Labour force status of people with disabilities (2018)

Source: ABS (2018), Survey of disability, ageing and carers.

                                                        | 19 |
Figure 7: Proportion of people receiving DSP and NSA, by age Source: Coates B & Nolan J (2020), ‘Balancing act – managing the trade-offs in retirement incomes policy’ Grattan Institute: Melbourne. In June 2019, 307,000 people - 41% of all people on Newstart or Youth Allowance (other) - had a ‘partial work capacity’ (assessed as able to work less than 30 hours a week).32 This is around 100,000 higher than would have been reported by the Department of Social Services prior to 2019, following a change in the way the number of people with partial work capacity is calculated.33 Their main impairments were psychological (42%) and musculo-skeletal (31%) (Figure 8). In June 2019, 34,000 were from Aboriginal and Torres Strait Islander backgrounds.34 Apart from 53,000 people with partial work capacity who are exempt from activity requirements, most are required to join either the jobactive or Disability Employment Services (DES) program. The DES program is designed for people with more severe impairments.35 Faces of Unemployment 2020 | 20 |
Figure 8: Main impairments of people with partial work capacity on Newstart or
Youth Allowance
Source: Senate Community Affairs Committee (2020), Response to Estimates Question 867.
In 2018, just under a third of participants in these programs who have disabilities secured
employment (Table 1). This is much less than the 49% of all jobactive participants (with
and without disabilities) who were employed three months after participating in the
program.36
Table 1: Employment outcomes for people with disabilities in jobactive and DES
(% in December 2018)
Labour
Employed Employed Employed Not in the
market Unemployed
full-time part-time total labour force
status
Disability 5.8 23.7 29.5 42.4 28.1
jobactive * 10.9 19.5 30.5 40.4 29.1
* outcomes for job seekers in DES refers to status at December 2018; outcomes for jobactive refers to participants in
the 12 months to December 2018, with outcomes measured around three months later.
Source: Department of Education, Skills and Employment (2020), Employment Services Outcomes Report (April
2018-March 2019).
Note: DES and jobactive outcomes are not strictly comparable as DES assists people with more severe disabilities,
and outcomes are measured in a different way.
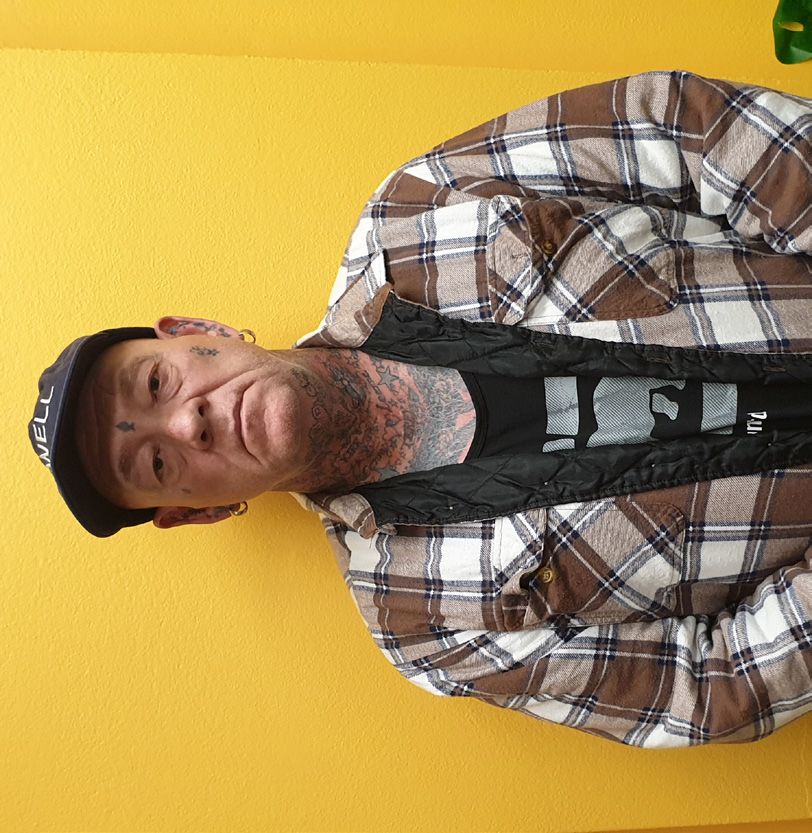
| 21 |Dylan’s story Dylan* is 28 years old and resides in Launceston. His only employment has been as an assistant within his father’s small business, with the rest of his time spent completing voluntary work. Dylan lives with a learning disability which has made it a challenge to gain suitable and ongoing employment, leaving him in search of employment for the past 11 years. Dylan enjoyed the sense of purpose that came from being employed, but when the family business closed, his journey into extreme long-term unemployment began. Since then, Dylan estimates that he has applied for over 2,000 jobs in his city, with applications often having to be made to the same employers on numerous occasions. He prefers to work outdoors, so his applications have mostly been for labouring roles found through SEEK and jobactive. Dylan has found the selection process to be very competitive in this industry and often he does not receive any feedback. Due to being unable to find employment, he has been living off the Newstart Allowance, recently rebranded as the JobSeeker Payment, which he says is not enough to live on. He noted that he is very fortunate to still be able to live with his parents, as he would find it very difficult to manage living by himself. Dylan was transferred to CVGT Australia after spending three years with another jobactive provider and achieving no employment outcomes. After helping Dylan improve his level of self-confidence and building a trusting rapport, his CVGT jobactive career coach learnt more about his background and found that Dylan had always struggled with learning and craved more independence. The coach perceived that Dylan may be better suited to receive assistance from Disability Employment Services (DES), so organised a Wechsler Adult Intelligence Scale (WAIS) test for Dylan to provide evidence to support a DES referral. The report determined that Dylan was indeed living with a recognised learning disability, so the coach liaised with Centrelink, to organise an Employment Services Assessment (ESAt) to be undertaken to further support a DES referral. The result of the ESAt recommended a referral to DES and for the Disability Support Pension. As Dylan still wanted to work, however, a transfer from CVGT jobactive to CVGT DES was initiated. The CVGT DES team worked closely to find an employer who would be a positive role model and provide suitable support for Dylan. An opportunity arose from a long-term business relationship between CVGT and an employer, who agreed to have Dylan take part in a work trial. After a successful trial, Dylan then received an employment offer and has commenced employment as a manufacturing labourer. To help more extremely long-term unemployed people, like Dylan, into employment, CVGT recommends improvements to the assessment and reassessment process to ensure jobactive participants are streamed quickly into the right type and level of service. Needed improvements include increasing the availability of ESAts to reduce waiting times, and increasing the ability of jobactive providers to more quickly book job seekers previously assessed as less disadvantaged for an ESAt, as the current arrangements take a long time or sometimes not at all. Allowing providers to complete a reassessment from the first appointment, rather than waiting six months, would also allow staff to gauge and manage the need for further assessment. Together these recommendations would assist in speeding up referrals to DES and give people faster access to a program, and assistance that better meets their needs. *Name has been changed for privacy reasons. Faces of Unemployment 2020 | 22 |
Part 2: What jobs are available to
unemployed people?

The roller coaster ride of unemployment and underemployment
In January 2020 there were 709,600 people unemployed (5.2% of the labour force)
according to the Australian Bureau of Statistics (ABS). Another 1,154,700 (8.5% of the
labour force) were underemployed, that is, employed part-time and seeking more paid
hours.37

Since the Global Financial Crisis (GFC) of 2008, unemployment has peaked twice (at
6.1% in February 2009 and 6.9% in February 2014), declined to 5.0% in November 2018,
but recently rose to 5.2% in May 2019 and has since remained at around that level.

Another feature of this cycle of down-turn and recovery was growth in underemployment.
The underemployment rate rose from 5.9% of the labour force in November 2008 to
8.5% in January 2020.

Figure 9: Trends in unemployment, underemployment, and youth unemployment (%
of labour force, 2007-19

Source: ABS (2020), Labour Force, Australia, Detailed, Quarterly, 6291.0.55.00

                                                       | 23 |
Figure 9 shows the swings and roundabouts of annual growth in unemployment, youth unemployment, and underemployment since 2007, the year before the GFC. While youth unemployment rates are usually higher than adult rates, it is clear that since the GFC, young people and sole parents have fared relatively poorly.38 Employment growth picked up during 2017, but recently declined In January 2020, the share of people of working age (15–64 years) in jobs (73.8 %) was slightly higher than before the GFC (72.9% in November 2007), but over the same period the full-time share of jobs fell from 72.5% to 70.1%. Figure 10 shows that after the GFC, from 2008 to 2016, the employment rate hovered around 72% of people of working age, while the share of full-time jobs fell from 73% to 70%. Employment growth accelerated in 2017, increasing on average by 3% percent in that year. Afterwards, annual growth in employment subsided, to 1% in 2018 and 2% in 2019. The share of jobs that was fulltime was stable at around 69% to 70% over the latter period. Figure 10: Proportion of the working-age population (15-64 years) employed and share of full-time jobs Source: ABS (2020), Labour Force, Australia, Detailed, Quarterly, 6291.0.55.00 Since June 2019, there has been little growth in jobs, with 12,281,000 people employed in that month compared with 12,289,000 in January 2020. Labour market conditions are likely to deteriorate this year as a result of the bushfires and coronavirus, which are together expected to detract from growth in the economy by at least 0.7% of GDP during the first quarter of 2020. The coronavirus is likely to Faces of Unemployment 2020 | 24 |
have an extended impact in the second quarter, resulting in lower employment growth
and higher unemployment (unless a large number of workers leaves the paid labour
force to avoid illness or quarantine themselves).39

In early 2019, the unemployment rate was close to the Reserve Bank’s estimated level
of ‘full employment’, at 5.2%.40 Since then, the RBA has revised its estimate for the full
employment rate downwards to 4.5%, in light of prolonged sluggishness in wage growth.
Together with the impact of the coronavirus, this indicates that governments will have
to do much more than offer employment services in order to get unemployment down.
The recently announced ‘stimulus packages’ play an important role here and more will
need to be done.41

Slow growth in wages (now forecast by the RBA at 2.5% in 2020) suggests that it is not
as easy as the headline unemployment statistics suggest for people to find paid work,
change jobs, or secure promotions.42

Even if more jobs are available, people who are unemployed are not the only ones
searching for them, and not everyone has an equal chance of landing a job.

The number of people un- and underemployed chasing each job
vacancy has declined since 2014, but at eight people per job, it remains
higher than the pre-GFC level.
One way to measure how easy or hard it is for people to find a job is to compare the
number of people seeking employment with the number of vacancies advertised.

From November 2014 to November 2018, competition for jobs declined. The number
of job vacancies increased from 1.3% to 1.9% of the labour force, while unemployment
and underemployment together declined from 15.4% to 14.1% of the labour force. As a
result, the number of people unemployed and underemployed per vacancy declined,
from a peak of 12.2 to 7.4.

                                           | 25 |
Figure 11: Number of unemployed + underemployed people per job vacancy (2007-19) Sources: ABS, Job Vacancies, Australia, 6354.0 9; ABS, Labour Force, Australia, Detailed, Quarterly, 6291.0.55.00 Over the past year, from November 2018 to November 2019, competition for jobs intensified. Job vacancies fell from 1.9% to 1.7% of the labour force, while unemployment and underemployment together rose from 14.1% to 14.3% of the labour force. As a result, the number of unemployed and underemployed people per vacancy rose from 7.4 to 7.9 (Figure 11). However, that is not the whole story. There are other groups of people competing for these vacancies, including people already in paid work who want to change jobs and new entrants to the workforce such as education leavers and new migrants. Based on an employer survey, the Department of Education, Skills and Employment estimated that in 2018 there were an average of 19 applicants for every job.43 Competition is tougher for entry-level jobs. Earlier Department of Education, Skills, and Employment research indicated that, on average, there were around one third more applicants for each entry-level job. In some occupations the number of applicants is much higher. For example, in 2015 the Department estimated that on average there were 43 applicants for every entry-level job in retail, hospitality and construction.44 Existing workers usually stand a better chance of winning a job vacancy than people who are unemployed. So it’s harder for people who are unemployed to get a job than the headline unemployment and job vacancy figures suggest.45 Faces of Unemployment 2020 | 26 |
Figure 12: Proportion of jobs in entry-level occupations filled by student visa holders
and back-packers (2016)

 Source: Birrell B & McCloskey D (2019), Australia’s ‘jobs and growth’ strategy: pathway to a low productivity economy.
 Australian Population Research Institute, Research Report.

Another factor to consider is growth in the number of new entrants to the paid
workforce, such as school leavers and migrants. Recent years have seen very strong
growth in temporary migration, especially among international students and working
holiday-makers (backpackers), who typically work in entry-level jobs in industries such
as hospitality, retail and agriculture. Over the decade of the 2000s, growth in these
visa-holders (most of whom are young) comprised half the overall growth in the youth
labour force.46 In June 2019, there were 688,402 international students and working
holiday-makers in Australia.47 Census data from 2016 indicates that a significant share
of jobs in many entry-level occupations were filled by temporary migrants (Figure 12).

On the whole, new migrants contribute positively to growth in living standards and
the diversity of the Australian community, and have little impact (positive or negative)
on employment and wages among the resident population.48 However, when the
Productivity Commission examined this issue in 2016 it was unable to draw firm
conclusions on the specific impact of temporary migration on the availability of jobs
or rates of pay in entry-level jobs. In the wake of the 7:Eleven and Caltex scandals,
concerns were raised about the under-payment of temporary visa holders and their
vulnerability to exploitation.49 It is likely that such strong growth in the entry-level
labour force has had an impact on pay and employment opportunities in that segment
of the labour market, and this should be properly evaluated.

                                                        | 27 |
What kinds of jobs are available? The options are narrowing for people with low qualifications People who are unemployed have lower qualifications than the broader workforce. People who are unemployed are twice as likely to have not completed high school as the broader labour force. Among people who are unemployed in November 2019, 34% had less than Year 12 qualifications, compared with 14% of the overall labour force.50 The share of entry-level jobs is shrinking: People who left school early and lack post-school qualifications are falling behind in the race for jobs. In November 2019, 24.9% of all jobs were in the lowest three skill levels (labourer/sales/ machinery operators and drivers), up from 24.8% the previous month but down from 27.3% in November 2007 (Figure 13).51 Figure 13: Share of jobs in the lowest three skill levels (2007 – 2019) Source: Dept. of Jobs & Small Business (2018), Australian jobs 2019. Note: Lowest skill levels are the lowest three skill levels (labourer/sales/machinery operators and drivers), according to the Australian Standard Classification of Occupations (ASCO). The share of entry-level jobs is expected to shrink further in future. Projections of future growth in jobs by skill level from Shah and Dixon indicate that from to 2017 to 2024, the share of sales jobs is expected to fall from 9.4% of all jobs to 8.9%, for machinery operators and drivers from 6.4% to 6.2%, and for labourers from 9.5% to 9.3%.52 Faces of Unemployment 2020 | 28 |
Entry-level jobs are more likely to be part and/or casual positions

Australia has the fourth-highest rate of part-time employment in the OECD.53 In
January 2020, 29.9% of all jobs were part time (30.2% of jobs held by men and 69.8%
by women). Part-time employment is concentrated among younger and older workers.
In January 2020, 54% of all jobs for young people (aged between 15 and 24 years)
were part-time compared with 24% for those aged 25 to 44 and 28% for those aged
45 to 64 years.54

Many people prefer part-time jobs so that they can combine paid work with care or
study. However, one third of part-time workers want more paid hours.55 Among part-
time workers, men, blue-collar workers, migrants, people in entry-level occupations,
casual workers, and people who were previously unemployed are more likely to be
underemployed.56

Similarly, Australia had the second highest rate of casual employment (daily hire) in
the OECD at 25% in 2016 (27% of female employees and 23% of males).57 A significant
feature of casual employment in Australia (unlike most countries) is the pay ‘loading’
(often 25%) to compensate for lack of leave entitlements. Of all casual employees, 42%
are married, 19% are dependent students living with their parents, and 15% are living
alone or sharing housing outside the family.58

Most casual employees are entry-level workers who have been in the same job for over
a year.59

While part time and casual jobs suit many people, they often fail to lift people off
income support in a sustained way.

A major reason for the high incidence of part-time and casual jobs for people who are
unemployed is long-term changes in the structure of entry-level jobs, as employers
have divided such jobs into smaller parcels of work offered on a part-time basis when
needed. This is common practice, for example, in supermarkets.60

In 2017-18, among low-paid workers (those receiving less than two-thirds of the median
hourly wage),

•   67% of award-reliant workers and 48% of non award-reliant workers were classified
    as casuals,
•   58% of award-reliant workers and 45% of non award-reliant workers were employed
    part-time (with much overlap between these two groups).61

Figure 14 shows that the share of casual jobs is much higher than average among entry-
level occupations, including hospitality workers (79%), labourers (58%), farm workers
(55%), cleaners (45%), sales assistants (48%) and factory process workers (33%).62

                                          | 29 |
Figure 14: Share of casual and part-time jobs in entry-level occupations (2016 and 2017) Sources: ABS (2017), Characteristics of employment; Dept. of Jobs & Small Business (2018), Australian jobs 2018 Note: Many jobs are both casual and part-time. Entry-level workers are more likely to be underemployed People who are unemployed receiving Newstart and Youth Allowances are more likely to obtain part-time or casual jobs than full-time permanent jobs. During 2018-19, 49% of people who participated in jobactive employment services obtained employment (on average) three months later. Of those who found jobs, 53% obtained part-time work and 54% obtained casual jobs.63 Among those with part-time jobs, 61% were underemployed (still seeking more paid hours). Approximately half of those who obtained employment were still in employment and off income support six months later.64 Faces of Unemployment 2020 | 30 |
People’s chances of landing a job also depend on where they live.
The employment situation varies between states, territories and regions (Figure 15).
South Australia (5.7%) and Queensland/Tasmania (5.6%) had the highest unemployment
rates in November 2019; and Victoria (4%) and the ACT (2.7%) had the lowest.
Unemployment rates vary between capital cities and non-metropolitan/regional areas.
For example, it is higher in regional areas in Tasmania (6.1% compared with 5.3%) but
lower in regional areas in South Australia (5.0% compared with 6.4%) (Figure 16).

Figure 15: Unemployment by State/Territory (January 2020)

                                        | 31 |
Figure 16: Unemployment by main city and rest of state (January 2020) Note: Data for NT & ACT not available Source: ABS (2020), Labour Force, Australia, Detailed, Quarterly, 6291.0.55.00 Faces of Unemployment 2020 | 32 |
Connie’s story

 Connie* is aged 53 and lives in a village of around
 200 people, in northern NSW.
 She has been in the jobactive program for the
 past four and a half years. Prior to becoming
 unemployed, Connie worked as an unpaid carer
 for her children. She has not been able to find
 paid employment since she entered the workforce.
 Connie finds it very difficult to get by living on
 NSA.
 “There are some weeks where I can’t pay any bills.
 After paying the basics like electricity, rates and
 solar I don’t have any spending money.
 “I buy my clothes from second hand stores like Vinnies, clothes are otherwise much
 too expensive. I just have enough to pay for very basic living expenses.
 “I wish I had a job, it’s really hard financially and I also get bored.”
 Connie has limited access to transport. She has never held a drivers licence, and
 relies on public transport to travel 35km to the nearest large town. The bus only
 operates during the school term, limiting her ability to travel throughout the year.
 Connie’s jobactive provider, BEST Employment, has assisted her to improve her
 opportunities for employment through training and upskilling. Connie attended
 a Retail Foundation Course run by BEST Employment’s Disability Employment
 Services, who also paid for her transport costs to ensure she was able to attend.
 Connie enjoyed the course and was fully supported by the facilitators.
 Connie has also undertaken voluntary work with a number of organisations in
 Narrabri.
 She is currently undertaking an online Certificate III in Retail as an alternative to
 Work for the Dole, and attends BEST Employment in Narrabri each week to use a
 computer to undertake the course. She is intensively supported by her case manager
 and other staff to ensure she is able to meet the requirements of the course.
 “I do courses to try and get more qualifications. I would like to complete the White
 Card, RSA and RCG.
 “BEST Employment help keep me motivated and tell me not to give up. They help
 me understand my course. Hopefully I can get work once the course is finished.”
 Connie regularly applies for jobs, without success. She applied for five positions last
 month, and has dropped her resume to almost every store in town in the past few
 months.
 “I go to shops and give them my resume, I do this in the [nearby town] as there are
 no shops in [my village] other than a pub.
 “I would give anything a go that I was able to do. I just can’t do desk work - I can’t
 do paperwork and fill out forms.“

                                            | 33 |
Connie just wants to be given a fair go. “I am unemployed because I have never been given the opportunity to actually work.” When asked to describe her dream job, Connie says “I want to do anything, just a job, any job. I think working as a bar attendant would be great. There is a pub where I live, I could get work there one day maybe.” *Name has been changed for privacy reasons. Faces of Unemployment 2020 | 34 |
Part 3: What help do they get from
government?
Are unemployment payments enough to live on and search for jobs?
People who are unemployed and live in a low-income household receive two main
unemployment benefits: NSA and YA (unemployed).65 In January 2020, the maximum
rate for a single adult was $284 per week including Energy Supplement.66

Prior to the Government’s Coronavirus income support packages announced in March
2020, our unemployment payments were the lowest in the OECD, at least for individuals
who recently became unemployed (Figure 17).

Figure 17: Australia has the lowest unemployment payments in the OECD (payments
as a % of average fulltime wages for a single person without children in 2017)

Source: OECD Benefits and wages data base, www.oecd.org/els/benefits-and-wages-statistics.htm

Note: For a single person without children, 1 month unemployed, was receiving 2/3 of average wage, includes Rent
Assistance and income tax.

                                                     | 35 |
Research by the Social Policy Research Centre estimates that the average minimum cost of basic essentials in Australia in 2016 for a single unemployed person was $433 per week, which was $96 per week more than Newstart Allowance plus Rent Assistance for a single adult.67 It is not possible for people who are unemployed to meet basic living expenses and the extra costs for job search (such as transport fares, phone calls, appropriate clothing, and internet subscriptions) on unemployment payments. What is jobactive, and how do Australian employment services compare internationally? Jobactive is the government’s main employment service for people who are unemployed. It comprises a network of 42 for profit and not for profit service providers across Australia.68 They are funded by the Department of Education, Skills and Employment to provide employment counselling, job referrals, and training and work experience opportunities for people who are unemployed. Service providers are paid by the Department according to the number of people they assist, how disadvantaged they are in the labour market, and whether they obtain jobs lasting at least 3 months (with extra payments if the job lasts 6 or 12 months). They also have access to a modest Employment Fund to invest in help to overcome barriers to employment (such as short training courses and help with travel costs).69 The government spends $1.3 billion annually on jobactive services, an average of $1,630 per participant (around $2,200 for each person unemployed for 2 years or more).70 In 2017, overall spending on employment services and programs for people who are unemployed in Australia (at 0.24% of GDP) was less than half the OECD average level (0.52%), and the tenth-lowest of 30 OECD countries (Figure 18).71 Faces of Unemployment 2020 | 36 |
Figure 18: Australia spends less than half the OECD average on employment assistance
(2017)

Source: OECD Social expenditure data base

What are people who are unemployed required to do to receive
benefits?
Activity requirements for people who are unemployed in Australia are among the strictest
in the OECD.72 They must typically agree to a Job Plan, attend regular appointments
with their jobactive service, apply for 20 jobs each month, and for six months of each
year of unemployment participate in Work for the Dole (working for their benefits for
15 to 25 hours a week) or other compulsory activites such as part-time work, part-time
study, voluntary work, or a wage subsidy scheme.

If they do not fully comply, their benefits can be suspended, and if they repeatedly miss
employment service appointments or breach other requirements, they may lose four
weeks’ payments.

Who receives jobactive services?
In June 2019, 614,000 people were in jobactive services (1,102,000 people were in the
program at some point during 2018-19), of whom 65% were unemployed long-term.73
Most participants in jobactive received NSA or YA.

                                            | 37 |
John’s story “Don’t be ashamed to ask for help” – that’s the advice from 55 year old John*, who has completely changed his life around after two years of unemployment and a struggle with depression. A plant/diesel mechanic by trade, John had a strong work history, but following a relationship breakdown and the death of his father, he found himself sinking into a negative state of mind. “I was a bit down and out, not looking forward to things. I didn’t want to do anything for a while” Moving from Sydney to Coffs Harbour, John signed up to Centrelink for support and was connected to Disability Employment Service (DES) Provider ETC. “ETC helped me to get my confidence and self-esteem back. I worked together with Dana at ETC to outline what my goals were, what I wanted to do, what was achievable and what wasn’t. They put me through some courses, helped me with my Resume and even continued to support me after I got my job – with work clothes, boots and tools,” John said. After seeing a job through a friend for a Diesel Mechanic position with All Diesel, John quickly applied. “Feeling confident, I explained what I could do and how I could help them. I was signed up for a three month trial, but was offered a full time job only two months in,” he said. “It’s good to be part of a team again and it’s nice to have a good bunch of blokes around me – we have fun.” The Managing Director of All Diesel said that John had been a good fit for their business. “John’s knowledge is pretty wide. He has skills in fabrication, he can weld, has good mechanical skills with broad experience, so it’s really working out well for us,” Mr Buck said. His ETC DES Team Leader is proud of how far John has come. “The biggest difference that we’ve seen with John since he commenced with our services is his confidence. Initially he would call us because he wanted to hear a friendly voice, and now when we call him – he is the friendly voice. It’s beautiful to see how employment really has made a positive impact on his life” “John has also just reached his one year anniversary with All Diesel, which is a wonderful achievement. At ETC, we are all celebrating for him.” John said his life had changed completely since re-entering the workforce. Faces of Unemployment 2020 | 38 |
“I’m renting my own place now, I’m saving money, paying my bills. My self-confidence
  is back and I’m rocking it again,” he said.
  “My goals for the future are to have a good career here and go further. Get my own
  house, buy my own place. Looking to buy a new car next year. Just onward and
  upward.”
  John shares his advice for others: “Try your best, smile and be confident. Anything’s
  possible if you want it bad enough. You can’t do it on your own. Now I’m a bit older,
  it’s made me realise that you shouldn’t be ashamed to ask for help – and there’s
  plenty of people out there willing to oblige.”
  *Name has been changed for privacy reasons.

What help do people unemployed long-term get, and what are their
employment outcomes?
The main service provided in most cases is interviews with employment consultants.
Since providers have a dual role - to provide support to find a job and manage
compliance with mutual obligation requirements – these interviews deal with both..

Generally, they are interviewed every few months by their jobactive provider to check
they are searching for jobs, assess whether their needs have changed, and offer
assistance such as help with a resume, fares, and (in a minority of cases) a job referral
or short training course.

The Annual Activity is the most intensive form of assistance received, but this is also
about compliance with benefit requirements

In August 2019, of the 88,600 people engaged in the six months of compulsory ‘annual
activity’ described above (Table 2),
• 36% were in part-time employment (up from 26% in 2016-17);
• 22% were in vocational training (up from 17% in 2016-17);
• 16% were in Work for the Dole (down from 48%);
• 3% received a wage subsidy for employers to trial them for 3-6 months; and
• 1% were in voluntary work.74

Employment outcomes vary among different programs and for
different groups
During 2018-19, among people unemployed for over 12 months, 44% were in employment
3 months after participating in jobactive, compared with 45% in 2016-1775 . Consistent
with the changes in entry-level jobs discussed above, 60% of these jobs were part time
and 54% were casual (compared with 62% and 38% respectively in 2016-17). (Table 2)

In 2018-19, employment outcomes (the share of participants in paid employment three
months later) varied among these programs, from:
• 87% after a wage subsidy;
• 34% after vocational training (compared with 36% in 2017-18);
• 24% after voluntary work (compared with 32%); and
• 25% after Work for the Dole (compared with 27%).76
                                          | 39 |
Table 2: Participation and employment outcomes from jobactive and ‘annual activities’
(2017-18 and 2018-19)
Participation % employed 3 months later
2017-18 2018-19 2017-18 2018-19
Jobactive 45% 44%
participants (62% part- (60% part-
-- --
(unemployed time, 38% time, 54%
>12 months casual) casual)
Annual activity
Part-time
26% 36% -- --
employment
Wage subsidy -- 3% -- 87%
Vocational
17% 22% 36% 34%
training
Work for the
48% 16% 27% 25%
Dole
Voluntary work -- 1% 32% 24%
Other activity 9% 22% -- --
All activities 100% 100% -- --
Sources: Senate Standing Committee on Education and Employment (2020), Questions on Notice, Supplementary
Budget Estimates 2019-2020: Dept of Employment, Skills, Small and Family Business Question No. EMSQ19-001227;
ACOSS and Jobs Australia (2018), Faces of unemployment; Department of Employment, Skills, Small and Family
Business (2019), Employment Services Outcomes Report (jobactive), detailed outcome tables.
Note: ‘Annual activity’ refers to compulsory activities required in each year of unemployment after the first year.
Wage subsidies are more effective than Work for the Dole
Although the above figures are often described as the employment ‘outcomes’ of
different programs, many of these jobs would have been secured without the program.
To work out the impact of a program on people’s employment prospects, we need
to compare employment among program participants and a similar group (called a
‘control group’) who did not join the program. Evidence from the Department of Jobs
and Small Business indicates that:
• Wage subsidies are relatively effective, lifting the chances of leaving income
support 12 months after a job placement by an average of 14 percentage points;77
• Work for the Dole is relatively ineffective, increasing the chances of employment
by an average of just 2 percentage points.78
Faces of Unemployment 2020 | 40 |You can also read