FAILURE TO ACT Electric Infrastructure Investment Gaps in a Rapidly Changing Environment - ASCE
←
→
Page content transcription
If your browser does not render page correctly, please read the page content below
FAILURE TO ACT
                                                  Electric Infrastructure
                                                  Investment Gaps in a
                                                  Rapidly Changing
                                                  Environment
Report Prepared by:
EBP US, with technical analyses by Daymark Energy Advisors, for the American Society of Civil Engineers
EXECUTIVE SUMMARY.....................................................................................................1

             ABOUT THIS REPORT.......................................................................................................9

             STUDY METHDOLOGY..................................................................................................10

             INTRODUCTION............................................................................................................... 11

             INVESTMENT GAPS BY ELECTRIC INFRASTRUCTURE SEGMENT............... 15

                    Generation........................................................................................................... 15

                    Transmission......................................................................................................... 19

                    Distribution..........................................................................................................26

                    Cumulative Investments.....................................................................................29

             THE POTENTIAL INVESTMENT GAP........................................................................ 30

             ECONOMIC IMPACTS OF INVESTMENT GAPS ................................................. 32
             ON BUSINESSES AND HOUSEHOLDS

             IMPACTS TO THE U.S. ECONOMY............................................................................ 36

2   FAILURE TO ACT: Electric Infrastructure Investment Gaps in a Rapidly Changing Environment
EXECUTIVE SUMMARY

Failure to Act:
Electric Infrastructure Investment
Gaps in a Rapidly Changing
Environment

Electricity plays a key role in supporting the economy. Generation, transmission,
and distribution systems that transmit electricity must be kept in a state of good
repair to support the critical electricity needs that keep our homes, hospitals,
schools, and businesses running.
Most of the nation’s transmission and distribution lines were constructed in the
1950s and 1960s, with a 50-year life expectancy, meaning they have reached or
surpassed their intended lifespan. Aging equipment stands to impact reliability of
the electric grid – the nation’s network of transmission and distribution systems.

                                                                                     1
A RAPIDLY CHANGING ENVIRONMENT
      Since ASCE last issued its Failure to Act electricity                                                                           2. Resilience and reliability concerns are in-
      report in 2011, the energy sector has vastly trans-                                                                                creasingly driving infrastructure investment.
      formed. A combination of technology, markets,                                                                                      While weather has always been the number
      more severe storms, and policy changes at the state                                                                                one reliability threat, the number and inten-
      and federal level are driving this transformation. Key                                                                             sity of disaster events and associated costs is
      changes include:                                                                                                                   accelerating.

            1. Natural gas and renewable energy are grow-                                                                             3. The utility industry – and the economy as
               ing as a percentage of the energy portfolio                                                                               a whole – have become much more energy
               mix. In 2019, total renewable generation                                                                                  efficient, which serves as a constraint on the
               exceeded coal-fueled generation for the                                                                                   growth of electricity consumption. Demand
               first time, a trend that is expected to con-                                                                              is relatively flat and there are generally few
               tinue. However, a greater adoption of solar,                                                                              concerns about the availability of adequate
               wind, and other renewable energy sources                                                                                  amounts of electricity. Instead, forecasted
               is changing electricity consumption pat-                                                                                  shortfalls in generation are the result of re-
               terns, subsequently requiring changes to be                                                                               quirements that a certain share of the over-
               made across generation, transmission and                                                                                  all supply come from renewables.
               distribution physical structures and control
               mechanisms.

                                     WHAT IS ELECTRICITY INFRASTRUCTURE?
                                     The United States’ electric grid consists of a complex system of intercon-
                                     nected power generation, transmission, and distribution infrastructure.
    • Generation facilities transform natural gas, coal, water, solar, wind, and other sources into elec-
      tricity. There are about 10,000 generation facilities (i.e. power plants)1 in the U.S., not including
      individual units such as residential solar panels or small-scale windfarms.

    • Once generated, transmission lines transfer this electricity over long distances to distribution lines.
      There are more than 600,000 circuit miles of transmission lines, including 240,000 that are con-
      sidered high-voltage. The transmission system can be thought of as the “interstate highway” of
      electricity delivery.

    • Distribution lines provide electric power to homes and businesses. If transmission lines are the
      “highway” of the electric grid, distribution lines are the local roadways, carrying the electric power
      to its final destination. There are an estimated 5.5 million miles of local distribution lines or under-
      ground cables in the U.S.2

      _____________________________________________________________________________________________________________________________________________________________________________________________________________________
      1     EIA FAQ , https://www.eia.gov/tools/faqs/faq.php?id=65&t=2#:~:text=As%20of%20December%2031%2C%202018,than%20
            one%20type%20of%20fuel.
      2 U.S. Dept. of Energy, Dynamic Line Rating: Report to Congress June 2019 https://www.eenews.net/assets/2020/01/27/document_ew_02.pdf

2   FAILURE TO ACT: Electric Infrastructure Investment Gaps in a Rapidly Changing Environment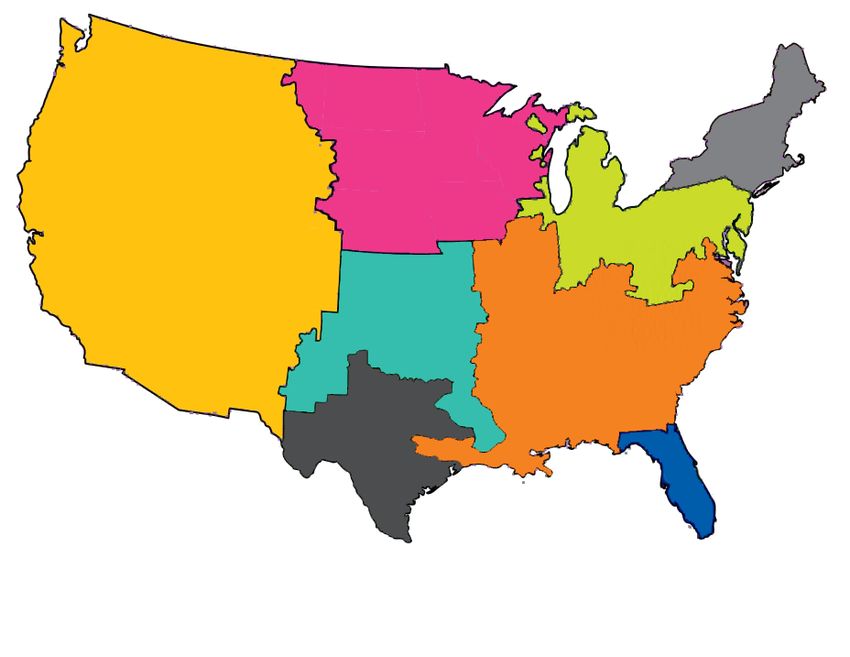
THE ELECTRICITY INFRASTRUCTURE INVESTMENT GAP
The estimated investment gap is the difference be-                a $338 billion shortfall by 2039 in what is needed to
tween projected trends of investments in electricity              ensure a reliable energy system.
generation, transmission, and distribution infrastruc-
                                                                  Driven by conversion to different energy sources to
ture with estimated total needs. The needs are based
                                                                  meet renewable portfolio standards and barring a
on household and business demand for electricity,
                                                                  significant increase of investment levels, generation
the age of current infrastructure, evolving mix of en-
                                                                  will account for 65 percent of needed investment
ergy technologies, and state and federal policies that
                                                                  by 2029. When forecasting out to 2039, the gap in
mandate conversions to renewable energy sourc-
                                                                  generation will shrink to 60 percent of the total, with
es. The total gap indicates that the U.S. is facing a
                                                                  distribution needs growing significantly to 29 percent
$208 billion (in 2019 dollars) shortfall by 2029 and
                                                                  of the overall share.

       Share of U.S. Electricity Infrastructure Investment Gap—2029 & 2039

                              12%

                                                                                    29%
                                                                                                            Generation
                                    23%
           65%                                                 61%                                          Transmission

                                                                                                            Distribution
                                                                                      10%

                       2029                                                2039

                                          Totals may not add up due to rounding

Regional Differences in the                                       Comparatively, investment gaps in Florida, the
Investment Gap                                                    Southeast, and the Southwest are the smallest. All
                                                                  of Florida’s needs are in distribution infrastructure. In
There are differences in projected investment gaps
                                                                  the Southeast, modest generation and transmission
among the nine regions of the continental U.S.
                                                                  investment are needed by 2029, and distribution will
Overall, the West with its major land expanse and
                                                                  be needed to meet increasing population and busi-
large population in California accounts for 33 per-
                                                                  ness user demand. The Southwest and Midwest re-
cent of the total national investment gap, while the
                                                                  gions will require modest investments in generation,
Northeast and Mid-Atlantic regions – with some of
                                                                  transmission, and distribution investments through
the oldest infrastructure in the U.S. – account for 43
                                                                  2039 to protect efficient electricity production and
percent of the gap. Moreover, the West, Northeast,
                                                                  consumption.
and Mid-Atlantic regions generally have some of the
more aggressive renewable energy targets, driving a
need to develop renewable generation and the trans-
mission infrastructure to support it.

                                                                                                                              3
Electricity Infrastructure Investment Gap ($2019 billions)
        Region             Generation                  Transmission                  Distribution                TOTAL

                           2020- 2030- 2020- 2020- 2030- 2020- 2020- 2030- 2020- 2020- 2030- 2020-
                           2029 2039 2039 2029 2039 2039 2029 2039 2039 2029 2039 2039

        Midwest            $2.2     $4.1      $6.3     $0.1      $0.2     $0.4       $2.1     $2.2     $4.3      $4.4     $6.6      $11.0

        Southwest          $0.6     $2.7      $3.4     $0.1      $0.3     $0.4       $2.0     $2.1     $4.1      $2.8     $5.1      $7.9

        Texas              $9.7     $13.4     $23.1    $0.6      $0.9     $1.5       $2.6     $2.8     $5.4      $12.9    $17.1     $30.0

        Northeast          $38.3    $20.9     $59.3    $5.5      $3.3     $8.8       $6.1     $6.4     $12.5     $50.0    $30.6     $80.6

        Mid-Atlantic       $25.9    $3.9      $29.9    $4.3      $0.8     $5.1       $13.9    $14.5    $28.3     $44.1    $19.1     $63.2

        West               $50.8    $22.8     $73.6    $11.5     $5.7     $17.2      $10.6    $11.1    $21.7     $72.9    $39.5     $112.5

        Southeast          $7.4     $0.0      $7.4     $2.2      $0.0     $2.2       $8.1     $8.4     $16.5     $17.7    $8.4      $26.1

        Florida            $0.0     $0.0      $0.0     $0.0      $0.0     $0.0       $3.3     $3.4     $6.7      $3.3     $3.4      $6.7

        Total              $135.0   $67.9     $202.9 $24.4       $11.1    $35.5      $48.8    $50.9    $99.6     $208.1   $129.8    $338.0

        Note: The tables above reflect the continental 48 states. An additional $830 million of distribution needs for the 2020-2039 period
                                              are estimated for Alaska ($6 Million) and Hawaii ($824).
                  Sources: Annual Energy Outplook, U.S. Energy Information Administration and electric Market Module of the
                   National Energy Modeling System. Analysis by Daymark Energy Advisors Generation Gap Analysis and EBP.

       A Failure to Act hurts businesses and                                     ures as direct financial impacts to their households
       households                                                                and businesses, as well as through larger effects on
                                                                                 the nation’s economy. The cost to residential cus-
       The impacts of investment shortfalls in electric in-
                                                                                 tomers from each electric interruption event is esti-
       frastructure are multiple and interrelated. The grid’s
                                                                                 mated at $6.68 using 2018 costs. This is about twice
       investment gap contributes to a greater incidence
                                                                                 the cost for momentary events in 2011.
       of electricity interruptions. Interruptions can be
       the result of equipment failures, capacity blackout                       Meanwhile, businesses bear the consequences of
       or brownouts, power quality irregularities, or inter-                     downtime, labor, and lost productivity when the elec-
       mittent voltage surges. Electricity interruptions can                     ticity grid fais. Outages are most damaging in the
       vary in terms of frequency and duration. Ultimately,                      manufacturing sector, costing almost $42,000 per
       however, these system failures result in an unreliable                    event on average in 2008. However, many differ-
       electricity supply, which imposes direct costs on both                    ent industries rely on data centers, and the average
       households and businesses.                                                cost of an outage at one of these facilities increased
                                                                                 from $505,000 in 2010 to $740,000 in 2016. That
       Costs incurred by both households and business-
                                                                                 equates to incurred costs of $8,851 per minute the
       es can include damage to electronics from voltage
                                                                                 electricity grid is malfunctioning. Figure 8 lists cumu-
       spikes and surges, spoiled food that would otherwise
                                                                                 lative impacts per year of data center disruptions due
       be refrigerated, and additional costs incurred by an
                                                                                 to electricity outages.
       increased reliance on, and use of, backup generators.
       Consumers experience these electricity system fail-

4   FAILURE TO ACT: Electric Infrastructure Investment Gaps in a Rapidly Changing Environment
Cumulative Impacts Per Year of Data Center Disruptions due to Outages
on Selected Industries (in $1000s)
Financial Services $994
Communications $970
Healthcare $918
eCommerce $909
Co-location
$849
Research
$807
Consumer products
$781
Industrial
$758
Retail
$648
Education
$645
Transportation
Services $570
Hospitality $514
Media $506
Public Sector $476
Source: Ponemon Institute Cost of Data Center Outages, January 2016
The impacts from costs to businesses due to ineffi- This lost disposable income is projected at $13 per
ciencies in delivery of electric power, including volt- household per year in 2020 but will grow to $563 by
age spikes and surges, lost productivity, and added 2039 if the generation, transmission, and distribution
costs incurred by an increased reliance on second- investment gaps are not mitigated
ary generators, monitoring equipment and backup
strategies, as well as direct consumer costs (such as
spoiled food), will result in lost household income.
5The following table shows the total output losses by industry sector due to underinvestment in infrastructure from
2020 to 2029 and 2030 to 2039.
Aggregated Output Losses by Industry Sector ($2019 billions)
Sector 2020-2029 2030-2039 2020-2039
Manufacturing $210 $736 $947
Health Care $27 $134 $161
Professional Services $72 $302 $374
Other Services $47 $164 $211
Logistics $45 $160 $204
Finance, Insurance and Real Estate $96 $344 $439
Construction $17 $54 $71
Retail trade $24 $82 $107
Accommodation, Food and Drinking Places $15 $53 $68
Transportation Services (excluding truck transportation) $14 $50 $64
Mining, Utilities, Agriculture $18 $63 $81
Information $39 $167 $206
Educational Services $4 $13 $17
Entertainment $5 $16 $21
Social Assistance $3 $10 $12
Totals $637 $2,347 $2,984
Columns and rows may not add due to rounding.
Note: Losses and increases reflect impacts in a given year against national baseline projections.
These measures do not indicate declines from 2019 levels.
Sources: EBP and LIFT model, University of Maryland, INFORUM Group, 2020.
Given current investment trends, capital investment ployment impacts are expected to be relatively mod-
needs, and changing trends in demand, the national est, the breadth of the impact touches many sectors
losses in employment amount to 287,000 jobs in the in the economy. The following table shows the total
year 2029 and 540,000 jobs in 2039. While em- jobs beneath the 2029 and 2039 national baseline.
6 FAILURE TO ACT: Electric Infrastructure Investment Gaps in a Rapidly Changing EnvironmentPotential Employment Losses because of inadequate
electricity infrastructure, 2029 and 2039
Sector 2029 2039
Manufacturing 36,700 61,700
Finance, Insurance and Real Estate 29,400 55,400
Professional Services 29,300 67,400
Other Services 37,800 71,600
Health Care 31,000 78,300
Construction 15,700 25,700
Information 8,100 13,900
Logistics 22,100 41,200
Retail trade 30,500 49,100
Mining, Utilities, Agriculture 7,400 12,900
Transportation Services (excluding truck transportation) 6,900 12,500
Accommodation, Food and Drinking Places 21,100 36,900
Entertainment 3,600 4,000
Educational Services 6,500 9,400
Social Assistance 1,000 300
Totals 287,200 539,800
Columns may not add due to rounding.
Note: Losses and increases reflect impacts in a given year against national projections.
These measures do not indicate declines from 2019 levels
Sources: EBP and LIFT model, University of Maryland, INFORUM Group, 2020.
Rising incidences of voltage surges, and blackouts, sequently, between 2020 and 2039, U.S. businesses
and brownouts that disrupt production add costs to will lose $271 billion in the value of its exports, while
businesses that will make U.S. manufactured prod- businesses and households will pay an additional $142
ucts less competitive in international markets. Con- billion for foreign imports.
7CONCLUSION
The electricity sector is undergoing immense trans- losses and 79 percent of gross output losses are ex-
formation and significant investments are needed to pected to occur between 2030 and 2039. Addition-
accommodate these shifts. While transmission infra- ally, job loss will roughly double in the second decade
structure has benefited from increased investment of the study – a projected 287,000 jobs will be lost
over the last 10 years, continued modernization is by 2029, compared to 540,000 jobs by 2039. By
needed to move large amounts of renewables across 2039, failing to close that investment will cost each
the grid. Across generation, transmission, and distri- American household $563 per year.
bution, the U.S. is facing a $208 billion shortfall by
Reliable electricity is essential for today’s economy
2029 and a $338 billion shortfall by 2039 in what is
and for 21st century living. By acting now to mod-
needed to ensure a reliable energy system.
ernize the infrastructure that powers our homes,
If the needs identified in this report go unaddressed, schools, hospitals, data centers, manufacturing plants
business productivity will weaken, and wages and and more, by investing in response to the evolving
household incomes will fall. The impacts of underin- mix of energy technologies, and by easing permitting,
vestment will be delayed but pronounced. About 77 impacts to American households and businesses can
percent of disposable income losses and total GDP be mitigated.
8 FAILURE TO ACT: Electric Infrastructure Investment Gaps in a Rapidly Changing EnvironmentAbout this Report
This Failure to Act report is about the electricity infrastructure that powers our na-
tion’s homes and businesses, including generation, transmission, and distribution
systems. The report provides an objective analysis of the economic implications for
continued underinvestment in infrastructure in the United States. Specifically,
the report quantifies the cost of inaction for households, industries, and the overall
economic competitiveness of the U.S. Additionally, this report touches on several
seismic changes in the energy landscape that our electric infrastructure will need
to accommodate.
OBJECTIVES AND LIMITATIONS OF THIS STUDY
The purpose of this study is to simulate the economic does not address the fuels, or combination thereof,
effects of various investment trends in America’s en- that are best suitable for the nation’s energy future,
ergy infrastructure. This report does not address the nor the costs and benefits of energy fuel security.
availability, shortages, or changing prices of energy This study is limited to the infrastructure systems
resources, nor the need or cost of exploration and that generate electricity and convey it to businesses,
extraction. It is also not intended to propose or imply institutions, and households.
prescriptive policy changes. Furthermore, the report
9ECONOMICS IN PANDEMICS: A NOTE ON COVID-19
The analysis in this report relies on baseline data that electricity are also expected to fall by 6.5 percent
predates the COVID-19 pandemic. Data sets and this year as many factories cut back production.1
economic models generally lag one to three years be- Meanwhile, payment deferral policies may lead to
hind the present, to allow for data collection, valida- temporary revenue shortfalls for utilities, possibly af-
tion, and publication. As a result, economic modeling fecting operation and maintenance. Shutdowns and
does not yet account for COVID-19’s domestic and slowdowns at manufacturing plants have interrupted
global impacts. supply chains, while stalled development could im-
pact the construction of renewable generation and
However, COVID-19 has implications for the state
associated transmission facilities.
of electricity infrastructure. With social distancing
and stay-at-home mandates, worksite demand for Up to the present time, energy infrastructure own-
electricity has declined, but household demands have ers and operators have generally delivered a reliable
increased. The U.S. Energy Information Adminis- supply of electricity in the face of shifting demand
tration’s (EIA) latest Short-Term Energy Outlook, with little impact on prices paid. They have accom-
released in May 2020, predicts that retail sales of plished this despite aging infrastructure, evolving
electricity in the commercial sector will fall modest- energy mixes, and other challenges discussed later in
ly by 6.5 percent in 2020. Industrial retail sales of this report.
STUDY METHODOLOGY
ASCE worked with an economic research team that included EBP, Daymark Energy
Advisors, and the Interindustry Forecasting Project (INFORUM) at the University of
Maryland to develop this analysis. To estimate long-term national economic impacts, the
researchers used the Long-term Interindustry Forecasting Tool (LIFT), housed at Univer-
sity of Maryland’s INFORUM Group. LIFT is a dynamic interindustry-macro (IM) model
that uses macroeconomic data to examine how changes in one industry will affect other
industries and the national economy.
The Failure to Act series analyzes two types of infrastructure needs:
1) Building new infrastructure to service increasing and shifting populations and expanded
economic activity; and
2) Maintaining or rebuilding existing infrastructure that needs repair or replacement.
The report includes projections generated for both 10-year (2029) and 20-year (2039)
time horizons. The economic modeling is based on the 2019 national economy and used
2019 dollars, thus the economic impacts of the COVID-19 pandemic are not reflected
in these projections.
___________________________________________________________________________________________________________________________________________________________________________________________________________________
1 EIA Short-Term Energy Outlook, May 12 2020
10 FAILURE TO ACT: Electric Infrastructure Investment Gaps in a Rapidly Changing Environment 10Introduction
The United States’ electric grid consists of a complex system of interconnected
power generation, transmission, and distribution infrastructure.
• Generation facilities transform natural gas, in the 1950s and 1960s, with a 50-year life expec-
coal, water, solar, wind, and other sources tancy, meaning they have reached or surpassed their
into electricity. About 10,000 genera- intended lifespan. Aging equipment stands to impact
tion facilities (i.e. power plants) are in the reliability of the electric grid – the nation’s network
U.S., not including individual units such as of transmission and distribution systems.
residential solar panels or small-scale wind-
A few key differences distinguish the energy grid
farms.2
from other infrastructure.
• Once generated, transmission lines trans-
1. Ownership: Unlike our roads and bridges,
fer this electricity over long distances to
most of our electric grid is privately-owned.
distribution lines. The electricity network
For-profit, investor-owned utilities serve 72
in the U.S. includes more than 600,000
percent of customers in the county, with
circuit miles of transmission lines, including
publicly-owned utilities and rural cooper-
240,000 that are considered high-voltage.
atives serving the rest. Privately-owned,
The transmission system can be thought of
independent power producers (IPP) also
as the “interstate highway” of electricity
interface with the grid. Federal and state
delivery.
agencies have regulation authority over
• Distribution lines provide electric power to generation and transmission systems, while
homes and businesses. If transmission lines customer rates are generally regulated by
are the “highway” of the electric grid, distri- state and local agencies.
bution lines are the local roadways, carrying
2. Technology: The energy landscape is dy-
the electric power to its final destination.
namic, and technologies evolve quickly.
An estimated 5.5 million miles of overhead
Innovation has transformed generation—
and underground distribution lines are in
including nuclear power, combustion of
the U.S.3
carbo-based fossil fuels such as coal, oil,
Electricity plays a key role in supporting the economy. diesel, and natural gas, and renewable pow-
Therefore, generation, transmission, and distribution er such as hydro, wind, solar, geothermal,
systems that transmit electricity must be kept in a or biomass. Meanwhile, behind-the-meter
state of good repair to support the critical electricity renewable generation by residential cus-
needs that keep our homes, hospitals, schools, and tomers such as household solar panels are
businesses running. However, most of the nation’s increasing.
transmission and distribution lines were constructed
___________________________________________________________________________________________________________________________________________________________________________________________________________________
2 EIA FAQ, https://www.eia.gov/tools/faqs/faq.php?id=65&t=2#:~:text=As%20of%20December%2031%2C%202018,than%20
one%20type%20of%20fuel.
3 U.S. Dept. of Energy, Dynamic Line Rating: Report to Congress June 2019 https://www.eenews.net/assets/2020/01/27/document_
ew_02.pdf
113. Renewable mandates: Increasing aware- market-based demand for renewable energy
ness and concerns about climate change are among business and residential customers.
driving states to enact mandates known as Subsequently, renewable energy generation
Renewable Portfolio Standards (RPS). An has become more affordable. The combi-
RPS requires utilities to incrementally in- nation of mandates and market demands,
crease the amount of electricity produced along with the geographical relocation of
by renewable energy, including wind, solar, generation, amplify the need to build out
biomass, and other alternatives to fossil fuel new infrastructure to support a reliable,
and nuclear electric generation. Mandated resilient, decarbonized electric grid, while
RPS along with government subsidies have maintaining our existing energy infrastruc-
increased the percentage of renewables gen- ture at a high level.
erated by utilities and have also stimulated
CHANGES IN THE ENERGY LANDSCAPE
The energy sector has vastly transformed since However, a greater adoption of solar, wind, and
ASCE last issued its Failure to Act electricity report other renewable energy sources is changing elec-
in 2011 and will continue its transformation in the tricity consumption patterns, subsequently requir-
years ahead. A combination of technology, markets, ing changes to be made across generation, trans-
and policy changes at the state and federal level are mission and distribution physical structures and
driving this transformation. control mechanisms. For example, land-based and
offshore-based wind generators require adequate
In the markets, natural gas and renewable energy are
transmission to reach distribution points. In anoth-
now competing with coal. In 2019, total renewable
er example, wind farms are being developed in the
generation exceeded coal-fueled generation for the
West as coal plants are decommissioned in the East,
first time, a trend that is expected to continue. requiring transmission to move electricity in varying
Key technological developments have helped foster volumes and different directions than previously. Dis-
a more distributed, decarbonized electric grid. Re- tributed networks may have multiple electric inputs
latedly, advancements in electricity storage, both by and outputs, requiring much more sophisticated con-
utilities and by customers, are better enabling solar trols than were needed just a decade ago.
and wind reliability. Solar and wind generation are Additionally, resilience concerns are increasingly
often variable, meaning they do not always gener- driving infrastructure investment, in both central-
ate electricity at the time and in quantities needed. ized and distributed configurations. While weather
Improvements in storage make wind and solar more has always been the number one reliability threat,
viable options within the electric markets. climate change has accelerated the number and
12 FAILURE TO ACT: Electric Infrastructure Investment Gaps in a Rapidly Changing Environmentintensity of disaster events and associated costs. Finally, the utility industry – and the economy as a
These include fires, particularly in the western U.S., whole – have become much more energy efficient,
floods, sea level rise, and severe storm events such which serves as a constraint on the growth of elec-
as Superstorm Sandy in 2012, and more recently, tricity consumption. The simplest way to measure en-
Hurricanes Irma, Harvey, and Maria in 2017; Mi- ergy use is to compare it to Gross Domestic Product
chael in 2018; and Dorian in 2019. The devastat- (GDP). A 2015 report by the American Council for an
ing 2018 California wildfire season cost the state Energy Efficient Economy explains more:
$400 billion in economic losses. NOAA estimates
From 1980 to 2014, U.S. energy use in-
that over a four-year period studied, more than $1.7
creased by 26 percent. However, over this
trillion in losses were incurred by 273 major storms,
same period, U.S. gross domestic product
fires and other natural disasters across the nation.4
(GDP) increased by 149 percent. A common
A separate U.S. Department of Energy (DOE)
approach for looking at these two variables
report estimates that power outages from weath-
together is to examine energy intensity, de-
er-related events and other causes are estimated to
fined as energy use per real dollar of GDP.
cost the United States $28 to $169 billion annually.
Energy intensity declined from 12.1 thousand
McKinsey Company published a report in 2019 that Btus per dollar in 1980 to 6.1 in 2014, a 50
examined the consequences of major events affect- percent improvement… Energy efficiency
ing 10 utilities in hurricane-prone states, the costs was an important contributor to this im-
of storm damage, and preventive measures. Using provement. However, efficiency gains were
data from the Fourth National Climate Assessment, also partly due to shifts in the U.S. economy
McKinsey developed a baseline of likely costs per away from some energy-intensive segments
utility of $1.4 billion over a 2-year period. Mean- (e.g., heavy manufacturing). Based on avail-
while, the cost of preventive actions that would able data, [estimates] conservatively [show]
minimize or avoid damages for a typical South East that about 40 percent of the improvement
utility was calculated at $700 million to $1 billion in energy intensity was due to structural
per utility.5 Many of the resilience measures, such shifts, and 60 percent was due to efficiency
as increasing storage, hardening facilities, fostering improvements. Energy efficiency savings in
distributed generation, building microgrids, and en- 2014 …sav[ed] US consumers and business-
vironmental management also serve the overall goal es about $800 billion in 2014 (based on the
of decarbonizing the electric grid. average 2014 energy price). This comes to
about $2,500 per capita.6
___________________________________________________________________________________________________________________________________________________________________________________________________________________
4 U.S. Billion-Dollar Climate Disasters 1980-2020 National Oceanic and Atmospheric Administration (NOAA), www.ncdc.noaa.gov/billions/events.pdf.
5 Why and How Utilities Should start to Mange Climate Change Risk, Sara Brody, Matt Rogers, Giilia Siccardo, McKinsey, 2019
6 Energy Efficiency in the United States: 35 Years and Counting, Steven Nadel, Neal Elliott, and Therese Langer June 2015 Report E1502.
13ABOUT THE NORTH AMERICAN ELECTRIC RELIABILITY
CORPORATION
The analysis in this report is frequently discussed in Energy Regulatory Commission (FERC), NERC’s
terms of North American Electric Reliability Corpora- objective is to ensure the reliability of the bulk power
tion (NERC) regions. North America’s interconnect- system in North America. The organization develops
ed power systems are subdivided into eight regional standards, trains and certifies personnel, and assesses
reliability organizations, which are mapped below in reliability. Assessing reliability means NERC ensures
Figure 1 and referenced in the subsequent analysis. that utilities have sufficient reserve margins to serve
A non-profit corporation designated by the Federal their customers over the next 10 years.
FIGURE 1. North American Electric Reliability Regions
NPCC
MRO
WECC
RFC
SPP
SERC
TRE
FRCC
KEY: FRCC = Florida Reliability Coordinating Council
MRO = Midwest Coordinating Organization
NPCC = Northeast Power Coordinating Council
RFC = Reliability First Corporation
SERC = Southeast Reliability Corporation
SPP = Southwest Power Pool Regional Entity
TRE = Texas Reliability Approach
WECC = Western Electricity Coordinating Council.
This is a representational map; many of the boundaries shown on this map are approximate because they are based on companies,
not on strictly geographical boundaries. December 2010. In 2019 the FRCC was incorporated as a subregion of NERC. FRCC
(Florida) is reported separately throughout this report to maintain consistency across years and for the purpose of geographical diversity.
14 FAILURE TO ACT: Electric Infrastructure Investment Gaps in a Rapidly Changing EnvironmentInvestment Gaps in
Electric Infrastructure
GENERATION
Generation infrastructure transforms natural gas, coal, water, solar, wind, and other
sources into electricity. Today, the U.S. energy grid is transitioning from a fossil-fu-
eled central generation model to a more diversified and decentralized generation
portfolio. Coal plants are rapidly retiring and being replaced mainly by combined
cycle natural-gas fuel units, a development fueled by market conditions.7 Wind and
solar energy are increasingly contributing to the overall generation mix. These transi-
tions require significant updates to our existing energy infrastructure. A longer-term
concern is whether sufficient new generation will be in place when it is needed. Our
analysis indicates there is a significant gap but the gap changes over time.
Demand Growth Is Slow ing behind the meter solar. New England currently has
3,000 MW of solar installed, which affects summer
Net generation to meet electricity needs has been
peaks, making them occur later in the day when so-
nearly flat for 20 years. That trend is expected to
lar efficiency declines. Winter demand is increasing
continue through 2050, with forecasts averaging no
in the Northeast as the electrification of appliances,
more than 1 percent growth annually.8 Recent histo-
heat pumps, and other equipment take place. Of note,
ry supports this; despite a severe economic downturn
NERC qualifies its demand forecasts as somewhat un-
in 2008 and 2009, followed by nearly a decade of
certain because of the variety of factors that impact
sustained growth of 1.6 to 2.9 percent GDP annually,
demand. Weather is the major influence and energy
electricity generation rates remained stable.9 EIA at-
efficiency is highlighted as an uncertainty factor.10
tributes stable demand to improved energy efficiency,
increased behind the meter renewable generation by Despite the projected slow demand growth, utilities
residential customers, such as household solar panels, continue to offer a variety of demand response pro-
and combined heat power (also known as cogenera- grams. These include remotely managed residential
tion). Modest increases in peak demands are expected, and business lighting and air conditioning equipment
driven by weather extremes leading to increased resi- and day-ahead capacity programs in which customers
dential and commercial air conditioning usage. voluntarily reduce energy use during an ‘event’, a pe-
riod of up to several hours coinciding with maximum
When examining demand by region, Texas (ERCOT)
demand on the utility’s system.
projects the highest demand growth at 2 percent
through 2039. New England (within NPCC) antici- Meanwhile, electric vehicles are continuing to pene-
pates declines in summer demand mainly from increas- trate the market. Demand increases due to charging
___________________________________________________________________________________________________________________________________________________________________________________________________________________
7 White House’s 2020 Annual Economic Outlook.
8 EIA Annual Energy Outlook 2020
9 Bureau of Economic Analysis, reported by https://www.thebalance.com/us-gdp-by-year-3305543
10 NERC 2019 Long Term Reliability Assessment
15electric vehicles (EV) is uncertain at this point, and Planning Reserve Margins are not a
depends upon a variety of factors, such as adoption concern through 2024
curves for passenger vehicles, medium and heavy-
duty trucks, and daily mileage. We expect utilities to A reliable electricity generation system must have
construct rates that will drive charging to non-peak more capacity resources than anticipated peak de-
hours, which will affect most passenger vehicles and light mand, to account for unanticipated outages and
duty trucks. The generation gap forecast included in higher-than-anticipated peak demand. The amount
this report considers 40 percent penetration of all that capacity resources exceed peak demand is
segments of the new vehicle market by 2040. known as the planning reserve margin. NERC is pri-
marily responsible for ensuring that planning reserve
Although managing power demand from EVs will be margins are maintained at a level sufficient to ensure
a challenge for distribution utilities, adequate electric system reliability.
capacity is expected to meet EV generation needs.
Data shows that the electric grid can accommodate NERC’s 2019 Long Term Reliability Assessment pro-
the anticipated growth in the electric vehicles, even vides required margin reserves for each region, rang-
with high EV penetration, as reported in a recent ing from 11.7 percent in the West, to 17 percent in
study completed by the U.S. Drive Grid Integration the Midwest. Though 2024, all regions except Texas
Tech Team (GITT) and Integrated Systems Analysis are expected to meet their required reserve margins.
Tech Team (ISATT).11 Texas could fall below its 13.5 percent margin to 8.5
percent in 2024. This is in line with the findings of
The main concern for many utilities is timing charging the original ASCE 2011 Failure to Act report, which
demand so that it is minimally coincident with peak found most NERC regions – with the exception of
demand hours. This can be achieved primarily through Texas – had adequate reserve capacity.
regulatory processes where rates are structured to
incentivize off-peak charging. Further, off-peak elec- The Generation Mix Is Evolving
tric sales can benefit utilities that have unused or
under-used capacity, providing new revenues from At the same time fossil fueled generation is tran-
customer EV charging. sitioning from coal to natural gas, renewables are
contributing increasing amounts to the overall gen-
Electric vehicle charging infrastructure is a key en- eration mix. From 2009 to 2019, non-hydro renew-
abler in the EV market. The number of EV charging ables such as solar and wind increased from less than
stations within the U.S. has grown from 6,900 work- 4 percent to 11 percent of the energy portfolio (see
place, public, and direct current fast chargers in 2012 Figure 2). This transition was driven in major part by
to approximately 61,000 by the end of 2017 for all advancements in renewable generation technology
vehicles.12 and manufacturing, which contribute to declining re-
newable costs. Technological impacts were enhanced
The Department of Energy’s EIA anticipates energy
by state policies aimed at reducing Greenhouse Gas
consumption will grow at a slower rate than GDP as
(GHG) emissions, including directives to reevaluate
the economy becomes more efficient and less energy
the generation mix.
intensive13. Also significant, EIA’s projections show
generation will increasingly utilize renewables and
natural gas, while coal is further reduced.
___________________________________________________________________________________________________________________________________________________________________________________________________________________
11 Grid Integration Tech Team and Integrated Systems Analysis Tech Team. “Summary Report on EVs at Scale and the U.S. Electric Power System.”
U.S. Drive: 2019 November.
12 Nicholas, Michael; Hall, Dale; Lutsey, Nic. “Quantifying the Electric Vehicle Charging Infrastructure Gap Across U.S. Markets.” The Internation-
al Council on Clean Transportation (ICCT): 2019 January. Web.
13 US EIA 2020 Annual Energy Outlook reference case https://www.eia.gov/outlooks/aeo/
16 FAILURE TO ACT: Electric Infrastructure Investment Gaps in a Rapidly Changing EnvironmentFigure 2. Fuel Sources of U.S. Electric Generation, 2009 and 2019
Petroleum & Other
Other Renewables
Hydroelectric
Nuclear
Coal
Natural Gas
0% 5% 10% 15% 20% 25% 30% 35% 40% 45% 50%
2020 2011
Source: U.S. Energy Information, 2009 and 2019
For the next 20 years or more, it appears natural gas will be the dominant fossil fuel. However, by about 2040, EIA
projects that renewables will exceed natural gas generation. Meanwhile, EIA predicts nuclear energy will decline from
24 percent of electricity generation in 2020 to 13 percent by 2040. Similarly, coal will decline from 19 percent in
2020 to 12 percent in 2040. See Figure 3.
Figure 3. Projected Mix of Generation Fuels, 2010-2050
Electricity generation from selected fuels
AEO2020 Reference Case
billion kilowatthours
2019
6,000
5,000
history projections
35%
4,000
Natural Gas
37%
3,000
38%
19%
2,000 Renewables
19%
1,000 Nuclear 12%
24% Coal 13%
0
2010 2020 2030 2040 2050
Source: EIA Annual Outlook 2020
17Renewable Portfolio Standards and the gigawatts (GW) of solar and 32.5 GW of wind re-
Growing Generation Gap sources are needed across the continental U.S to meet
existing renewable portfolio standards.15 Despite pro-
States began enacting Renewable Portfolio Standards jections of very modest electric demand growth, a gap
(RPS) in the late 1990s. Today, 29 states have RPS between the amount of generation available and the
mandates and another six states have voluntary goals. generation needed will emerge. Using publicly avail-
Most mandates were originally enacted to diversify able data on energy requirements from NERC and a
energy resources, but over time these statutes have variety of industry sources, we project the generation
shifted to include climate change mitigation strategies. investment gap to grow to a cumulative $203 billion
RPS renewable percentage requirements and rules by 2039. This projection assumes there will be a 40
vary greatly. Some states require just 10 percent of the percent penetration of electric vehicles, including bus-
overall generation portfolio come from renewables. In es and trucks, in the market by 2039.
many states – but not all – the renewables percentages Figure 4 shows the annual generation gap by NERC
increase annually. Other states may set a cap on the region from 2020-2039. The difference between re-
percentage of overall generation coming from renew- gions is in large part due to the presence (or absence)
ables. In the past year in particular, a number of states of Renewable Portfolio Standards requirements.
have revised RPS goals and rules, with several aiming Florida (FRCC) has no RPS in place but also reports
for 50 percent renewable components or more as early some of the highest solar activity. The actual genera-
as 2030, including New York, New Jersey, Connecti- tion gap, therefore, is minimal because Florida is in the
cut and California.14 Market penetration of renewables process of replacing much of its fossil generation with
has also been spurred by recent years by low interest renewables, even in the absence of a formal standard.
rates, tax credits, and constantly improving renewable The generation investment gap in the Western U.S.
energy economics, especially land-based wind. (WECC) and the Northeast (NPCC) comes from the
By 2039, it is estimated that approximately 45.4 need to meet expressed standards. The leveling off in-
dicates periods of stable investment needs.
Figure 4. Annual Generation Gap by NERC Region
Cumulative Generation Gap
$250,000,000
1,000s, 2020$ —— U.S.
$200,000,000 —— WECC
—— NPCC
$150,000,000 —— RFC
—— TRE
$100,000,000
—— SERC
—— MRO
$50,000,000
—— SPP
—— FRCC
$-
20
21
22
23
25
26
27
28
29
30
31
32
33
34
35
36
37
38
39
24
40
20
20
20
20
20
20
20
20
20
20
20
20
20
20
20
20
20
20
20
20
20
Sources: Annual Energy Outlook, U.S. Energy Information Administration and electric Market Module of the National Energy Modeling
System. Analysis by Daymark Energy Advisors Generation Gap Analysis, April 2020.
___________________________________________________________________________________________________________________________________________________________________________________________________________________
14 National Conference of State Legislatures, State Renewable Portfolio Standards and Goals, Retrieved on August 13, 2020 https://www.ncsl.org/
research/energy/renewable-portfolio-standards.aspx
15 NERC establishes annually revised standards, called Long Term Reliability Assessments, for the amount of generation capacity required in each
region to meet the region’s projected needs, plus a margin to ensure sufficient generation capacity in the region to accommodate typical situa-
tions such as power plant maintenance and less common situations such as the demand for air conditioning during heat waves.
18 FAILURE TO ACT: Electric Infrastructure Investment Gaps in a Rapidly Changing EnvironmentTRANSMISSION
Transmission is part of the “bulk power system,” and The three tables below are taken from the U.S. De-
is almost exclusively used for wholesale market trans- partment of Energy Annual Transmission Review
actions. Only a few very large customers access the from March 2018. As of the end of 2016, more than
transmission system directly. It is critical for moving 300,000 miles of transmission lines were in place
electricity from sources of generation, including re- throughout the U.S. Much of those lines were in the
mote renewable generation not previously tied into the smaller 100-299 KV ranges as shown in Table 1 below.
transmission network, to the distribution grid.
Table 1. Existing Transmission Mileage by NERC Region
Existing Circuit Miles
Existing Mid-
Circuit Miles Florida Midwest Northeast Atlantic Southeast Southwest Texas West
100-199 kV 3,956 21,933 13304 32,683 60,916 19,365 20,818 38,252
200-299 kV 6,203 7,501 1,612 6,862 22,828 3,224 - 38,167
330-399 kV - 8,542 5,580 13,650 3,868 6,653 14,838 10,673
400-599 kV 1,201 139 - 2,431 9,093 94 - 13,826
600-799 IN - - 190 2,201 - - - -
Source: Annual Data Review, 2018, U.S. Department of Energy
Transmission construction projects by NERC region 2021-2025 are provided in Table 2 and Table 3, re-
expected to be completed in 2020 and planned for spectively.
Table 2. Construction Projects Expected to be Completed by 2020
Circuit Miles to be Completed
Mid-
Circuit Miles Florida Midwest Northeast Atlantic Southeast Southwest Texas West
100-199 kv 132 1,892 368 534 257 189 217 387
200-299 kv 363 123 2 187 174 112 - 730
300-399 kv - 1,124 116 154 - 1,171 77 198
400-599 kv - 380 - 5 60 - - 825
600 kv+ - - - - - - - -
Source: Annual Data Review, 2018, U.S. Department of Energy
19For future planning, the Florida region has been incorporated as a subregion of the Southeast (Southeast Reliability
Corporation). With the assistance of staff from NERC, DOE and LBL, the Florida totals have been separated from
Southeast and presented to maintain consistency with the rest of this report.
Table 3. Circuit Miles Planned, 2021-2025
Mid-
Florida Midwest Northeast Atlantic Southeast Southwest Texas West
FRCC MRO NPCC RF SERC SPP-RE TRE WECC
100-199 kv 164 293 227 99 46 0 98 474
200-299 kv 278 8 -66 24 84 0 0 732
300-399 kv 0 2189 717 0 0 0 127 232
400-599 kv 150 0 0 0 0 0 0 1533
600 kv+ 0 0 0 0 0 0 0 0
Sources: Source: Annual Data Review, 2018, U.S. Department of Energy and North American Electric
Reliability Corporation (NERC). http://www.nerc.com/pa/RAPA/ESD/Pages/default.aspx
Transmission Age and Condition Continues While more recent data is not yet available, increased
to be a Concern spending was projected through 2020 before flattening
off through 2022.17 EEI’s survey of its member inves-
The age and condition of transmission components,
tor-owned utilities and stand-alone transmission com-
highlighted in ASCE’s 2011 Failure to Act report,
panies found that the surge in investment was related
continues to be a concern. Aging transmission com-
to providing access to clean energy and increasing the
ponents can contribute to higher failure rates, more
grid’s reliability, security, and resiliency. Spending also
widespread outages, and longer recovery times. Out-
reduced congestion, eased resource pricing, and helped
ages contribute to financial loses not only for a utility
to better meet current and future customer needs.18
company, but businesses and customers that rely on
this power. A 2015 Department of Energy report Under the Energy Policy Act of 2005 and FERC’s
found that 70 percent of transformers and transmis- subsequent Order 1000, FERC provided incentives
sion lines are 25 years or older, and 60 percent of for utilities to build needed transmission lines, en-
circuit brakers are 30 years or older.16 couraging more participation by merchant builders as
a means of speeding the process. Merchant Builders
Transmission investment has increased in are design/build companies that own the transmission
past 10 years they build but work cooperatively with utilities. These
entities may be better positioned to use standardized
According to Edison Electric Institute’s (EEI) 2018 An-
designs in multiple situations for example, gaining
nual Property & Plant Capital Investment Survey, annu-
economies of scale. In addition to utility incentives in
al transmission spending in the United States increased
rates, $10 billion in federal grants and matching funds
from $15.6 billion in 2012 to $22.2 billion in 2018.
was provided by the American Resource and Recovery
___________________________________________________________________________________________________________________________________________________________________________________________________________________
16 Quadrennial Technical Review 2015, U.S. Department of Energy
17 Edison Electric Institute. 2018 Financial Review: Annual report of the U.S. Investor-Owned Electric Utility Industry. https://www.eei.org/issue-
sandpolicy/Finance%20and%20Tax/Financial_Review/FinancialReview_2018.pdf at pp 52-53.
18 Ibid.
20 FAILURE TO ACT: Electric Infrastructure Investment Gaps in a Rapidly Changing EnvironmentAct (ARRA) toward transmission projects. These ac- Mid-Atlantic and Southeast Regions. Overlapping
tions spurred transmission investment that continued jurisdictions make comparisons among NERC ju-
through the past decade, which is why the projected risdictions more complex but it appears from PJM’s
gap for transmission investment is relatively small. plans that reliability and access to renewables are pri-
mary drivers of transmission investment.
The U.S. Energy Information Administration notes
that the surge in transmission investment has been While recent investment appears to be sufficient to
spread across the country. However, while all regions serve the existing system, trends suggest a near-term
have seen some growth, transmission investment has leveling off of transmission spending for typical main-
been most robust in the eleven-state region of the tenance and replacement construction.
Western Electricity Coordinating Council (WECC),
Determination of the transmission investment
and least substantial (at least when measured by dol-
funding gap considers both expected shortfalls to
lars) in the Florida Reliability Coordinating Council
meet traditional transmission investment needs, as
(FRCC), the Midwest Coordinating Organization
well as needed investment in new transmission to
(MRO) and the Southwest Power Pool Regional En-
serve renewable generation. This includes isolated
tity (SPP). WECC expansion has been guided by 10-
land-based and off-shore wind generators, as well as
and 20-year regional studies, much of which focused
necessary infrastructure to accommodate expected
on increasing renewable resources and the need for
electric contributions from two-way distributed en-
adequate access to them. Somewhat similarly, PJM
ergy networks.19
(originally standing for Pennsylvania, New Jersey and
Maryland) performs integrated planning across their Figure 5 below illustrates the primary purposes of
vast network, achieving economies of scale, although proposed transmission construction miles from 2019-
state approvals, mostly for siting, are still required for 2029. Of note, reliability concerns drive about 70
projects. PJM is the largest Regional Transmission percent of construction, while economics/congestion
Organization in the country serving 13 states and the issues and renewable integration are the second and
District of Columbia, including NERC’s Midwest, third drivers of investment.
Figure 5. Primary Motivations for Transmission Construction
Reliability
Variable Renewable Integration
Economic/Congestion
Fossil-Fired Integration
Hydro Integration
Other
Variable Renewable Integration
Source: NERC, 2019 Long Term Reliability Assessment
___________________________________________________________________________________________________________________________________________________________________________________________________________________
19 Currently distributed networks primarily receive power from the bulk transmission network and do not play in the bulk market as a generating
source. This may change as distributed generation develops further.
21Permitting Remains a Major Barrier Siting transmission on federal lands may follow a dif-
ferent path. In a legislative change under the Energy
Transmission systems are regulated at the federal Policy Act (EPA) of 2005, several federal agencies
level by FERC. However, oversight and approvals for such as Departments of Energy, Interior, Agriculture,
specific transmission construction are made by state and Commerce have a role in designating transmis-
governments in almost all instances, which means sion corridors on federal lands. In these special cases,
that proposed transmission crossing multiple state and in some extreme congestion situations, FERC
lines must be approved in each state. Where federal has a role in transmission approval.
lands are involved, additional permits may be required
from the federal agency with oversight. Financing transmission can be another barrier. Util-
ities generally find credit for capital expenditures
A recent example of the complexity of this issue readily available. However, transmission projects
is the Northern Pass proposal, intended to bring have added risk from the uncertainty of the permit-
1,090 Megawatts of Canadian hydroelectric power ting approval process. Some parties find that upfront
through New Hampshire to Massachusetts to serve permitting and approvals costs can be as high as 50
the state’s two largest utilities. Approval was required percent of project construction costs. By contrast,
from DOE to import power. The proposed routes actually constructing approved transmission usual-
(there were three possibilities) crossed national for- ly involves overhead expenses around five percent.
est and state park lands in New Hampshire. The U.S. The length and expense of approval processes is seen
Department of Interior, which manages the national as increased risks by potential transmission project
forests, approved the plan. However, residents and financers.21
conservation groups raised concerns about degrading
the environment of wild areas where the transmission Congestion and Constraints
line was proposed. As mitigation, the utilities sug-
gested downgrading the voltage to be carried to bury Transmission congestion occurs when there is insuf-
a portion of the transmission line. Further complicat- ficient transmission capacity to deliver lower-cost
ing the project were issues of eminent domain where generation resources to consumers, requiring the use
private lands were to be crossed. A fierce campaign in of higher-cost generators closer to customers. This
northern New Hampshire led to the state’s Site Eval- increases the price of electricity in congested areas,
uation Committee’s disapproval of the project. Utility as reflected in higher locational marginal prices and
appeals to the New Hampshire Supreme Court were higher electricity prices for consumers. These costs
not successful and the project was abandoned seven are significant. A 2019 analysis shows that conges-
years after its initial proposal.20 tion costs increased across the nation about 9 per-
cent from 2016 to 2017 and 22 percent from 2017 to
2018, for a total of just over $5 billion in 2019. Table
4 shows cost changes by year for each region.22
___________________________________________________________________________________________________________________________________________________________________________________________________________________
20 Source: New Hampshire Public Radio
21 Suffering from Lack of Transmission, Rose Fulbright, Washington DC, recorded August 9, 2018, https://www.projectfinance.law/publications/suf-
fering-from-lack-of-transmission
22 Congestion Costs in RTOs, , Grid Stratefies LLC, in Watt Transmission. https://watt-transmission.org/2019/09/17/transmission-congestion-costs-
in-the-u-s-rtos/
22 FAILURE TO ACT: Electric Infrastructure Investment Gaps in a Rapidly Changing EnvironmentYou can also read