FANTASY SPORTS LEAGUE ONLINE ADVERTISING LANDSCAPE - WHATRUNSWHERE INSIGHTS & ANALYSIS
←
→
Page content transcription
If your browser does not render page correctly, please read the page content below

WhatRunsWhere Insights & Analysis:

Fantasy Sports League
  Online Advertising
      Landscape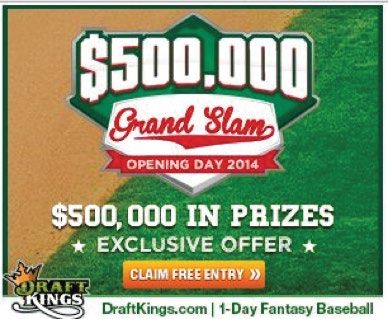
WhatRunsWhere Insights & Analysis:
   Fantasy Sports League Online Advertising Landscape

   Executive Summary                                                                                                           01

   Introduction                                                                                                                01

   Desktop                                                                                                              02 - 07
              Share of Voice                                                                                            03 - 04
              Publishers & Categories                                                                                          04
              Channel Mix                                                                                                      05
              Top Performing Ads                                                                                        06 - 07

   Mobile                                                                                                               08 - 13
        Share of Voice                                                                                                         08
        Publishers & Categories                                                                                         08 - 09
        Channel Mix                                                                                                     09 - 10
        Top Performing Ads                                                                                              11 - 12
        Devices Breakdown                                                                                               12 - 13

   Conclusion                                                                                                                  13

©WhatRunsWhere, 2014
Information and graphs contained in this report are copyright and the property of WhatRunsWhere™. The reproduction or
transmission of this report, in full or in part, and in any form or by any means is not permitted without the written express consent
of WhatRunsWhere.
Although care has been taken in the making of this report to ensure the accuracy, completeness and reliability of the content,
WhatRunsWhere assumes no responsibility in respect of errors, omissions, and generalisations. Under no circumstances will
WhatRunsWhere be liable for any direct, indirect, incidental or consequential losses due to the consequences of use of such
information.
Executive Summary
This report intends to explore the online advertising landscape of the Fantasy Sports League niche,
particularly fantasy football. It will review and compare the advertising campaigns of four key
advertisers in the industry and present a comprehensive report regarding their display media
buying strategies on desktop and mobile-web.

The research draws attention to the following:

  Advertisers in this market often utilise publishers that can be classified as ‘Sports’ or ‘News to
  drive potential users who are already interested in sports to their landing pages and websites

  Advertisers prefer the use of ad networks, in particular the Google Display Network (GDN) on
  desktop; however, on mobile direct media buys comprise 50% of all placement methodologies

  Diverse creatives placed in high volume on relevant publishers and through ad networks on
  desktop while through direct buys on mobile will likely lead to larger Share of Voice

Recommendation:

The key components of a media buying strategy in the Fantasy Sports League market include: 1)
employing a diverse array of creatives in high volume 2) through ad networks, especially GDN (on
desktop) and 3) on publishers that can be classified as ‘Sports’.

Introduction
When fall comes around, it signifies the return of many wonderful things including more pumpkin
spice lattes, trips to the apple orchard and crackling warm fires. But most of all, it marks the
beginning of a brand new football season. For Fantasy Football fans this means getting your game
face on fast, finding the right league to join and, of course, getting first pick to draft the ultimate
team.

As the excitement unfolds, domains that host fantasy leagues are also launching their online
media buying campaigns. But with so many domains placing ads, how can competitors in the
fantasy sports niche complete?

In an effort to better understand how these sites are marketing themselves online,
WhatRunsWhere has investigated the advertising performances of four major websites:
fanduel.com (Fan Duel), cbssports.com (CBS – discussed only on desktop), games.espn.go.com
(ESPN), draftkings.com (Draft Kings), and football.fantasysports.yahoo.com (Yahoo – discussed
only on mobile).

       WhatRunsWhere Insights & Analysis:
                                                                                                       01
       Fantasy Sports League Online Advertising Landscape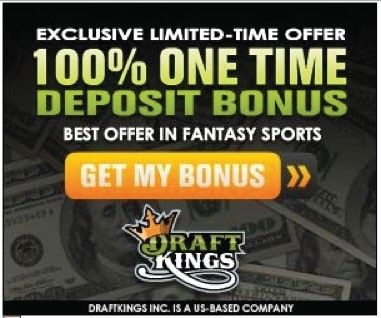
Desktop
Having collected data spanning 180 days of activity up until September 22nd, 2014 in the United
States, we have successfully tracked 400 unique ads on over 4,900 publishers across desktop,
mobile and in-app platforms (Figure 4). Overall advertisers employed more banner ads (322) than
text ads (78), a difference of 77.6% indicating image based ads are more important to visually
stimulate and attract clicks (Figure 1, Figure 2).

CBS placed the largest number of creatives (95) followed by Draft Kings and Fan Duel which both
employed the same number creatives (89), and finally ESPN (58) (Figure 3).

Although over the past 180 day period Draft Kings placed 84 total banner ads, within the first 90
days of this period they reduced this number to 67 unique creatives (Figure 4). After another 60
days this was trimmed to 48. Within the past 14 days only 27 unique creatives placed by Draft
Kings were seen, 34% less than Fan Duel in same period. Draft Kings thus narrowed the number of
creatives it utilised by 68%.

All other advertisers also reduced the number of unique creatives they employed in the past 180
days: Fan Duel trimmed its creatives by 47%, CBS Sports by 78% and ESPN by 100%.

Total Creatives Breakdown (Fig. 1)                  Creatives Percentile Breakdown (Fig. 2)
       60             9

                               ··   Desktop
                                    Mobile                 21%         ··   Banner Ads
                                                                            Text/Hybrid

                      69
      262

                                                                 79%

   Banner       Text/Hybrid

Creatives Breakdown by Advertiser (Fig. 3)

       84
                      5

                                ··    Fan Duel

                                 ··
                                      ESPN
       59
                      36
                                      CBS Sports
       41
                                      Draft Kings
                      17
       78
                      11

   Banner       Text/Hybrid

      WhatRunsWhere Insights & Analysis:
                                                                                              02
      Fantasy Sports League Online Advertising Landscape
Total Publishers Tracked (Fig. 4)

      590
                         ··   Banner Ads
                              Text/Hybrid

            4381

Total Creatives Breakdown (Fig. 5)
100
                                                                     Fan Duel
80                                                                   ESPN
                                                                     CBS Sports
60
                                                                     Drafts Kings
40

20

  0
      180 Days     90 Days    60 Days   30 Days   14 Days   7 Days

Share of Voice
Share of Voice (SOV) is a value given to each company derived from its presence across its industry
specific competitive display advertising landscape. The higher the Share of Voice value, the
"louder" the advertiser's "voice" is among competitors in the same industry, as determined by the
parameters of the report.

Among the four advertisers examined in this study, research reveals that CBS sports possesses the
largest SOV (55%), followed by Draft Kings (19%), then ESPN (18%) and finally Fan Duel (8%)
(Figure 6). While it can be posited that CBS has a large SOV due to the high volume of creatives it
has utilised, this hypothesis does not hold when we consider Fan Duel’s strategy. After all Fan Duel
placed a similarly large number of creatives, yet only has a SOV of 8%.Thus possession of a large
SOV is a combination of multiple factors including, but not limited to, employment of a high
volume of unique creatives.

       WhatRunsWhere Insights & Analysis:
                                                                                                 03
       Fantasy Sports League Online Advertising Landscape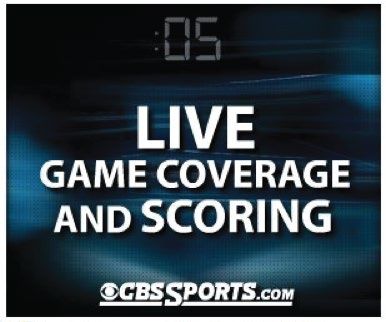
Desktop SOV (Fig. 6)
             8%
                          ··    Fan Duel

                           ··
    19%                         ESPN
                  18%
                                CBS Sports
                                Draft Kings
         55%

Publishers & Categories
As previously mentioned, it is possible that CBS was successful at rapidly reaching a wide audience
using a volume-based tactic for ad placements, but this does not necessarily mean successful
conversion. This point is underscored by the fact that Fan Duel placed a similar number of
creatives but trailed in last place SOV possession among the advertisers examined in this study.

Therefore other factors including the placement of ads on top publishers within their respective
market niche should also be considered for a successful campaign. Figure 6 displays the top ten
categories (or market niches) of the publishers on which the four competitors examined placed
their ads.

Understanding that the advertisers’ market niche is sports or entertainment related,
correspondingly the number one publisher category is ‘Sports – Other’ (Figure 7).

Top Ten Categories of Publishers* (Fig. 7)

                                          Sports - Other                              Entertainment - Other
        5%
                                          Personal Pages & Blogs                      Music
    6%
                                          News, Portal & Search                       Games
   8%                                     Streaming & Downloadable Video              Food & Drink - Other
                                          Community Forums                            Martial Arts
                        72%
                                        *Top ten categories of publishers among the four examined in this industry.

         WhatRunsWhere Insights & Analysis:
                                                                                                                  04
         Fantasy Sports League Online Advertising Landscape
Channel Mix
Analysis of these advertisers’ channel mix determines that their desktop display media buying
strategies favour the use of ad networks over direct buys: 84% of ads were placed through
networks and only 16% through direct buys (Figure 7). The overwhelming majority of network
placements (79%) were made through the GDN while 3% was completed through Adsonar and 2%
through Advertising.com (Figure 10).

When we compare the channel mix breakdown of these advertisers with their desktop SOV sizes, it
becomes clear that Fan Duel’s overuse of direct media buys may not be resulting in success
considering their comparatively small SOV size of 8% (Figure 9). For Draft King, however, majority
use of direct buys with a comparatively high volume of unique creatives placed does work. The
likeliest reason for this contradiction may lie with the category of the publishers they advertisers
are placing on.

Channel Mix (Fig. 8)                                    Channel Mix Breakdown (Fig. 9)

                        ··    Ad Network                       42.59%

                                                                                 ··    Fan Duel

                                                                                  ··
    16%                       Direct Buy
                                                                        57.39%
                                                                                       ESPN
                                                               99.33%
                                                                                       CBS Sports
                                                               99.98%
                                                                                       Draft Kings
            84%
                                                                        57.4%

                                                               42.6%

                                                         Ad Network Direct Buy

How did they place it?

  ··    Draft Kings: 42.59% ad network vs. 57.39% direct buy

   ··
        CBS Sports: 100% ad network
        ESPN: 100% ad network
        Fan Duel: 42.6 ad network vs. 57.4% direct buy

Display Placement Breakdown (Fig. 10)
   3% 2%

                        ··    Google Adwords

                         ··
                              Media Buy
  16%
                              Quigo Adsonar

                          ·
              79%             Advertising.com
                              Other

          WhatRunsWhere Insights & Analysis:
                                                                                                     05
          Fantasy Sports League Online Advertising Landscape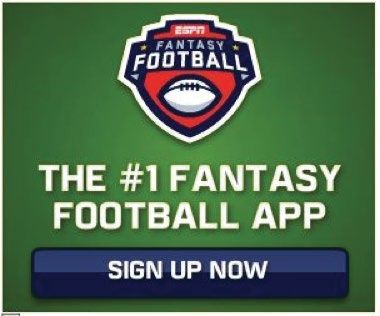
Top Performing Ads
The following is a selection of top performing desktop ads placed in the United States by the
aforementioned industry leaders.

       WhatRunsWhere Insights & Analysis:
                                                                                                06
       Fantasy Sports League Online Advertising Landscape
What do these top creative have in common?
Images:
Advertiser logo clearly located centrally or in the corners of the ad
Simple background that is related to a sport (baseball field, chalkboard etc).
Text:
Large and graphic
A lot of text and information provided succinctly
Contrasting and eye catching colours
Use of white font is common
Interactive
CTA button in contrasting colour
WhatRunsWhere Insights & Analysis:
07
Fantasy Sports League Online Advertising LandscapeMobile
Share of Voice
On the mobile-web space the SOV breakdown is quite different from desktop. Here, there is a
significant lack of data for CBS resulting in its exclusion from comparison on mobile. Yahoo was
therefore chosen for comparative purposes on mobile in its stead.
Overall, advertisers employed more banner ads (87%) than text or hybrid ads (13%) (Figure 13).
ESPN placed 38 total creatives of which 30 were banners and the remaining was text (Figure 12).
Draft Kings placed the second highest volume of unique creatives (19 banners, 1 text) while Fan
Duel and then Yahoo placed the fewest (5 and 6 banner ads, respectively).
On Mobile, ESPN is the SOV leader (39%), followed closely by Draft Kings (35%), then Fan Duel
(18%) and finally Yahoo (8%) (Figure 11).
Mobile SOV (Fig. 11) Creatives Percentile Breakdown (Fig. 12)
8%
·· Fan Duel
13%
·· Banner Ads
··
18% ESPN Text/Hybrid
Draft Kings
35%
Yahoo
39%
87%
Creatives Breakdown by Advertiser (Fig. 13)
6 1
·· Fan Duel
··
19 ESPN
Draft Kings
8
30 Yahoo
5
Banner Text/Hybrid
Publishers & Categories
A similar pattern is found on mobile with regards to the categories of the top ten publishers on
which the advertisers examined in this study have chosen to advertise on: publishers are typically
‘Sports – Other’ (36%).
WhatRunsWhere Insights & Analysis:
08
Fantasy Sports League Online Advertising Landscape‘News, Portal & Search – Other’ was the next top publisher category (18%), followed by ‘Personal
Pages & Blogs’ (15%) and then, interestingly ‘Fashion – Other’ (13%) (Figure 14*).
Top Ten Categories of Publishers - Mobile* (Fig. 14)
Sports - Other Streaming & Downloadable Video
News, Portal & Search Food & Drink - Other
5%
36% Personal Pages & Blog Games
13% Fashion - Other Coupons
Music Entertainment News & Celebrity Sites
15%
18% *Top ten categories of publishers among the four examined in this industry.
Channel Mix
On mobile, the channel mix breakdowns of the major advertisers in this niche were much more
diverse than on desktop. Within the 180 day period of tracked data, ad placements were split
50/50 between ad networks and direct buys (Figure 16). Taking up 50% of all placements indicates
that direct media buys on mobile is quite significant. Network placements were comprised of 30%
DFP Mobile, 10% AdMob, 5% Quigo Adsonar, 3% Adwords and 2% AppLovin.
Considering ESPN has the largest SOV (39%), it is possible that ad network placements are more
effective than direct buys on mobile. Yet simultaneously, Draft Kings possesses the next largest
SOV (35%) but placed the majority of its ads through direct buys (79.92%). That ESPN employed
more unique creatives, and especially more text ads, could be a major contributing factor to its
larger SOV.
Channel Mix (Fig. 15)
·· Ad Network
Direct Buy
50% 50%
60%
WhatRunsWhere Insights & Analysis:
09
Fantasy Sports League Online Advertising LandscapeChannel Mix Breakdown (Fig. 16)
48.8%
51.2%
·· Fan Duel
··
20.08% ESPN
79.92%
Draft Kings
100%
Yahoo
96.69%
Ad Network Direct Buy
How did they place it?
·· Draft Kings: 20.08% ad network vs. 72.92% direct buy
··
Yahoo: 48.8% ad network vs. 51.2% direct buy
ESPN: 100% ad network
Fan Duel: 3.31% ad network vs. 96.69% direct buy
Mobile Placement Breakdown (Fig. 17)
··
2% 3%
5%
Google Adwords
··
Media Buy
30%
Quigo Adsonar
·
50% Advertising.com
10%
Other
WhatRunsWhere Insights & Analysis:
10
Fantasy Sports League Online Advertising LandscapeTop Performing Ads
The following is a selection of top performing mobile ads placed in the United States by the
aforementioned industry leaders.
WhatRunsWhere Insights & Analysis:
11
Fantasy Sports League Online Advertising LandscapeWhat do these top creative have in common?
Images:
Logos is located in the foreground centrally or in corners, highly visible
Use of images symbolically related to sports or to fantasy goals (money, baseball
Use of a lot of green – associated with growth, money and activity
Text:
Large and graphic
Invitations are to the point
Contrasting and eye catching colours
Lots of text and information but with clean lines
Interactive
Visible and accessible CTA button
Devices Breakdown
The following shows the percentile breakdown of devices on which ads were placed on the
mobile-web space. As this data is drawn predominantly from the android market, the presence of
android devices is particularly prevalent in these figures.
Devices Breakdown (Fig. 18)
·· iPhone
··
25% 23% iPad
Android Tablet
26% 26% Android Phone
WhatRunsWhere Insights & Analysis:
12
Fantasy Sports League Online Advertising LandscapeDevices Breakdown by Advertiser (Fig. 19)
11.63% 9.3% 11.63%
·· Fan Duel
··
24.14% 50.34%
67.44% 25.52% ESPN
Draft Kings
23.21% 19.39% 26.28%
Yahoo
31.12%
30% 40% 20%
10%
iPhone iPad Android Android
Tablet Phone
Conclusion
The online advertising landscape for advertisers of fantasy sports leagues is evidently a competi-
tive field that encompasses both the desktop display and mobile web platforms.
Among the four advertisers explored in this study, research reveals that CBS sports possessed the
largest SOV (55%), followed by Draft Kings (19%), then ESPN (18%) and finally Fan Duel (8%) on
desktop (Figure 6). On mobile, CBS sports had little to no data available on the android market;
however, ESPN was found to be the SOV leader (39%), followed closely by Draft Kings (35%), Fan
Duel (18%) and finally Yahoo (8%) (Figure 11). Note however that CBS' advertising content is not
limited to just Fantasy Sports Leagues, which is the case for Fan Duel and Draft King, although in
the time frame examined there was a large volume of niche-specific ads.
With regards to these advertisers’ channel mixes, their desktop display media buying strategies
prefer ad networks over direct buys, the majority of which were completed through the GDN. On
mobile, a more diverse media buying strategy existed with 50% of all placements made through
direct buys.
While it can be postulated that CBS had a large SOV on desktop due to the high volume of
creatives it utilised, this assumption is not necessarily correct. After all Fan Duel placed a similarly
large number of creatives, but only had a SOV of 8%. Thus possession of a large SOV is a combina-
tion of multiple factors including, but not limited to, employment of high volume unique creatives.
We can therefore conclude that 1) employing a diverse array of creatives in high volume 2)
through ad networks, and 3) on publishers that can be classified as ‘sports’ are key components of
the media buying strategy of advertisers in the online fantasy sports league market, at least this is
the case for desktop. On mobile, a similar formula can be employed but with greater emphasis on
direct media buys which may lead to larger SOVs and, from there, wider audience reach.
WhatRunsWhere Insights & Analysis:
13
Fantasy Sports League Online Advertising LandscapeYou can also read