Farming in Reef catchments - Prescribed methodology for sugarcane cultivation
←
→
Page content transcription
If your browser does not render page correctly, please read the page content below

Farming in Reef catchments
Prescribed methodology for sugarcane
                           cultivation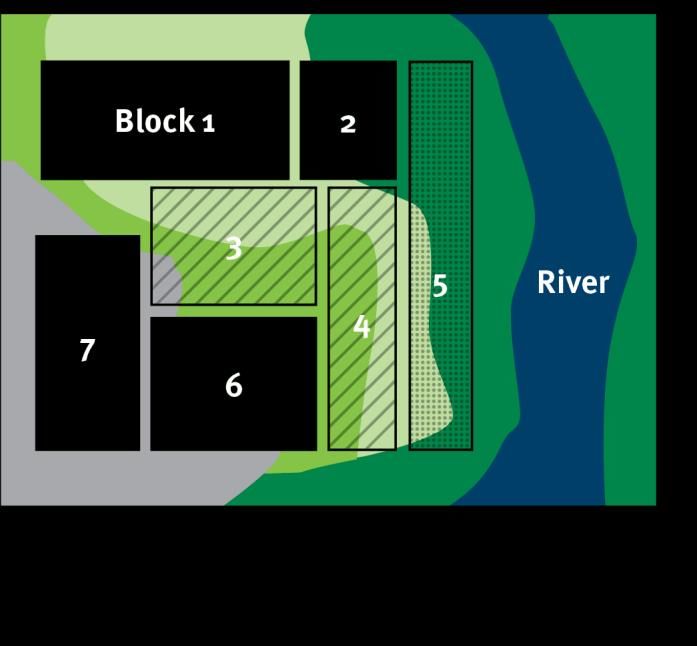
Acknowledgements
The efforts of the members of the consultation group comprising Queensland Government,
industry and research organisations are recognised for their valuable contributions in the
development of this document. Additionally, the significant contributions of the individuals who
developed the Six Easy Steps program, upon which this methodology is based, are also
acknowledged.

Prepared by:
Office of the Great Barrier Reef, Environmental Policy and Programs, Department of
Environment and Science

© State of Queensland, 2019

The Queensland Government supports and encourages the dissemination and exchange of
its information. The copyright in this publication is licensed under a Creative Commons
Attribution 4.0 Australia (CC BY) licence.

Under this licence you are free, without having to seek our permission, to use this publication
in accordance with the licence terms.

You must keep intact the copyright notice and attribute the State of Queensland as the source
of the publication.

For more information on this licence, visit
http://creativecommons.org/licenses/by/4.0/au/deed.en

Disclaimer
This document has been prepared with all due diligence and care, based on the best
available information at the time of publication. The department holds no responsibility for any
errors or omissions within this document. Any decisions made by other parties based on this
document are solely the responsibility of those parties. Information contained in this document
is from a number of sources and, as such, does not necessarily represent government or
departmental policy.

If you need to access this document in a language other than English, please call the
Translating and Interpreting Service (TIS National) on 131 450 and ask them to telephone
Library Services on +61 7 3170 5470.

This publication can be made available in an alternative format (e.g. large print or audiotape)
on request for people with vision impairment; phone +61 7 3170 5470 or email
.

Updated September 2020

                                                                                                  2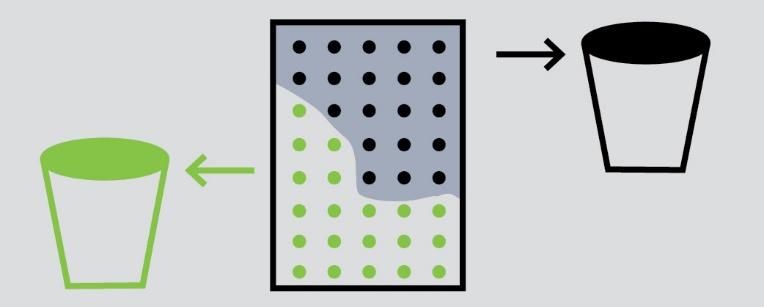
Introduction
The Environmental Protection Act 1994 requires commercial beef graziers, sugarcane
growers, banana growers, and horticulture and grain growers in the Wet Tropics, Burdekin,
Mackay Whitsunday, Fitzroy or Burnett Mary regions of the Great Barrier Reef catchment to
comply with commodity-specific minimum practice standards.
The minimum practice standards for each commodity are outlined in an Agricultural ERA
standard that is prescribed by regulation. The minimum practice standards are based on the
best available science and agricultural industry expertise to deliver significant water quality
benefits for the Reef while driving better land management practices for profitable and
productive farming.
In this document, the standards and associated regulatory provisions under the legislation are
collectively referred to as the Reef protection regulations. The purpose of the Reef protection
regulations is to protect the health of the Great Barrier Reef by reducing pollutant run-off
(nutrients, sediment and pesticides) in waterways that flow to the Reef.
This document is directly referred to in the Agricultural ERA standard for sugarcane
cultivation. This document includes:
Part A - Soil sampling and analysis method
Part B - Calculating the amount of nitrogen and phosphorus method
3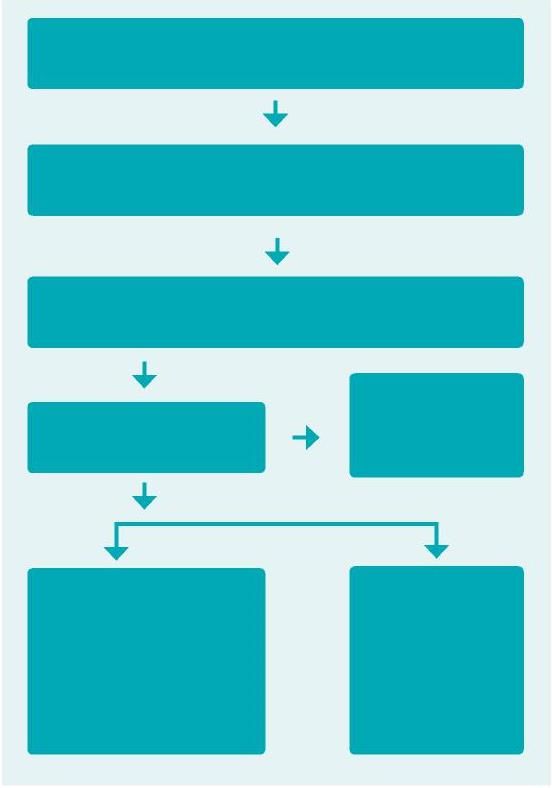
Glossary
Block: An area of land that is typically used to grow sugarcane.
Broadcast application: Means application of fertiliser across the entire surface of a block on
the agricultural property. Ground-based broadcast application is not considered to be:
surface banded application of fertiliser on the stool
aerial broadcast application of fertiliser
broadcast application of soil conditioner/s (including mill mud or mill mud/ash mix) in the
fallow, if it is incorporated into the soil during the fallow period.
Calculated Amount: The ‘calculated amount’ (commonly known as the ‘fertiliser rate’) relates
to the kilograms of nitrogen or phosphorus applied per hectare (kg/ha).
Crop cycle: For the purposes of this methodology a crop cycle is one plant and four ratoon
crops.
District Yield Potential: Means the highest average yield of sugarcane obtained across a
district over all soil types and is calculated by multiplying the estimated highest average
annual district cane yield (tonnes cane/ha) by a factor of 1.2.
Fallow: An area of land that is typically used to grow sugarcane, and that is left with either
grass/weedy cover, green manure or a leguminous crop (i.e. crop or ground cover with low or
no nitrogen demand) for a period of at least six (6) months.
Farm: For the purposes of this methodology, to determine which district yield potential to use
in the Burdekin, “farm” is an area covered by one unique farm identity number.
Farm nitrogen and phosphorus budget: Includes the farm map and any other documents
(including records, fertiliser recommendations, and soil test results) used to prepare the Farm
Nitrogen and Phosphorus Budget under the Agricultural ERA standard for sugarcane
cultivation.
Fertiliser: Means a product that contains a quantified amount, obtained by analysis, of
nitrogen and/or phosphorus.
Great Barrier Reef catchment: Has the same meaning in the Environmental Protection Act
1994. The Great Barrier Reef catchment is the area shown on a map prescribed by regulation
as the Great Barrier Reef catchment.
Mill ash: Means a by-product produced by sugar mill boilers. Also known as boiler ash.
Mill by-product: Mill mud and mud/ash mixes.
Mill mud: Means the residual mud and fibre filtered from the raw sugar juice during the sugar
refining process. Also called filter mud, filter cake or sugarcane press mud.
Phosphorus buffer index (PBI or P buffer index): A measure of the degree to which added
phosphorus is held tightly onto soil particle surfaces and is unavailable for plant uptake.
Plant crop: For the purposes of this standard means the initial sugarcane crop after planting.
Ratoon crop: For the purposes of this standard means a new crop of sugarcane that regrows
from the portion of stalk left underground after harvesting of the previous crop.
Smartcane BMP: A voluntary, industry-led program to encourage best practice.
Soil conditioner: Means a substance added to soil to improve the growing conditions for
plant roots. Examples are gypsum, lime and organic matter. For the purpose of this standard,
mill mud and mill ash are also considered soil conditioners.
Soil grouping: Where different soil types are grouped together based on colour and texture
as identified in the Six Easy Steps ‘Soil Reference Booklet’ for the particular cane district.
Soil testing: Means a test of the characteristics of soil, analysed by a National Association of
Testing Authorities (NATA) or Australasian Soil and Plant Analysis Council (ASPAC)
accredited laboratory, or one holding an equivalent certification.
4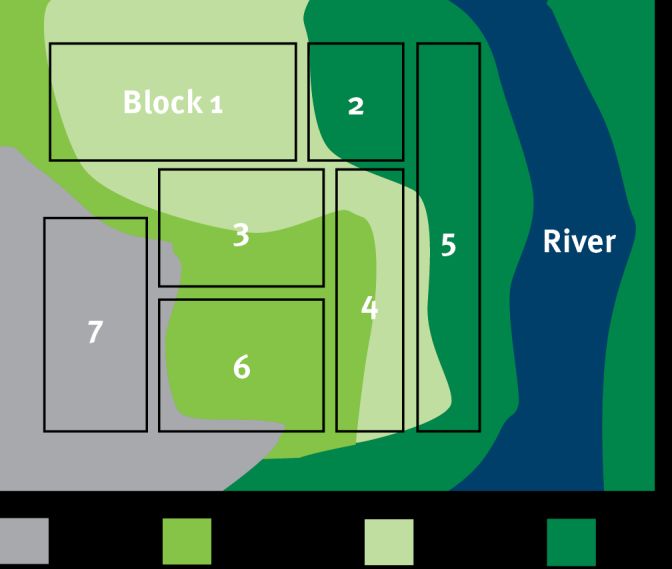
Whole-of-farm: Means the area to which the farm nitrogen and phosphorus budget applies
where:
       (a)   the activity is carried out under the day-to-day management of a single
             responsible individual, for example, a site or operations manager;
       (b)   the activity is operationally interrelated;
       (c)   the activity is, or will be, carried out at one (1) or more places;
       (d)   places where the activities are carried out are separated by distances short
             enough to make feasible the integrated day-to-day management of the
             activities;
       (e)   the activity is carried out within the same sugarcane growing district.

                                                                                            5
Part A - Soil sampling and analysis method
Contents
Purpose ........................................................................................................... 7
Regulations timeframe for commercial sugarcane growing ............................. 8
What do I need to do? ...................................................................................... 8
What needs to be tested? ................................................................................ 8
How often do soil tests need to be taken? ....................................................... 8
What do I need to prepare before soil testing? ................................................ 8
A guide to the stages of soil testing ................................................................. 9
Stage 1. Developing a soil sampling plan ...................................................... 10
Step 1.1: Obtain a soil map..................................................................... 10
Step 1.2: Identify blocks being planted with sugarcane .......................... 10
Step 1.3: Identify block management practices ...................................... 11
Step 1.4: Select representative blocks for sampling ............................... 11
Stage 2. Soil sample collection ...................................................................... 13
Step 2.1: How do I collect a soil sample? ............................................... 14
Step 2.2: Labelling the soil sample ......................................................... 14
Stage 3. Soil analysis in the laboratory .......................................................... 15
Step 3.1: Laboratory selection ................................................................ 15
Step 3.2: Send samples for analysis ....................................................... 15
Step 3.3: Record-keeping ....................................................................... 16
Stage 4. Interpretation of results .................................................................... 16
References..................................................................................................... 16
Attachments ................................................................................................... 16
Attachment 1. Guidance form: Soil sample records - information on the
representative block sampled ........................................................................ 17
Attachment 2. Guidance form: Information required for the calculation of
nitrogen fertiliser on your property ................................................................. 18
6Purpose
The purpose of this section is to describe the method for soil sampling and analysis.
If you grow sugarcane commercially in the Wet Tropics, Burdekin, Mackay Whitsunday,
Fitzroy or Burnett Mary regions of the Great Barrier Reef catchment, this method must be
used when undertaking soil testing to comply with the Reef protection regulations. You can
check if your property is in the Reef catchment by completing this online form available at
www.qld.gov.au/ReefRegulations.
The additional explanatory information in this method is intended for use by growers, and
others involved in soil testing on sugarcane growing properties. This method outlines the
standard required for soil sampling and analysis to determine nitrogen and phosphorus
nutrient requirements on commercial sugarcane growing properties.
This method also recognises the soil sampling procedures outlined in the Fertcare guide to fit
for purpose soil sampling (Gourley and Weaver 2019).
This method provides information to enable you to comply with the Reef protection
regulations for soil sampling on commercial sugarcane growing properties by:
helping you decide on the number of soil samples required to assess the fertility status
of cane blocks being planted
outlining the factors that should be considered when designing a soil sampling plan and
collecting soil samples
providing details on the required soil tests analysis methods that laboratories must
conduct
identifying the records and primary documents to be kept to meet the requirements of
the Act.
Soil testing within the 12 months prior to fertiliser being applied provides a guide to nutrient
concentrations in the soil and allows you to calculate the fertiliser rate for nitrogen and
phosphorus needed for optimum yield. Using the soil test results will let you fine-tune your
crop management, and apply nutrients at rates that meet the needs of the plants on a
particular block of sugarcane. Soil testing also highlights other nutrients that may be required
for optimum crop yield. By optimising nutrient application, there is less chance of surplus
nutrients being lost to waterways, where they can harm the environment.
This method focuses on testing for nitrogen and phosphorus, the two (2) nutrients of
environmental importance because of the risk they pose to water quality in Great Barrier Reef
coastal and marine ecosystems.
To guide nutrient management, representative surface soil samples (0–20 cm) need to be
tested to determine the organic carbon (OC), phosphorus (P) and phosphorus buffer index
(PBI) of the cane blocks being planted each season.
The organic carbon status of the soil is used to define the potential for nitrogen to mineralise
in the soil, which is then deducted from the total amount of nitrogen necessary to produce the
potential cane yield for a block.
Soil phosphorus status is used to define phosphorus fertiliser requirements according to the
Six Easy Steps guidelines developed by the BSES Limited (now known as Sugar Research
Australia). It takes into account past applications of mill by-products such as mill mud
and/or mill mud/mill ash mixtures that can provide a significant contribution of nitrogen and
phosphorus to the soil.
A companion document, Calculating the amount of nitrogen and phosphorus method,
provides details about how to make nutrient application rate calculations each season.
7Rather than sampling every plant cane block (a cane farm may have many small blocks), this
document describes how to choose particular blocks to represent the fertility status of a
number of plant cane blocks of the same soil type.
By keeping good records of soil tests and management practices, you can monitor trends in
soil fertility over time, especially the organic carbon and phosphorus status of the soil which
can assist in accurate nutrient management, improved soil health and cost savings.
What if I need help?
If you require assistance with soil testing on your farm, please contact your local
productivity services board, an agronomist or a Fertcare accredited advisor.
Regulations timeframe for commercial sugarcane growing
The Reef protection regulations apply to different regions at different times. Please refer to
the table below for when the Reef protection regulations take effect for commercial sugarcane
growing.
Commodity Region General record Minimum Farm nitrogen and
keeping practice phosphorus budget
requirements agricultural
standards
(including
this method)
Sugarcane Burdekin, 1 December 1 December 1 December 2021
Mackay 2019 2019
Whitsunday
and Wet
Tropics
Burnett Mary 1 December 1 December 1 December 2022
and Fitzroy 2019 2022
What do I need to do?
Under the Reef protection regulations, soil must be tested and analysed. The information
below outlines what needs to be tested for, how often it needs to be carried out and what
preparation needs to be conducted prior to testing.
What needs to be tested?
Soil must be tested and analysed to determine the content of:
Organic Carbon (OC) uncorrected Walkley Black (Method 6A1)
BSES (acid) extractable P (Method 9G2 or 9G1)
P buffer index (PBI) adjusted to Colwell extractable P (Method 9I2)
pH (1:5 water) (Method 4A1) if using Colwell extractable P (Method 9B1 or 9B2)
Details of the tests and methods that must be applied are provided in Step 3.1: Laboratory
selection in this document.
How often do soil tests need to be taken?
Soil must be sampled and tested, at a minimum, within the 12 months prior to fertiliser being
applied to the first crop of a crop cycle.
What do I need to prepare before soil testing?
Before you conduct a soil test, you will need to ensure you have the right tools (see Stage 2.
Soil sample collection).
8A guide to the stages of soil testing
There are four important stages in the process of soil testing, with a number of distinct steps:
9Stage 1. Developing a soil sampling plan
It is important to plan where and when samples will be taken on your property, taking into
account the:
stage in the cropping cycle
different soil types on your property
various nutrient management practices that may occur across your property
size of the property.
The design of a soil sampling plan involves selecting an area for soil sampling that
represents the fertility status of the blocks being planted on your farm that year. A single
block can represent the fertility status of a number of plant cane blocks belonging to the
same soil grouping, as identified in the Six Easy Steps ‘Soil-Specific Nutrient Management
Guidelines for Sugarcane Production’ for the particular district*.
* These ‘soil mapping units’ group soils of similar profile characteristics and landscape
position together, based on soil survey data. Such groupings are the most effective way of
condensing intensive soil survey data into larger soil groupings with similar management
requirements.
You may use the soil sampling method outlined below or refer to the Fertcare guide to fit for
purpose soil sampling (Gourley and Weaver 2019), which can be found at
www.fertilizer.org.au. The Fertcare guide provides a detailed, practical guide to sampling
soil in order to develop soil and plant nutrient recommendations.
Step 1.1: Obtain a soil map
Soil maps may be available through productivity organisations and/or professional agronomy
advisors. You can also access soil maps for your property through the Queensland Globe
(www.qldglobe.information.qld.gov.au/).
Soil map/s (Figure 1) describing the soil types and boundaries relevant to a farm are useful
references, and when combined with growers’ existing knowledge, identify the areas from
where to collect soil samples as the basis to develop a soil sampling plan.
Figure 1: A soil map of a hypothetical farm showing block boundaries (Adapted from
Schroeder et al 2007-2009).
Step 1.2: Identify blocks being planted with sugarcane
Once you have obtained a soil map you must identify all the blocks to be planted, in order to
develop your soil sampling plan. A single block can represent the fertility status of a number
of plant cane blocks belonging to the same soil grouping.
10Step 1.3: Identify block management practices
To calculate the nutrient requirement for your crop it is important to collect soil samples that
consider the management features and soil characteristics of the farm.
Using your soil map, mark the blocks that have the same soil types or proportion of soil types
and then group them using a unique identifier (i.e. cross-hatching, shading or a label). Use a
unique identifier or label for blocks that have had mill by-products applied prior to planting
cane. Blocks that received applications of mill by-products in previous cane cycles potentially
have a higher soil phosphorus status than blocks not receiving any by-products. To take
account of this, separate soil samples must be taken from blocks that represent those that
have (a) received and (b) not received previous applications of mill by-products.
Figure 2 provides an example of how to group blocks with similar soil types and management
practices (based on fertiliser application, mill by-product application, irrigation, cropping and
yield) to develop your soil sampling plan. The differing management of blocks requires
separate soil samples.
Figure 2: A soil map of a hypothetical farm grouping blocks with similar soil types and nutrient
management regimes (Adapted from Schroeder et al 2007-2009).
Step 1.4: Select representative blocks for sampling
Select representative block/s from each group of blocks with an identifier or label from which
you will collect soil samples, taking the following conditions into account.
Step 1.4.1: Sample site selection
For plant blocks with the same soil types or soil groupings, and that are farmed the same way
(based on fertiliser application, mill by-product application, irrigation, cropping and yields),
select a block of average productivity that you consider is representative of the rest of the
plant blocks in the group.
11Step 1.4.2: Soil type characteristics
Sampling blocks with one dominant soil type
For blocks with one dominant soil type, collect samples from a section of the block that best
represents the dominant soil type from that block (Figure 3) using one of the suggested
sampling patterns in Figure 6.
Figure 3: Example for sampling a block where there is one dominant soil type using minimum
standard core sample site selection. Shading indicates soil type differences. Black dots
represent the core sampling sites. Samples from these sites are combined to form one
composite sample.
Sampling blocks with an unclear dominant soil type
Sample the block using your chosen sampling pattern regardless of soil type distinctions. The
final soil sample will form a composite sample made up of a mixture of soil types from within
the sampled block (Figure 4).
Figure 4: Example for sampling a block where there is an unclear dominant soil type.
Shading indicates soil type differences. Black dots represent the core sampling sites.
Samples from these sites are combined to form one composite sample.
More comprehensive sampling where block has unclear dominant soil type
More comprehensive sampling is used to apply more precise nutrient applications, rectify
known constraints to yield or to investigate possible yield limitations etc. Sections 5 and 6 of
the Fertcare guide to fit for purpose soil sampling (Gourley and Weaver 2019) outline practical
guidance with regard to refining sampling areas based on soil type and past management
practices.
Where it is possible to apply nutrients at different rates within a block based on soil type
differences (i.e. with the use of a variable rate applicator), at least 20 soil cores should be
obtained from each soil type to form separate composite samples that represent each
individual soil type (Figure 5).
12Figure 5: Example for sampling a block where there is an unclear dominant soil type using
the more comprehensive method. Shading indicates soil type differences. Black dots
represent the core sampling sites forming composite sample 1, and green dots represent core
sampling sites forming composite sample 2.
If the more comprehensive sampling method is used and the soil analysis shows that different
rates of nitrogen and/or phosphorus are required, then these nutrients should be applied at
different rates within the block, however, if it is impractical to vary nutrients within the block,
then the most limiting nutrient requirements defined by the samples can be used to inform
fertiliser requirements.
Step 1.4.3: Sample area and pattern
For a representative block or area smaller than 15 hectares, at least 20 core soil samples
need to be taken and mixed together to form the composite sample sent for testing. For
example, if the block is 1 hectare, at least 20 core samples should be collected for the
composite sample. If the block is 5 hectares, at least 4 core samples per hectare to total 20
core soil samples should be collected for the composite sample.
To sample a representative area or block greater than 15 hectares, at least 40 core sites must
be selected in total. These 40 cores are then mixed together to form the composite sample.
For example, if the block or area is 20 hectares, at least 2-3 cores are collected per hectare
(see Figure 6 for suggested site selection patterns).
Note that the greater number of cores taken to form a composite sample, the more
reliable the analytical results for that sample will be.
Figure 6: Suggested sampling patterns within cane blocks or soil type distinctions (adapted
from Schroeder et al 2007-2009).
Stage 2. Soil sample collection
Remove all trash and organic matter from the surface before taking soil cores. If this
is not done the analysis will return an inaccurate result. Take soil cores with an auger
or soil tube from the surface of the soil to a depth of 20 centimetres. Provide a
composite sample of 500 grams and submit as soon as possible to a soil testing
laboratory.
13To take soil samples, you’ll need the following materials:
a sampling tool (free from contaminating materials, e.g. not galvanised with zinc) such as:
— a shallow probe
— a thin-walled deep soil probe
— a hydraulic/motor-driven probe/auger
— an auger (either a turning auger or a soil tube)
new plastic bags**
a clean plastic bucket** and clean gloves** for mixing cores
labels
a marker for labelling samples
a record sheet (the form in Attachment 1 can be used).
** It is important to use clean equipment to avoid contaminating your soil samples.
Step 2.1: How do I collect a soil sample?
Soil sampling should occur prior to incorporating a green cane trash blanket into the soil,
as this can affect the soil test analysis and results. Also avoid sampling headlands, poorly
drained areas and fertiliser dump sites. Areas that have been fertilised or had ameliorants
applied should not be sampled for a minimum of six months following application.
Cores of soil should be taken from the shoulder of the cane row, about midway between the
centre of the cane row and the centre of the inter-row, down to a depth of 20 cm from the
surface, using a soil sampling tool. However, where fertiliser has been applied using a side-
dress applicator (i.e., to either side of the row rather than centre of the stool) in the last six
months, cores should not be taken from the fertilised area of the shoulder.
You can refer to the Fertcare guide to fit for purpose soil sampling (Gourley and Weaver
2019), Section 6.5 “Sampling pattern for selected areas with previous fertiliser banding” for
alternative methods.
It is important to avoid collecting material such as trash or organic matter from the surface. If
using a soil tube, the tube should not be lubricated or galvanised because this can cause
inaccurate organic carbon results.
Collect all cores in a clean plastic bucket to form a composite sample.
After collecting cores in a clean bucket, thoroughly mix together those taken from the same
block or soil type distinction (depending on the use of the minimum standard or more
comprehensive sampling method) to form a composite sample (breaking large clods apart by
hand).
Step 2.2: Labelling the soil sample
Using a permanent ink marker, label the composite sample with the date, block or area
sampled and farm name/number and submit to a certified laboratory for testing (Figure 7).
Attachment 1 provides a form suitable for recording information about the block or sampled
area and submitting with the soil sample to the testing laboratory. Keep a copy of this form for
your records.
Figure 7: Soil analysed in the laboratory is a sub-sample of the composite sample collected
from the block or area (source: Schroeder et al 2004).
14The following information is required to support the calculation of the amount of nitrogen
and phosphorus application. If you are using the services of a professional fertiliser
industry advisor who is not familiar with your property, they will also need to understand
your farm management practices with respect to the application of mill by-products and
fallowing.
Mill by-products: Did you apply mill by-products to the block? State what type, when they
were applied and how much, i.e. at what rate?
Fallow management: Did you have a fallow before planting cane? Was it bare ground,
grass or a legume crop? How was it managed? How long was the fallow period?
Attachment 2 provides a form that can help you record this information.
Stage 3. Soil analysis in the laboratory
Step 3.1: Laboratory selection
Identify a suitable laboratory to undertake the following analyses using the methods specified
below. It is important that these methods are used as they are calibrated to the Six Easy
Steps program for nutrient management in the sugarcane industry.
1. Organic Carbon (OC) uncorrected Walkley Black (Method 6A1)
2. BSES (acid) extractable P (Method 9G2 or 9G1)***
3. P buffer index (PBI) adjusted to Colwell extractable P (Method 9I2)
4. pH (1:5 water) (Method 4A1) if using Colwell extractable P (Method 9B1 or 9B2)
These methods can be found in Rayment, G.E. and Lyons D.J. (2011) Soil Chemical Methods
– Australasia, CSIRO Publishing, available at the Department of Environment and Science
(DES) website www.qld.gov.au/FarminginReefCatchments.
Other tests, such as those to determine the extent of constraints and crop nutrient
requirements are encouraged for assessing the overall fertility status of the soil to develop a
balanced nutritional program.
*** Note that while the BSES (acid) extractable phosphorus soil test has been found to be
well-suited to estimating plant available phosphorus in the acidic soils that occur in much of
the Queensland sugarcane industry, investigation has found that it may overestimate
available phosphorus in neutral to alkaline soils. It is therefore recommended that growers
with neutral to alkaline soils seek professional advice in relation to the phosphorus
application on their sugarcane block/property after receiving their soil test results. Colwell
extractable phosphorus has not been calibrated in the Six Easy Steps program; it is included
in this method based on significant consultation with sugarcane agronomic experts.
Step 3.2: Send samples for analysis
Send composite samples to a suitable laboratory for nutrient analysis.
Suitable laboratories performing the chemical analysis of soil samples are required to
participate in Australasian Soil and Plant Analysis Council (ASPAC) proficiency trials and
maintain certification for the nominated methods where available.
The ASPAC website is www.aspac-australasia.com.
It is recommended that laboratories are able to demonstrate that their operations comply with
the Australian Standard AS ISO/IEC 17025-2005 ‘General requirements for the competence of
testing and calibration laboratories’ and have the technical expertise for the specified methods.
The National Association of Testing Authorities (NATA) accreditation would provide evidence
of compliance to this standard. The NATA website is www.nata.com.au.
15Step 3.3: Record-keeping
It is important to note that under the Environmental Protection Act 1994 records must be kept
of activities relating to soil testing on your sugarcane property. The following documents must
be kept as records for six years:
identification of the blocks where sampling and analysis has been undertaken (e.g. on a
farm map or other document)
identification and description of the dominant soil types covering the blocks where
samples were taken (e.g. on a farm map or other document)
soil testing and analysis results.
Records must be made within three business days and can be kept in any format.
Record keeping forms and further information is available from the Department of
Environment and Science website www.qld.gov.au/FarminginReefCatchments.
Stage 4. Interpretation of results
Soil test reports contain the analytical data from tests conducted in a laboratory using specific
method. Most laboratories offer packages of soil tests, however it is important to ensure that
the package chosen includes the analysis methods outlined above in Step 3.1.
Once you have obtained your soil test results, calculate the nutrient requirements for your
crop using the following Calculating the amount of nitrogen and phosphorus method.
You could also engage a professional fertiliser advisor to calculate the crop’s nutrient
requirements for you. You can find an advisor by contacting your local productivity
organisation, agronomy provider or fertiliser re-sellers.
References
Gourley C.J.P. and Weaver D.M. (2019), A guide for fit for purpose soil sampling, Fertilizer
Australia, Canberra, Australia.
Rayment, G.E. and Lyons, D.J. (2011), Soil Chemical Methods - Australasia, CSIRO
Publishing, Collingwood, VIC. Australia.
Schroeder, B.L., Wood, A.W., Hurney, A., Panitz, J.H. (2004), BSES Accelerating the
adoption of best practice nutrient management: Herbert District.
Schroeder, B.L., Wood, A.W., Panitz, J.H. (2007-2009), Nutrient Management Series,
Canegrowers magazine.
Attachments
If your chosen laboratory doesn’t provide form/s to record your soil sampling details, you can
complete the forms in Attachment 1 and Attachment 2 as records for the soil sampling that
has taken place on your property. Alternatively, you can provide this information in any other
format as long as you record the information included in these attachments. Whichever form
you use, ensure that you retain a copy for your records.
Additional items to keep with the records are your:
soil map showing the dominant soil types covering the blocks or management
zones where samples were taken.
map of the boundaries of blocks or management zones where:
o soil sampling has been undertaken; and
o fertiliser and mill mud/mill ash has been applied
date of soil testing and a description of the location and the dominant soil type
sampled.
16Attachment 1. Guidance form: Soil sample records - information on the
representative block sampled
In the event that the accredited laboratory doesn’t provide form/s to document your soil
sampling details, you can complete this form for each soil sample that you submit to an
accredited laboratory for testing and keep a copy for your records.
17Attachment 2. Guidance form: Information required for the calculation of
nitrogen fertiliser on your property
In the event that a laboratory doesn’t provide form/s to document your soil sampling details,
you can complete this form for each soil sample that you submit to an accredited laboratory
for testing and keep a copy for your records.
18Part B - Calculating the amount of nitrogen and phosphorus
method
Contents
Purpose ......................................................................................................... 20
Regulations timeframe for commercial sugarcane growing ........................... 20
NITROGEN .................................................................................................... 21
How do I calculate the rate of nitrogen fertiliser to apply?.............................. 21
Stage 1 - Working out the baseline nitrogen application rate ......................... 21
Step 1.1: What is the district yield potential? .......................................... 21
How do I identify my district yield potential? ........................................... 21
Step 1.2: What is the nitrogen utilisation index? ..................................... 22
How do I calculate my baseline application rate? ................................... 22
What if blocks on my farm have yields that are higher than the district
yield potential? ........................................................................................ 23
What if I am developing a Farm Nitrogen and Phosphorus Budget and my
average whole of farm yields are higher than the district yield potential?23
What if my yield is lower than the district yield potential? ....................... 24
Stage 2 - Calculating the combined nitrogen inputs to deduct from the
baseline application rate ................................................................................ 24
Step 2.1: What is the soil nitrogen mineralisation index? ........................ 24
How do I adjust my baseline nitrogen application rate using the soil
mineralisation index? .............................................................................. 24
How do I adjust my baseline application rate for ratoon crops established
before 2010 if I did not undertake soil testing prior to the plant crop?..... 26
Step 2.2: Determine the nitrogen from mill by-products .......................... 26
How do I calculate the deduction for nitrogen supplied from mill by-
products? ................................................................................................ 26
PHOSPHORUS ............................................................................................. 27
How do I calculate the rate of phosphorus fertiliser to apply? ........................ 27
Stage 1 - How do I determine the phosphorus requirements of my crop? ..... 28
Stage 2 - How do I calculate my phosphorus deduction after applying mill by-
products? ....................................................................................................... 30
Contacts ......................................................................................................... 32
References..................................................................................................... 32
19Purpose
The purpose of this document is to describe the method for calculating the amount of nitrogen
and phosphorus to be applied.
If you grow sugarcane commercially in the Wet Tropics, Burdekin, Mackay Whitsunday,
Fitzroy or Burnett Mary regions of the Great Barrier Reef catchment, this method must be
used to calculate fertiliser application rates to comply with the Reef protection regulations.
You can check if your property is in the Reef catchment by completing this online form
available at www.qld.gov.au/ReefRegulations.
The additional explanatory information in this method is intended for use by growers, and
others involved in recommending fertiliser products for agricultural properties. Applying the
correct rate of fertiliser to match crop needs plays a critical role in reducing fertiliser losses in
run-off, to the air or by leaching through the soil profile. It can also result in more efficient
uptake of fertiliser by the plant, and increased farm profitability and productivity.
The method provided in this document is derived from procedures outlined in the Six Easy
Steps program developed by BSES Limited (now Sugar Research Australia). The Six Easy
Steps program is a complete nutrient management system, based on a site-specific approach
to soil and nutrient management and is the accepted industry standard recognised in the
Smartcane BMP program, available at www.smartcane.com.au.
In order to work out the calculated amount of fertiliser to apply to your farm, soil testing
must be undertaken in accordance with the Part A - Soil sampling and analysis method, which
is described earlier in this document. Records must be kept of activities relating to the
application of fertilisers and mill by-products on your sugarcane property. Records must be
made within three (3) business days and kept for at least six (6) years. Record keeping forms
and further information are available from the Department of Environment and Science
website at www.qld.gov.au/reefregulations.
What if I need help?
If you require assistance with soil testing or working out the appropriate rates of nitrogen
and phosphorus on your farm, please contact your local productivity services board, an
agronomist or a Fertcare accredited advisor.
Regulations timeframe for commercial sugarcane growing
The Reef protection regulations apply to different regions at different times. Please refer to
the table below for when the Reef protection regulations take effect for commercial sugarcane
growing.
Commodity Region General record Minimum Farm nitrogen and
keeping practice phosphorus budget
requirements agricultural
standards
(including
this method)
Sugarcane Burdekin, 1 December 1 December 1 December 2021
Mackay 2019 2019
Whitsunday
and Wet
Tropics
Burnett Mary 1 December 1 December 1 December 2022
and Fitzroy 2019 2022
20NITROGEN
How do I calculate the rate of nitrogen fertiliser to apply?
Figure 1 below outlines the method you must use to calculate the rate of nitrogen fertiliser to
apply. The rate only considers nitrogen sourced from fertiliser and mill by-products. The
method requires the calculation of a baseline application rate, from which amounts are
deducted based on the soil organic carbon content and mill mud applications.
Figure 1: The process for determining the application rate of nitrogen on cane blocks
(Source: Schroeder (2009) unpublished).
Stage 1 - Working out the baseline nitrogen application rate
The baseline application rate is the starting amount of nitrogen needed by the crop before
deductions are made to account for the in-season mineralisation of available nitrogen from
soil organic matter identified through soil testing. The baseline application rate is calculated
by multiplying the district yield potential (refer to Table 2) by the nitrogen utilisation index
(refer to step 1.2).
Step 1.1: What is the district yield potential?
The district yield potential represents the highest average yields of sugarcane obtained
across a district over all soil types and is calculated by multiplying the estimated highest
average annual district cane yield (tonnes cane/ha) by a factor of 1.2. For example, the
highest average yield in the Tully district is 100 tonnes of cane to the hectare. This figure,
multiplied by 1.2, gives a district yield potential of 120 tonnes of cane to the hectare.
How do I identify my district yield potential?
Table 1 shows the yield potential for 12 broad districts as defined by industry from sugar mill
records. Identify the district your farm is located in from the left-hand column and find your
district yield potential in the right-hand column. Use this figure for calculating the baseline
nitrogen application rate.
21Table 1: District yield potential for the 12 districts, defined by BSES Limited (now known as
Sugar Research Australia) (Source: Schroeder et al 2007-2009; Calcino et al 2008).
District District yield potential (tonnes of cane/ha)
Mossman/Cairns 120
Innisfail/Johnstone 120
Tully 120
Herbert* 120
Mareeba/Dimbulah 150
Burdekin 150 or 180**
Proserpine 130
Mackay 130
Plane Creek 120
Districts in the Burnett To be included following consultation before commencement of
Mary and Fitzroy regions minimum practice standards on 1 December 2022
* For the purposes of district yield potential, the Herbert district also applies to cane farms in
the Black river basin.
**The Burdekin district has two yield potentials (150 and 180 tonnes of cane/ha), recognising
that some farms/blocks can attain yields above 150 tonnes of cane/ha. If verifiable yield
records or other reasonable evidence from the past fifteen years show that blocks on your
farm have produced yields higher than 150 tonnes of cane/ha in at least three (3) harvest
periods (seasons) (to the satisfaction of the administering authority), you may adopt the 180
tonnes of cane/ha yield potential figure to calculate your baseline application rate for that
farm. Otherwise, you must use a district yield potential of 150 tonnes of cane/ha.
Note: For the purposes of this method, to determine which district yield potential to use in the
Burdekin, “farm” is an area covered by one (1) unique farm identity number.
If you grow sugarcane in an area without a district yield potential shown in Table 1 (for
example in the Fitzroy catchment), you should use the yield potential for the district that is the
closest match to your property in terms of factors such as region, climate and soil types.
Step 1.2: What is the nitrogen utilisation index?
The nitrogen utilisation index is a figure derived from field experiments and modelling by the
Cooperative Research Centre (CRC) for Sustainable Sugar (Keating et al 1997) to calculate
the amount of nitrogen fertiliser required by plant crops and ratoon crops to produce a
certain yield of millable cane. The index is 1.4 kg of nitrogen applied for every tonne of cane
up to a yield of 100 tonnes per hectare, plus 1.0 kg of nitrogen for every tonne of cane
thereafter.
How do I calculate my baseline application rate?
Table 2 shows the baseline amount of nitrogen to be applied in the 12 different districts.
These amounts were calculated by multiplying the district yield potential by the nitrogen
utilisation index.
For example: A grower in Innisfail, where the district yield potential is 120 tonnes of cane per
hectare, would start with a baseline nitrogen application rate of 160 kg per hectare. This is
calculated by taking the first 100 tonnes of the district yield potential for Innisfail and
multiplying it by the nitrogen utilisation index of 1.4 – which equals 140 (100 x 1.4). The
remaining 20 tonnes (the amount above the 100 tonne threshold as explained above) is then
multiplied by 1.0 – which equals 20 (20 x 1.0). Add these two figures together (140 + 20) and
the baseline application rate for nitrogen fertiliser in Innisfail is 160 kg per hectare.
22Table 2: District yield potential and the corresponding baseline N application rates (Source:
Schroeder et al 2007-2009).
District District yield potential Baseline nitrogen
(tonnes of cane/ha) application rate (kg/ha)
(for plant & ratoon
crops)
Mossman / Cairns 120 160
Innisfail / Johnstone 120 160
Tully 120 160
Herbert 120 160
Mareeba / Dimbulah 150 190
Burdekin 150 or 180* 190 or 220*
Proserpine 130 170
Mackay 130 170
Plane Creek 120 160
Districts in the Burnett To be included following consultation before commencement of
Mary and Fitzroy regions minimum practice standards on 1 December 2022
*The Burdekin district has two baseline application rates (190 and 220 kg N/ha), recognising
that some farms/blocks can attain yields above 150 tonnes of cane/ha. If verifiable yield
records or other reasonable evidence from the past 15 years show that blocks on your farm
have produced yields higher than 150 tonnes of cane/ha in at least three (3) harvest periods
(seasons) (to the satisfaction of the administering authority), you may adopt the 220 kg N/ha
baseline figure to calculate your N application rate for the farm. Otherwise, you must use a
baseline N application rate of 190 kg N/ha.
What if blocks on my farm have yields that are higher than the district yield potential?
If a grower in any district can demonstrate to the satisfaction of the administering authority
(through verifiable yield records or other reasonable evidence from the past 15 years) that a
block or a number of blocks has produced yields higher than the district yield potential in at
least three (3) harvest periods (seasons), the baseline nitrogen application rate can be
adjusted for those blocks only to reflect the block yield.
For example: If verified records or other reasonable evidence from up to 15 years show that a
block on a farm in the Johnstone district produced 130 tonnes of cane to the hectare in three
(3) harvest periods (seasons), then the baseline N application rate can be increased to 170kg
of nitrogen per hectare for that block. This adjustment is reached by applying the same
calculation as provided previously i.e. (100 x 1.4) + (30 x 1.0) = 170. This figure is 10 kg of
nitrogen per hectare higher than the normal baseline rate applied in the Johnstone district
shown in Table 2, reflecting the higher yield potential as verified by the farm records.
What if I am developing a Farm Nitrogen and Phosphorus Budget and my average
whole of farm yields are higher than the district yield potential?
If you are developing a Farm Nitrogen and Phosphorus Budget and can demonstrate
through verifiable yield records or other reasonable evidence from the past 15 years to the
satisfaction of the administering authority that the whole of farm average yield over the last
15 years exceeded the district yield potential in at least 3 of those last 15 years, the baseline
nitrogen application rate for all blocks on that whole of farm can be adjusted to reflect that
higher yield potential.
For example: If verified records or other reasonable evidence from the last 15 years show that
a farm in the Proserpine district produced a whole of farm average yield of 140 tonnes of cane
to the hectare in at least three (3) harvest periods (seasons) from the last 15 years, then the
baseline nitrogen application rate can be increased to 180kg of nitrogen per hectare for each
23block within the whole of farm. This adjustment is reached by applying the same calculation
as provided previously i.e. (100 x 1.4) + (40 x 1.0) = 180. This figure is 10 kg of nitrogen per
hectare higher than the normal baseline rate applied in the Proserpine district (170kg/ha)
shown in Table 2.
NOTE: This part of the method only applies if a Farm Nitrogen and Phosphorus Budget has
been developed for the agricultural property in accordance with the Agricultural ERA standard
for sugarcane cultivation.
What if my yield is lower than the district yield potential?
If a farm or block produces lower yields than the district yield potential, the baseline nitrogen
application rate could be reduced using the same approach. However you should first assess
whether any constraints (i.e. soil compaction, soil waterlogging or nutrient deficiencies other
than nitrogen or phosphorus) are preventing your crop reaching the district yield potential.
Stage 2 - Calculating the combined nitrogen inputs to deduct from the
baseline application rate
This section shows you how to calculate deductions from the baseline application rate
calculated in Stage 1.
Step 2.1: What is the soil nitrogen mineralisation index?
One source of available nitrogen is in-season mineralisation of nitrogen from soil organic
matter. The quantity of nitrogen made available from organic matter is estimated by
measuring the organic carbon level of the soil. Very broadly, soil organic matter is made up of
crop residues, living soil micro-organisms and stable, complex organic compounds called
‘humus’. Different soils contain different amounts of organic matter. All organic matter
contains carbon which can be measured and is used as an indicator of organic carbon
content.
Organic nitrogen is a component of soil organic matter, and is converted by soil micro-
organisms into the ammonium and nitrate nitrogen, both of which are available to plants. This
process is called mineralisation. However, the actual quantity of nitrogen supplied to the
sugarcane crop varies according to the soil type and seasonal conditions.
The soil nitrogen mineralisation index was developed to help you adjust the baseline nitrogen
application rate by taking into account the nitrogen mineralised from soil organic matter during
the crop season. These adjustments are based on the organic carbon (OC) content of your
soil, which determines the soil nitrogen mineralisation index (see Table 3).
Once the soil mineralisation index has been determined, the amount of nitrogen to be
deducted from the baseline application rate can be calculated.
The soil nitrogen mineralisation index step must be determined for each area that soil
samples are taken in preparation of establishing plant cane, because different soil types may
have different organic carbon contents.
Please refer to the Soil sampling and analysis method.
How do I adjust my baseline nitrogen application rate using the soil mineralisation
index?
Once you have received the results of your soil test using the Soil sampling and analysis
method, you will know the organic carbon content of the soil, which will be presented as a
percentage (%).
24Plant cane (plant after at least 6 months fallow)
To determine what your calculated amount of nitrogen is for plant crops established after a
fallow, refer to Table 2 to identify your district yield potential then use Table 3 to calculate
your application rate taking into account the organic carbon content of your soil. These
numbers represent the regulated amount of nitrogen to apply, recognising the contribution of
nitrogen that is mineralised in the soil during a fallow period of at least six (6) months.
Table 3: Nitrogen application rates for plant cane after a fallow of at least six (6) months,
based on district yield potentials and the soil nitrogen mineralisation index (Adapted from
Schroeder et al 2007-2009).
Soil nitrogen Organic District yield potential5
mineralisation carbon (tonnes of cane/ha)
index (%) 120¹ 130² 150³ 1804
N application rate for plant cane (kg N/ha)
Very Low 2.4 80 90 90 -
1Mossman/Cairns, Innisfail/Johnstone, Tully, Herbert, Plane Creek
2Mackay and Proserpine districts
3Burdekin, Mareeba/Dimbulah districts
4Burdekin district - yield potential based on verifiable yield records
5
Districts in the Burnett Mary and Fitzroy regions to be included following consultation before
commencement of minimum practice standards on 1 December 2022
Ratoon and replant cane (less than 6 months fallow)
Table 4 indicates the regulated amount of nitrogen to apply on ratoon and replant cane. Find
the range of organic carbon percentage that matches your soil test result, and use the
application rate shown under the district yield potential column identified earlier in Table 2.
Note that the higher the organic carbon content of your soil, the greater the deduction from
the baseline application rate.
Table 4: Nitrogen application rates for replant (less than six (6) months fallow) and ratoon
cane based on district yield potentials and the soil nitrogen mineralisation index (Adapted
from Schroeder et al 2007-2009).
Soil nitrogen Organic District yield potential5
mineralisation carbon (tonnes of cane/ha)
index (%) 120¹ 130² 150³ 1804
N application rate for replant and ratoon cane (kg
N/ha)
Very Low 2.4 100 110 130 -
1Mossman / Cairns, Innisfail / Johnstone, Tully, Herbert, Plane Creek
2Mackay and Proserpine districts
3Burdekin, Mareeba / Dimbulah districts
4Burdekin district - yield potential based on verifiable yield records
5
Districts in the Burnett Mary and Fitzroy regions to be included following consultation before
commencement of minimum practice standards on 1 December 2022
25How do I adjust my baseline application rate for ratoon crops established before 2010
if I did not undertake soil testing prior to the plant crop?
The rate of fertiliser for ratoon crops already established at 1 January 2010 must also be
calculated and recorded before fertilising. However, as it was not compulsory to take a soil
test before fertilising these ratoon crops, a simplified method is used.
The application rate for nitrogen on ratoon crops already established at 1 January 2010 must
not exceed the calculated baseline application rate for your district as outlined in Table 2. This
amount can be reduced if the older ratoons produce lower yields and therefore require less
nitrogen.
Note this method only applies to ratoon crops already established at 1 January 2010. Plant
crops and subsequent ratoons established after this date must apply nitrogen at or below
rates calculated using the full method as set out in Stage 1 and Stage 2 of Calculating the
amount of nitrogen and phosphorus method.
Step 2.2: Determine the nitrogen from mill by-products
There are a number of mill by-products applied to sugarcane lands, including mill mud (fibre,
soil and other milling process residuals), boiler ash (particulate material collected after
bagasse and other material burnt at the mill) and mud-ash mixes (Schroeder 2008).
Substantial amounts of nitrogen, phosphorus and other nutrients are added to cane blocks
through the application of mill by-products. However, the amount of nitrogen that blocks
receive from mill by-products is affected by the following:
Variability of the nitrogen content of the by-products due to the variable nature of the
source of the material, i.e. mill mud is derived from different soil types within a district.
Application rates of the by-products, which can range from around 50 to 300 wet tonnes
per hectare.
Variability of nutrient losses via nitrogen and phosphorus loss pathways.
The ratio of the components of the mud/ash mix. This ratio can differ from load to load of
the product.
Due to the variable nutrient content of mill by-products, for the purposes of this method mill
mud and mud-ash mixes are treated as one product (mill by-products). For the purpose of
calculating the amount of nitrogen supplied by mill by-products, the lower documented value
of their nitrogen content is used. Where mill ash is applied on its own no deduction for
nitrogen is required from your fertiliser application rate. This approach will be further refined in
the future as techniques for quantifying and/or reducing the variability of the product are
developed. Broadcast application of mill by-products is only permitted during a fallow period
where it is incorporated into the soil following its application.
How do I calculate the deduction for nitrogen supplied from mill by-products?
Three rates of mill by-products are considered:
1. less than 100 wet tonnes per ha
2. 100–200 wet tonnes per ha
3. 200–300 wet tonnes per ha
Mill by-products deductions from your nitrogen fertiliser application rate are required for the
crop immediately following its application.
To work out the deductions required from your nitrogen fertiliser application rate (Tables 3 &
4) following the application of mill mud, refer to Table 5. These deductions reflect the low end
of estimated nitrogen input from mill mud and mill mud ash mixes and were chosen to remove
the uncertainty created by the variable nutrient content of mill by-products.
Note that no deductions are required where mill ash alone is applied.
26You can also read