FATE OF AGRICULTURAL AREAS OF KAILALI DISTRICT OF NEPAL: A TEMPORAL LAND USE LAND COVER CHANGE (LUCC) ANALYSIS - ISPRS ...
←
→
Page content transcription
If your browser does not render page correctly, please read the page content below
The International Archives of the Photogrammetry, Remote Sensing and Spatial Information Sciences, Volume XLIII-B3-2020, 2020
 XXIV ISPRS Congress (2020 edition)

 FATE OF AGRICULTURAL AREAS OF KAILALI DISTRICT OF NEPAL: A TEMPORAL LAND
 USE LAND COVER CHANGE (LUCC) ANALYSIS.

 Niraj KC1, Lawaj Thapa1, Dericks Praise Shukla1*

 1 School of Engineering, IIT Mandi, India (d18058@students.iitmandi.ac.in; dericks@iitmandi.ac.in)

 Commission III, WG III/7

KEY WORDS: Supervised Classification, LULC mapping, Temporal change analysis, Accuracy Assessment, Urbanisation

ABSTRACT:

Changes of agricultural land into non-agricultural land is the main issue of increasing population and urbanization. The objective of
this paper is to identify the various land resources and its changes into other Land Use Land Cover (LULC) type. LANDSAT
satellite data for 1990, 2000, 2010 and 2018 years of Kailali district Nepal was acquired for supervised LULC mapping and change
analysis using ENVI 5.4 software. Sentinel-2 and Google earth satellite data were used for the accuracy assessment of the LULC
map. The time-series data analysis from 1990-2000-2010-2018 shows major changes in vegetation and agriculture. The changes in
LULC show that settlement and bare land is continuously increasing throughout these years. The change in land use and land cover
during the period of 1990-2018 shows that the settlement area is increased by 204%; and agriculture is decreased by 57%. The
fluctuating behavior of vegetation, agriculture and water bodies in which the areas decrease and increase over the selected periods is
due to natural calamities and migration of the local population. This shows that human influence on the land resources is
accelerating and leading to a deterioration of agricultural land. Thus effective agricultural management practices and policies should
be carried out at the government level for minimizing land resources degradation by the human-induced impact.

 1. INTRODUCTION
 The traditional method of geospatial techniques of land use and
The land occupied by the population for their specific purposes land cover mapping, monitoring and analysing of LULC
such as farming, settlement can be defined as land use (FAO, changes are very time consuming (Martinuzzi et al., 2007). The
1976; Stomph et al.,1994); while the land cover is defined as current available geospatial techniques are very reliable and fast
the biophysical condition of the earth surface and its instant for recording locational data and attributed datasets. Thus, the
subsurface (Herold et al., 2003). Land cover includes features technique is capable to integrate location and attributed datasets
such as grassland, forest, concrete, etc. whereas land use refers to make LULC maps, which play an important role in land use
intention connected with that land cover such as raising cattle, management, monitoring and disseminating land-related
urban planning, etc. (Zubair, 2006). Land use is related to land information at different levels (Joshi, 2016).
cover in various aspects such as forest used for a combination of
timbering, the farming system combined with cultivable land, Remote sensing (RS) and Geographic Information system (GIS)
settlement, pasture land, etc. (Zubair, 2006). techniques have been widely used to classify LULC and to
 enable calculation of its matching area distribution (Lillesand
The major issues in global sustainable development are land use and Kiefer, 2015). The assurance of increase and decrease of
and land cover changes over time (Guan et al., 2011; Halmy et land use and land cover change (LUCC) at different periods can
al., 2015). Land use and land cover mapping and decadal be easily determined once RS and GIS results integrate with
change analysis depend upon the spatial and temporal level of ground measurements (DeFries et al., 2004). The capability and
analysis. A high level of spatial and temporal detail is not strength of methods provide correct locational information,
sufficient for detecting small changes. The detection of a piece inaccessible LULC information and repetitive coverage of large
of agricultural land converted into an airport cannot be visible areas (Zubair, 2006). The importance of the up-to-date LULC
at the national level (small scale) (Jat et al., 2008). The long- information system is to understand and approximate different
term phenomenon of land use and land cover change is not environmental, socio-economic and biophysical significances of
visible in a short time since the conversion of agriculture land these decadal LULC changes (Wilson and Chakraborty, 2013;
into urban cannot be detected within 1 or 3 years of a time Williams, and Schirmer, 2012). The LULC information system
interval as it requires a long time interval gap and large scale can be used by different levels of government structures, land-
data. The land use and land cover changes are strongly use managers, planners and policymakers to monitor how the
influenced by rapid urbanization (Dadras et al., 2015). land can be used for sustainable development and land use
Urbanization is affected by human influences, socioeconomic management efficiently and effectively (Foley et al., 2005;
and physical factors which result in various consequences Meyer and Turner, 1992).
including deforestation, destruction of agricultural lands, and
conversion of bare and fallow lands into human settlements LULC changes for the urban environment is highly affected by
(Dadras et al., 2015). anthropogenic activities and habitat fragmentation. Thus, we

* Corresponding author

 This contribution has been peer-reviewed.
 https://doi.org/10.5194/isprs-archives-XLIII-B3-2020-1601-2020 | © Authors 2020. CC BY 4.0 License. 1601
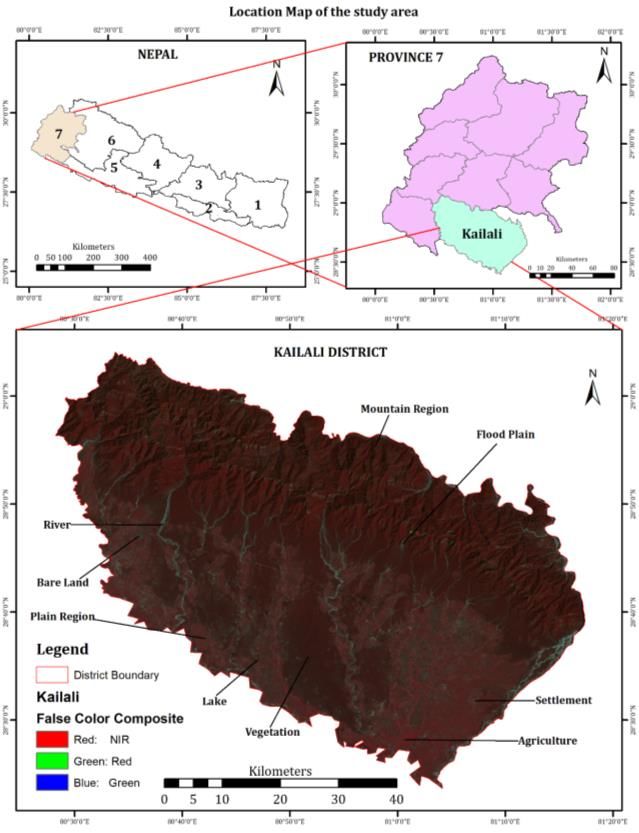
The International Archives of the Photogrammetry, Remote Sensing and Spatial Information Sciences, Volume XLIII-B3-2020, 2020
 XXIV ISPRS Congress (2020 edition)

need to have better thinking of mapping and monitoring LULC 2.2 Data Used
changes in urban areas (DeFries et al., 2004). The process of
observing and identifying the major variation of targeted land The primary data source used for LULC mapping and LUCC
features and their dynamics for different periods is termed as analysis is satellite imagery. The study used Landsat 5, Landsat
pattern analysis (Martinuzzi et al., 2007). The pattern analysis is 8 and Sentinel-2 satellite imagery. The satellite imagery Landsat
done to identify the geographical differences in a repetitive 5 TM, Landsat 8 OLI and Sentinel-2 MSS of the study area
time. The pattern analysis is applicable in various fields such as were downloaded from the US Geological Survey image
urban sprawl, habitat fragmentation coastal change, rate of database site (http://earthexplorer.usgs.gov). Sentinel-2 satellite
deforestation, etc. Habitat fragmentation is the main cause of imagery is used for validating classified maps of the years 2018.
land degradation or alteration of land resources from one The spatial resolution of Sentinel-2 image (10m, 20m) is high
circumstance to another. The pattern analysis of habitat as compare to Landsat datasets (15m, 30m). Topographic map
fragmentation and its causes help in formulating appropriate of 1:25000 is downloaded from Mountain of Central Asia
conservation measures for any region and it is one of the main Digital Dataset (MCADD) and it is used for satellite image
techniques to recognize and quantify land-use and land-cover registration with spatial reference system WGS 1984 UTM zone
change (LUCC). The pattern analysis of LUCC in mountainous 44N.
areas involves the detection and mapping of fragmented LULC,
soil loss estimation and risk assessment (Taubenböck et al.,
2009). Due to global dynamics and Spatio-temporal variations,
the LULC mapping and pattern analysis had become the main
research topic to analyse the changing trends in geographical
space (Mas, 1999).

The objective of this research paper is to understand the Spatio-
temporal phenomenon through LULC mapping and change
analysis in the Kailali district of Nepal. This paper aims to
identify decadal changes in LUCC patterns and analyze the
changes in terms of land degradation and habitat fragmentation.
The LULC mapping, pattern and trend analysis in the land-use
transformations have been studied using remote sensing and
GIS techniques. The details of multi-temporal LULC mapping
and LUCC analysis of this work will be helpful to policymakers
in making policies for better LULC management and effective
land-use practices.

 2. MATERIALS AND METHODS

2.1 Study Area

The LULC mapping and LUCC analysis has been carried out in
Kailali district of Nepal which is located in far-Western
Province-7 having the spatial extent between latitude 28° 23'
36.34125" N to 29° 4' 8.37569" N and longitude from 80° 28'
2.64791" E to 81° 17' 20.71635" E covering an area of about
3,235 sq km as shown in Figure 1. The elevation of the district
varies from 109 meters in the Terai belt to 1950 meters in the
mountainous areas. Nearly 60% of the study area have elevation
 Figure 1: Location map of study area
below 300m, making it lower tropical climate; around 26% area
falls under upper tropical climate having the elevation range
 2.3 Image Preprocessing
between 300-1000 m; and the mountainous areas (1000 – 2000
m) falling under sub-tropical climate covers nearly 14% of the The downloaded satellite data is pre-processed first before data
study area (Joshi, 2016). Usually, the district has a mild and analysis due to the occurrence of atmospheric effect,
warm temperature that varies from a maximum of 43° C in topographic effect and geometric effect in the satellite imagery.
summer and a minimum of 5° C in winter season with an The topographic correction chosen is sun angle correction
average annual temperature of 31°C. Around 65% of the district which minimizes the effects that occur due to different positions
is covered by vegetation/ forest and 28% is covered by of the sun (i.e. in the morning, noon, evening). Sun angle
cultivated land (Joshi, 2016). The main rivers are Gaurishankar, correction is termed as absolute radiometric correction obtained
Likma, Godawari, Karnali, Shivganga, and Patharaiya. Some of by dividing top of atmosphere (TOA) correction by solar
the prominent natural lakes of the district are Koilahi, elevation angle. i.e. (Sine (sun elevation)) (Gupta and Shukla,
Behadababa, Tilko, Jokhar, and Ghodaghodi that are mostly 2016). The mathematical formula top of atmosphere (TOA)
present in the Tarai region. The district has a total population of correction is given below:
about 775,709 in 2011 with 2.29% population growth rate. σ = M * DN + A
 Where, =Top of atmosphere correction
 M= Band Specific Reflectance Mult_Band
 DN=Digital number values
 A= Reflectance_Add_Band

 This contribution has been peer-reviewed.
 https://doi.org/10.5194/isprs-archives-XLIII-B3-2020-1601-2020 | © Authors 2020. CC BY 4.0 License. 1602
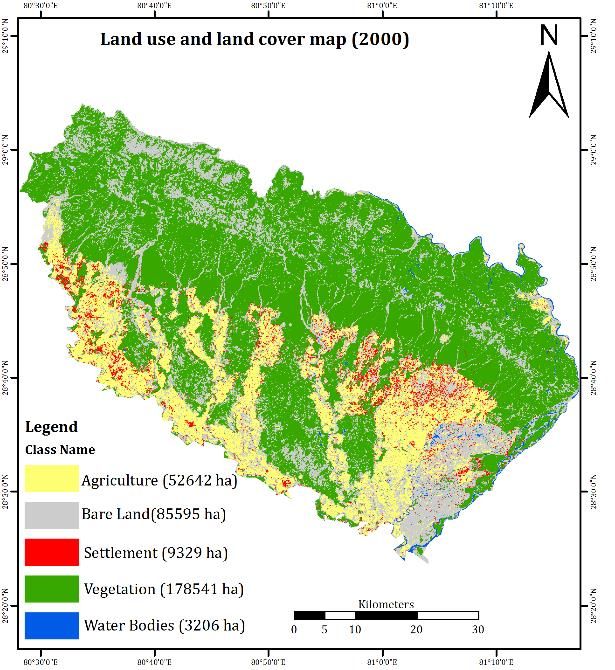
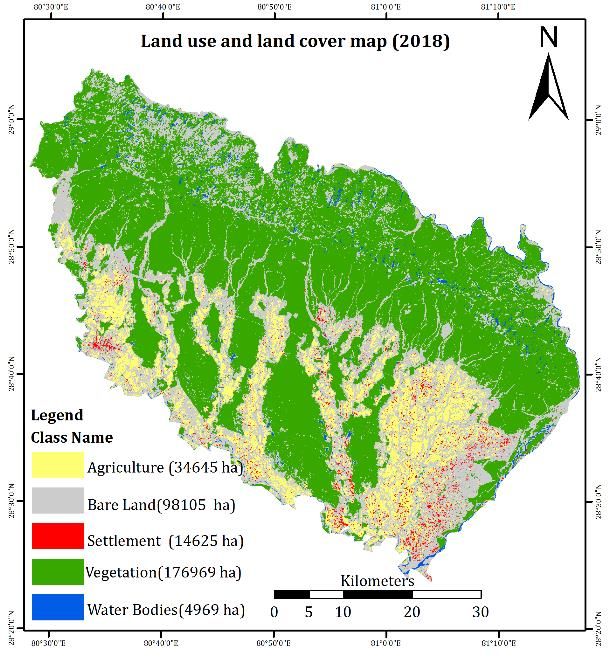
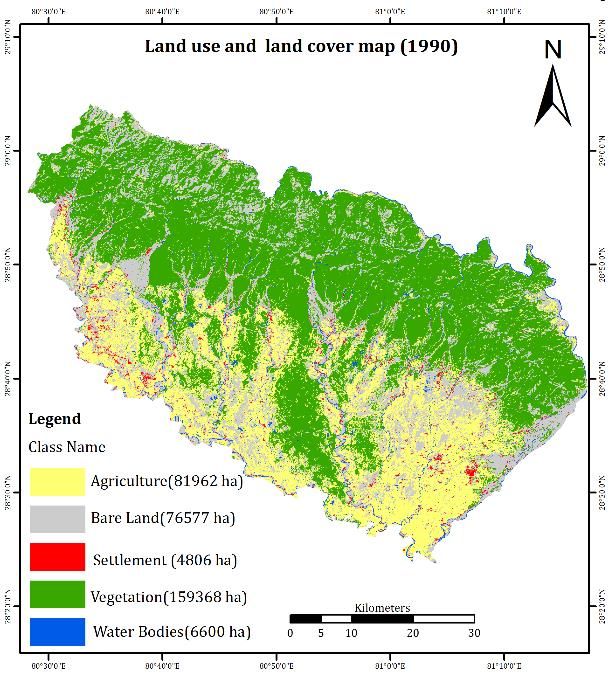
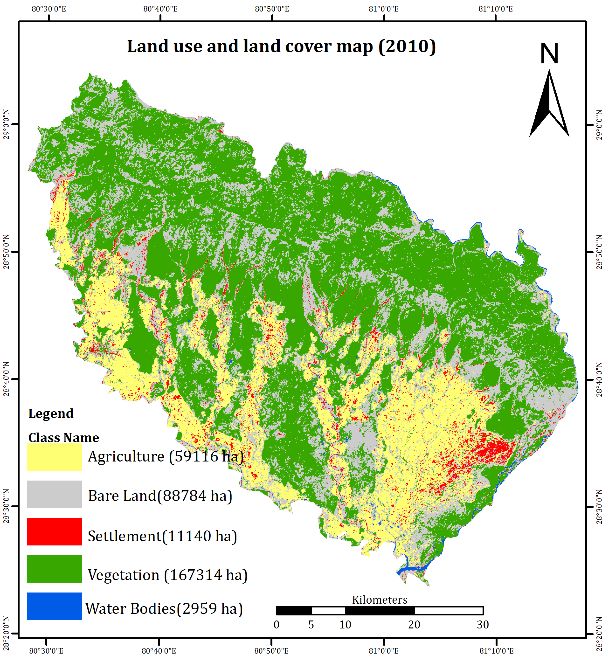
The International Archives of the Photogrammetry, Remote Sensing and Spatial Information Sciences, Volume XLIII-B3-2020, 2020
 XXIV ISPRS Congress (2020 edition)

 map of Kailali district Nepal. The temporal distribution of
Band specific reflectance mult_band and reflectance add_band LULC changes for four decades (1990-2018) is shown in Table
information are obtained from Landsat datasets metadata file. 1. The area occupied by the water bodies in the year 1990 was
Digital number values are the original downloaded image. Thus, 6600 ha (2%) but it decreased in the year 2000 to about 3206 ha
obtained corrected top of atmosphere image was used for (0.97%). A similar decreasing trend occurred in the year 2010
topographic correction. The mathematical formula topographic in which only 2959 ha (0.90%) was occupied by the water
correction is given below: bodies whereas the area is about 4969 ha (1.51%) in 2018. In
 1990 vegetation covers an area of about 159368 ha (48.39 %)
 λ = σ ⁄ sine (ϴ) but in 2000 it has an area of about 178541 ha (54.22%). It
Where = Sun angle correction shows that from 1990 to 2000 there is an increase in vegetation
 =Top of atmosphere correction area. If we observe the area occupied by vegetation in the year
 =Sun elevation 2010 and 2018 there was 167314 ha (50.81%) and 176969
 (53.74%) respectively. This shows a slight increment in
Sun elevation angle is obtained from the Landsat datasets vegetation area from 2010 to 2018. The settlement class
metadata file. Hence, Absolute radiometric correction altered covered an area of about 4806 (1.46%) in the year 1990,
individual pixel values to correct atmospheric and topographic similarly, in the year 2000, 2010 and 2018 covered an area of
effect occurred in satellite images. Geometric correction refers about 9329 (2.83 %), 11140 (3.38 %) and 14625 (4.44 %)
to minimize the effects occurred due to the altitude and attitude respectively. This shows the increasing trend throughout the
of the sensor. Topographic map of 1:25000 is obtained from selected years. The bare land occupied an area of about 76577
Mountain of Central Asia Digital Dataset (MCADD) and it is ha (23.25%), 85595 ha (25.99 ha), 88784 ha (26.96%) and
used for satellite image registration with spatial reference 98105 ha (29.79%) in the year 1990, 2000, 2010 and 2018
system WGS 1984 UTM zone 44N. Bilinear resampling respectively. This also shows an increasing trend throughout the
technique is chosen during the image registration process to selected periods. The agriculture land covered an area of about
maintain root mean square error (RMSE) less than 30m. The 81962 (24.89%) in the year 1990 but it is decreased to about
topographic, atmospheric and geometric corrected satellite 52642 ha (15.99%) in the year 2000. If we observe the area
image is then layer stacked and clipped by polygon file of the covered by agriculture land in the years 2000 and 2010 there is
study area for automatic feature extraction from satellite image- a slight increased agricultural area to about 59116 ha (17.95 %).
based upon similar DN value The area covered by agricultural land in the year 2018 was
 34645 ha (10.52%). As we compare the area between 2010 and
2.4 Image Classification 2018 we found a slightly decreasing trend in agricultural land.

Image Classification is the process of extracting different Table 1: LULC distribution of Kailali area throughout the
features class from the satellite imagery-based upon similar DN selected time periods.
value (Janssen & Gorte, 2001). The supervised automatic
classification method is used for selecting training samples and 1990 2000 2010 2018
 LULC-classes
processing them automatically choosing a maximum likelihood Area (%) Area (%) Area (%) Area (%)
 Water Bodies 2.00 0.97 0.90 1.51
algorithm of supervised classification to prepare the land use
 Vegetation 48.39 54.22 50.81 53.74
and land cover (LULC) map of different years.
 Settlement 1.46 2.83 3.38 4.44
 Bare Land 23.25 25.99 26.96 29.79
2.5 Accuracy Assessment Agriculture 24.89 15.99 17.95 10.52
 Total 100 100 100 100
Accuracy assessment plays an important role in any thematic
mapping project. It relates the classified image to referenced
 The land use and land cover classes, over the past 40 years
data (i.e. Ground truth). Ground truth is collected from Google
 (1990-2018) as shown in Table 1, where settlement, bare land,
earth to access the accuracy of 1990, 2000 and 2010 classified
 and vegetation is increased by 204%, 28%, and 11%
data because high-resolution imagery is not freely available for
 respectively. On the other hand water bodies and agriculture is
those periods. The sentinel-2B satellite of resolution (10 m, 20
 decreased by 24% and 57%. Table 1 and Figure 2 & 3 also
m) datasets available from 2015 onwards is used to validate the
 shows the fluctuating pattern of vegetation agriculture and
2018 classified data. The accuracy of classified data for 1990,
 water bodies in which the areas decreases and increases as time
2000, 2010 and 2018 is accessed by generating error matrix and
 goes on. The settlement and bare land area throughout the
calculating kappa statistics. Confusion matrix/ Error matrix is
 selected periods have increasing trends. It is found that
generated to compare 200 random sample points of ground truth
 agricultural land is highly affected which signifies rapid
data as reference data with classified data of different periods.
 population growth and urbanization in this area.
Error matrix results in overall accuracy, producer accuracy and
user accuracy of classified data. Kappa statistics are calculated
 The land use and land cover changes trends between 1990 to
to understand how closely classified data matched the sample
 2000 and 2000 to 2010 were found quite similar. Land use and
data as ground truth if results close to 1 show truly partial
 land cover changes trends show several ecological, physical and
ground condition.
 socioeconomic consequences. These consequences have
 positive as well as negative sides. The positive side represents
 3. RESULTS AND DISCUSSION
 an increase in agriculture land may raise food production for a
3.1 Land Use Land Cover Mapping growing population but it does not guarantee how productive
 the last exploited lands into agriculture. The negative side
The rationale of the research lies in preparing the LULC map means changing vegetation to agricultural land signifies change
and understanding spatiotemporal conditions through LULC the radiation balance of the given unit of area.
analysis. Figure 2 and figure 3 below shows the resulted LULC

 This contribution has been peer-reviewed.
 https://doi.org/10.5194/isprs-archives-XLIII-B3-2020-1601-2020 | © Authors 2020. CC BY 4.0 License. 1603
The International Archives of the Photogrammetry, Remote Sensing and Spatial Information Sciences, Volume XLIII-B3-2020, 2020
 XXIV ISPRS Congress (2020 edition)

 Figure 3: LULC map of Kailali District for years 2010, 2018.
Figure 2: LULC map of Kailali District for years 1990, 2000.
 The LULC of Dhangadhi, Tikapur, Mohanyal, and Bardogoriya
As we know, Albedo value increases in the urban area (surface
 shows that Dhangadhi and Tikapur have settlement area
without vegetation) this means throughout the year producing
 1933.924 ha and 772.784 ha respectively and vegetation area
more incident radiation to reflect the space. Another negative
 6177.936 ha and 1220.195 ha respectively whereas Bardogoriya
side is environmental consequences as vegetation is converted
 and Mohanyal have settlement area 118.494 ha and 77.22 ha
into Agricultural land, bare land and settlement, the porosity of
 respectively and vegetation area 1286.766 ha and 49208.046 ha
soil may be reduced by soil compaction results in decreasing
 respectively as shown in Figure 4. The expansion of settlement
infiltration capacity and increasing soil erosion (Brussaard,
 land is based on its socio-economic development. Figure 4
1994; Don et al., 2011). In the hilly region of Kailali district,
 shows the higher settlement area in Dhangadhi and Tikapur
the conversion of the vegetation to agricultural lands decreases
 whereas lesser settlement in Mohanyal and Bardogoriya.
due to controlled habitat fragmentation being less urbanized as
 Dhangadhi and Tikapur are the major cities of Kailali district
compared to the Terai belt of the district where we can see rapid
 whereas Mohanyal and Bardogoriya are rural regions of Kailali
urbanization with high settlement area. The conversion of the
 district. This observation indicates the rapid urbanization and
vegetation to agricultural land in the hilly region is also
 complex spatiotemporal phenomenon seen in Dhangadhi and
declining because of agriculture land capture less atmospheric
 Tikapur in recent years as compared to Bardogoriya and
moisture than vegetation (Zhang et al., 2015)
 Mohanyal. The local units which have a higher number of
 households and populations are urbanized area where we can
LULC distribution among various localities commonly known
 see the higher settlement and bare land as compared to others.
as Nagarpalikas have been carried out. There are 13 main areas
 The units which are highly urbanized are Dhangadhi, Kailali,
and the variation in these Nagarpalikas is studied and presented.
 and Gauriganga there we can see high populations with greater

 This contribution has been peer-reviewed.
 https://doi.org/10.5194/isprs-archives-XLIII-B3-2020-1601-2020 | © Authors 2020. CC BY 4.0 License. 1604
The International Archives of the Photogrammetry, Remote Sensing and Spatial Information Sciences, Volume XLIII-B3-2020, 2020 XXIV ISPRS Congress (2020 edition) settlement region as compared to those units where The user's accuracy represents the efficiency of the LULC map development is less such as Mohanyal gaunpalika, Bardogoria and states how effectively the LULC map represents the ground gaupalika, and Chure gaunpalika. In the year 2010 Dhangadhi, reality. The user accuracy for the year 1990,2000,2010 and Kailari and Gauriganga are the local units that have greater 2018 shows the maximum percentage for vegetation is 93%, populations and households as compared to others. water bodies are 91%, vegetation is 92% and vegetation is 92% respectively. Similarly, the minimum percentage of user accuracy is 75% for bare land in the year 1990, 66% for settlement in the year 2000, 66% for bare land in the year 2010 and 80% for bare land in the year 2010 4. CONCLUSIONS The work analysed the spatiotemporal dynamics of land use and land cover using satellite imagery to understand the situation of the agricultural area of different periods of Kailali district of Nepal. It was observed that from 1990-2000-2010-2018 major changes were found in settlement, vegetation and agricultural classes. The settlement area is increased by 204%; vegetation is Figure 4: Variation in LULC (2010) with census population for increased by 11%; bare land is increased by 28%; whereas different localities (Nagarpalikas) water bodies are decreased by 24% and agriculture is decreased by 57%. The changes in LULC show that settlement and bare land is continuously increasing throughout these years. The 3.2 Accuracy Assessment decrease in agricultural land and increase in the settlement area are highly affected by urbanization in this area which are mainly Error matrix is generated through user accuracy (UA), producer observed in Dhangadhi, Kailari and Gauriganga nagarpalikas. accuracy (PA), overall accuracy and kappa statistics is evaluated These nagarpalikas have the highest population leading to to validate the classified LULC map of different years with urbanization and thus decrease in agricultural areas. Google earth and Sentinel-2 data (10, 20m spatial resolution). The research is assumed to be partially representing the ground There are several recommendations based upon the conclusion condition if the overall accuracy is above 80% and kappa of the research for the proper management, conservation, and statistics is close to value 1. The detail of accuracy assessment monitoring of land resources: as shown in Table 2 that illustrates the overall accuracy, Government officials should collaborate with non- producer accuracy, user accuracy and kappa statistics of governmental institutions for conserving and planting trees. classified data. The overall accuracy is 88%, 86%, 86% and Effective agriculture management practices and policies 89% respectively in the years 1990, 2000, 2010 and 2018. Also, should be carried out at the government level for minimizing the kappa statistics are 0.85, 0.79, 0.78 and 0.9 in the years agriculture resources degradation by the human-induced 1990, 2000, 2010 and 2018 respectively. The overall accuracy impact. and estimated kappa statistics are above 80% and values closer The vegetation and natural resources would be protected and to 1 respectively signifies that the classified data partially restored efficiently and effectively depend upon the incentives represents the chosen land feature classes. provided to local people to look after the new plantations. Table 2: Error matrix showing the accuracy assessment of LULC prepared for different years. ACKNOWLEDGEMENTS 1990(%) 2000(%) 2010(%) 2018(%) The authors would like to express our sincere gratitude towards LULC Class PA UA PA UA PA UA PA UA IIT Mandi, Kamand, Himachal Pradesh, India for providing us Water Bodies 93 87 88 91 86 89 83 80 this platform and technical resources for carrying out this study. Vegetation 87 93 81 79 96 92 90 92 We would also like to thank the United States Geological Settlement 67 94 50 66 62 83 76 86 Survey and Mountain of Central Asia Digital Dataset Bare Land 85 75 90 90 50 66 84 80 Agriculture 79 80 73 89 86 75 78 85 (MCADD) for providing the data to carry out this research. . Overall 88 86 86 89 REFERENCES Accuracy (%) Kappa 0.8582 0.7994 0.7831 0.9 Statistics Brussaard, L. (1994). Interrelationships between biological The producer's accuracy specifies how accurately a specified activities, soil properties and soil management. In Soil LULC class has been classified. The maximum producer resilience and sustainable land use (pp. 309-329). accuracy obtained from the error matrix as shown in Table 2 for the years 1990, 2000, 2010 and 2018 is 93% in water bodies, Dadras, M., Shafri, H. Z., Ahmad, N., Pradhan, B., & 90% in a settlement, 96% in bare land and 90% in vegetation. Safarpour, S. (2015). Spatio-temporal analysis of urban growth Similarly, maximum producer accuracy obtained for the years from remote sensing data in Bandar Abbas city, Iran. The 1990, 2000, 2010 and 2018 is 67% in a settlement, 50% in a Egyptian Journal of Remote Sensing and Space Science, 18(1), settlement, 50% in bare land and 76% in a settlement. 35-52. This contribution has been peer-reviewed. https://doi.org/10.5194/isprs-archives-XLIII-B3-2020-1601-2020 | © Authors 2020. CC BY 4.0 License. 1605
The International Archives of the Photogrammetry, Remote Sensing and Spatial Information Sciences, Volume XLIII-B3-2020, 2020
 XXIV ISPRS Congress (2020 edition)

DeFries, R. S., Foley, J. A., & Asner, G. P. (2004). Land‐use Stomph, T. J., Fresco, L. O., & Van Keulen, H. (1994). Land
choices: Balancing human needs and ecosystem use system evaluation: concepts and methodology. Agricultural
function. Frontiers in Ecology and the Environment, 2(5), 249- systems, 44(3), 243-255.
257.
 Taubenböck, H., Wegmann, M., Roth, A., Mehl, H., & Dech, S.
Don, A., Schumacher, J., & Freibauer, A. (2011). Impact of (2009). Urbanization in India–Spatiotemporal analysis using
tropical land‐use change on soil organic carbon stocks–a remote sensing data. Computers, environment and urban
meta‐analysis. Global Change Biology, 17(4), 1658-1670. systems, 33(3), 179-188.

FAO, (1976). A framework for Land Evaluation. FAO Soils Williams, K. J., & Schirmer, J. (2012). Understanding the
Bulletin, 32. relationship between social change and its impacts: The
 experience of rural land use change in south-eastern
Foley, J. A., Defries, R., Asner, G. P., Barford, C., Bonan, G., Australia. Journal of Rural Studies, 28(4), 538-548.
Carpenter, S. R., ... & Helkowski, J. H. (2005). Review global
consequences of land use. Wilson, B., & Chakraborty, A. (2013). The environmental
 impacts of sprawl: emergent themes from the past decade of
Halmy, M. W. A., Gessler, P. E., Hicke, J. A., & Salem, B. B. planning research. Sustainability, 5(8), 3302-3327.
(2015). Land use/land cover change detection and prediction in
the north-western coastal desert of Egypt using Markov- Zhang K, Dang H, Zhang Q, Cheng X., 2015. Soil carbon
CA. Applied Geography, 63, 101-112. dynamics following land-use change varied with temperature
 and precipitation gradients: evidence from stable isotopes. Glob
Herold, M., Goldstein, N. C., & Clarke, K. C. (2003). The Chang Biol 21(7):2762–2772
spatiotemporal form of urban growth: measurement, analysis
and modeling. Remote sensing of Environment, 86(3), 286-302. Zubair, A. O. (2006). Change detection in land use and Land
 cover using remote sensing data and GIS (A case study of Ilorin
Guan, D., Li, H., Inohae, T., Su, W., Nagaie, T., & Hokao, K. and its environs in Kwara State). Department of Geography,
(2011). Modeling urban land use change by the integration of University of Ibadan, 176.
cellular automaton and Markov model. Ecological Modelling,
222(20-22), 3761-3772.

Janssen, L. L. F., & Gorte, B. G. H. (2001). Principle of Remote
Sensing, chapter 12 Digital image classification. International
Institute for Aerospace survery and Earth Science, ITC,
Enschede, The Netherlands.

Gupta, S. K., & Shukla, D. P. (2016). Assessment of land
use/land cover dynamics of Tso Moriri Lake, a Ramsar site in
India. Environmental monitoring and assessment, 188(12), 700.

Jat, M. K., Garg, P. K., & Khare, D. (2008). Monitoring and
modelling of urban sprawl using remote sensing and GIS
techniques. International journal of Applied Earth Observation
and Geoinformation, 10(1), 26-43.

Joshi, R. N. (2016). Prospects and Problems of Tourism In
Kailali District (Doctoral dissertation, Central Department of
Rural Development (CDRD) Tribhuvan University, Kirtipur,
Kathmandu, Nepal).

Lillesand, T., Kiefer, R. W., & Chipman, J. (2015). Remote
sensing and image interpretation. John Wiley & Sons.

Martinuzzi, S., Gould, W. A., & Gonzalez, O. M. R. (2007).
Land development, land use, and urban sprawl in Puerto Rico
integrating remote sensing and population census
data. Landscape and Urban Planning, 79(3-4), 288-297.

Mas, J. F. (1999). Monitoring land-cover changes: a
comparison of change detection techniques. International
journal of remote sensing, 20(1), 139-152.

Meyer, W. B., & Turner, B. L. (1992). Human population
growth and global land-use/cover change. Annual review of
ecology and systematics, 23(1), 39-61.

 This contribution has been peer-reviewed.
 https://doi.org/10.5194/isprs-archives-XLIII-B3-2020-1601-2020 | © Authors 2020. CC BY 4.0 License. 1606
You can also read