February, 2018 - Legend Financial Advisors, Inc.
←
→
Page content transcription
If your browser does not render page correctly, please read the page content below

February, 2018

        THE BOOM-BUST BAROMETER                                                     UPCOMING INVESTMENT WEBCAST
         FORECASTS THE S&P 500’S
          FUTURE PERFORMANCE?                                                      “Understanding The Stock Market Correction”
   By Louis P. Stanasolovich, CFP®, CCO, CEO and President of                       Presented by Louis P. Stanasolovich, CFP®, CCO, CEO and
               Legend Financial Advisors, Inc.® and                                     President of Legend Financial Advisors, Inc.® and
        EmergingWealth Investment Management, Inc.®                                     EmergingWealth Investment Management, Inc.®

T
        he Boom-Bust Barometer is a widely referenced indi-
        cator derived from the Commodity Research Bureau’s                             Monday, March 12th at 7:00 p.m. Eastern Time
        (CRB) Raw Industrial Spot Price Index, which many
        consider to be the best daily representation of the global                      Thursday, March 15th at Noon Eastern Time
economy. The Boom-Bust Barometer, made famous by Dr. Ed
Yardeni, can be an effective way of avoiding large drawdowns                   Lou Stanasolovich, CFP®, is a winner of over 35 major national
in the stock market. This barometer is calculated by taking the                “Best Advisor” type awards and is the CCO, CEO and President
CRB Raw Industrial Price Index, and dividing it by four-week                   of Legend Financial Advisors, Inc.® and EmergingWealth Invest-
moving average of initial unemployment claims (Please note:                    ment Management, Inc.® (See Lou’s Bio on page 2).
The average price of crude oil can be substantial.). If com-
modity prices rise and unemployment claims fall, the barometer
increases and theoretical economic activity is sound. As the                   Registration is free. Please feel free to invite relatives, friends,
reader can see in the chart on page 3, the Boom-Bust Barom-                    colleagues, etc. to attend. The Webcasts will be recorded and
eter is reaching all-time highs. Also, the reader can see that                 can be viewed under “Archived Webcasts” along with previous
                                           Boom-Bust, continued on page 3      Webcasts at the following link: www.legend-financial.com/
                                                                               financialwebcasts. All slides for each previous Webcast are
          INTEREST RATE CHANGES:                                               also available.
          DOES THE TREND MATTER?                                                    INVESTMENT SHORTTAKE VIDEOS
      By Doug Ramsey, CFA, CMT, Chief Investment Officer,
                  The Leuthold Group, LLC                                                          “Volatility and the VIX”
Excerpted by Louis P. Stanasolovich, CFP®, CCO, CEO and President
     of Legend Financial Advisors, Inc.® and EmergingWealth       Legend Financial Advisors, Inc.® has launched a new video se-
                 Investment Management, Inc.®                     ries entitled “Investment Shorttakes”.

The Leuthold Group’s Dow Bond Oscillator (indicates how                        These videos were created to help viewers to better understand
quickly returns are weakening in Corporate Credit, see the                     investment issues that are or will be affecting their investments
chart) issued what looks like an increasingly predictive (warn-
                                                                               and/or portfolios. Each video will contain a few slides at most
ing) “Sell” signal on January 26th. That’s when the smoothed
26-week rate-of-change in the Dow Jones Corporate Bond In-                     and will be approximately 5 to 10 minutes in length.
dex turned negative for the first time since last June. While this
indicator has nothing to do with the monetary base, the money                  Missed any of our previously sent videos? All of the videos can
supply measures (M1, M2, and MZM), or—heaven forbid—the                        still be viewed by going to the following Website:
Fed’s balance sheet, it is still considered to be one of the best              www.legend-financial.com/investment-shorttakes
monetary measures. (See the chart on the top of page 4.)
While the indicator has had a few missteps over the last several
                                  Interest Rate Changes, continued on page 4
                                                                                                THE GLOBAL INVESTMENT PULSE, February, 2018   1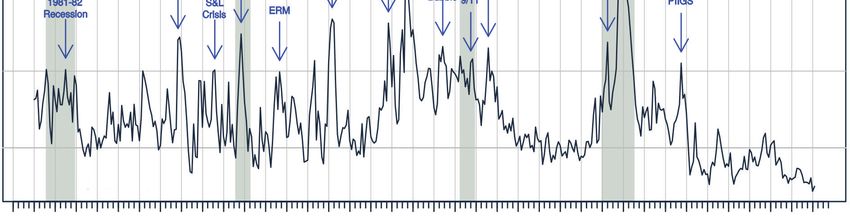
ABOUT
                                                            LEGEND FINANCIAL ADVISORS, INC.®
                                          Legend Financial Advisors, Inc.® (Legend) is a
                                          Non-Commission, Fee-Only, Fiduciary U.S. Se-
                                          curities and Exchange Commission registered
                                          investment advisory firm with its headquarters
                                          located in Pittsburgh, Pennsylvania. Legend
                                          provides Personalized Wealth Management
                                          Services Including Financial Planning And
                                          Investment Management Strategies to affluent
                                          and wealthy individuals as well as business enti-
                                          ties, medical practices and non-profit organiza-
                                          tions as well as retirement plans. Legend and
                                          its award-winning advisors are Fiduciaries.

                                                            FIVE REASONS TO CHOOSE LEGEND
                                          1. Legend is a Non-Commission, Fee-Only, Fiduciary advisory firm. Fee-Only means
                                             Legend is compensated exclusively by client fees. Unlike Legend, fee-based advisors
                                             and brokerage firms have numerous conflicts of interest due to the fact that they receive
                                             commissions.

                                          2. Members of Legend’s Financial Advisory Team have been selected by National Publica-
                                             tions such as Worth, Medical Economics and Barron’s more than 60 times as “The Best
                                             Financial Advisors In America”.

                                          3. Unlike most advisory firms and all brokerage houses, Legend and its advisors have cho-
                                             sen to be governed by the Fiduciary Standard of Law. Fiduciaries are required to work
                                             in their clients’ best interests at all times.

                                          4. Legend designs dynamic, creative and personalized financial planning and investment
                                             solutions for its clients.

                                          5. Legend emphasizes low-cost investments where possible that are allocated and traded
                                             in an income tax-efficient manner.
                                                                    ABOUT
                                                  EMERGINGWEALTH INVESTMENT MANAGEMENT, INC.®

                                                                                        EmergingWealth Investment Management,
                                                                                        Inc.® (EmergingWealth), is the sister firm
                                                                                        of Legend Financial Advisors, Inc.® (Leg-
                                                                                        end) and is a Non-Commission, Fee-Only
                                                                                        Securities and Exchange Commission
                                                                                        (SEC) registered investment advisory firm.
                                                                                        EmergingWealth provides Investment Man-
agement services to individuals as well as business entities, medical practices and non-profit organizations whose wealth is emerg-
ing. All investment portfolios are sub-advised by Legend. Both Legend and EmergingWealth share a common advisory team,
Investment Committee and Fee Schedule.

                LOUIS P. STANASOLOVICH, CFP®, EDITOR
Louis P. Stanasolovich, CFP® is founder, CCO, CEO and President of Legend Financial Advisors, Inc.®
(Legend) and EmergingWealth Investment Management, Inc.® Lou is one of only four advisors nationwide
to be selected 12 consecutive times by Worth magazine as one of “The Top 100 Wealth Advisors” in the
country. Lou has also been selected 13 times by Medical Economics magazine as one of “The 150 Best
Financial Advisors for Doctors in America”, twice as one of “The 100 Great Financial Planners in America”
by Mutual Funds magazine, five times by Dental Practice Report as one of “The Best Financial Advisors for
Dentists In America” and once by Barron’s as one of “The Top 100 Independent Financial Advisors”. Lou
was selected by Financial Planning magazine as part of their inaugural Influencer Awards for the Wealth
Creator award recognizing the advisor who has made the most significant contributions to best practices
for portfolio management. He has been named to Investment Advisor magazine’s “IA 25” list three times,
ranking the 25 most influential people in and around the financial advisory profession as well as being
named by Financial Planning magazine as one of the country’s “Movers & Shakers” recognizing the top
individuals who have done the most to advance the financial advisory profession.
     2   THE GLOBAL INVESTMENT PULSE, February, 2018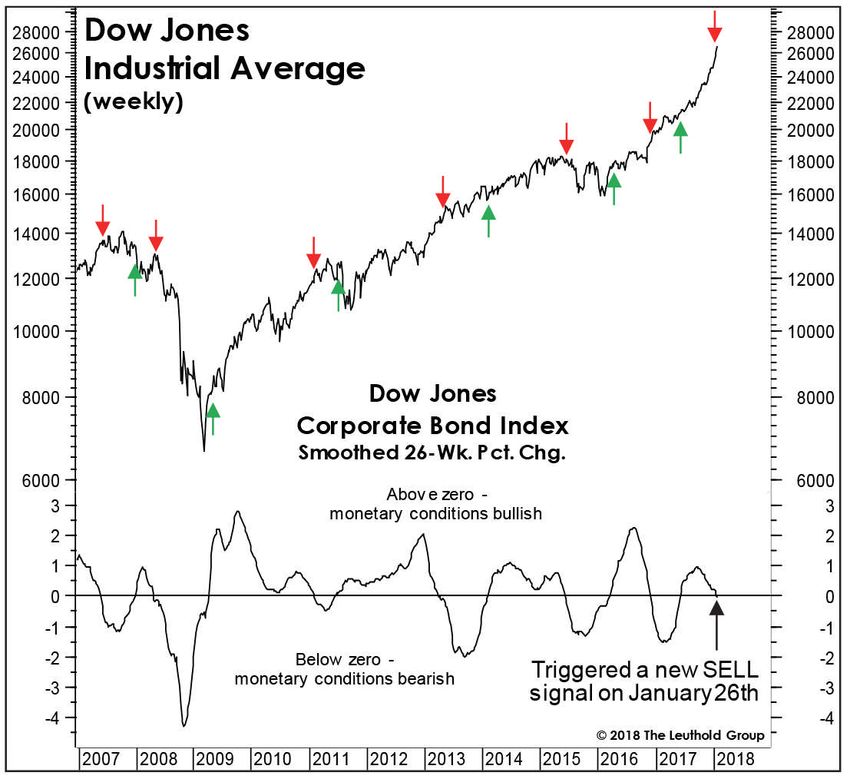
Boom-Bust, continued from page 1
the Boom-Bust Barometer has had a very high positive correla-            As a word of warning, at times the barometer can decrease
tion with the Standard & Poor’s (S&P) 500 since 1966. While              without a recession occurring. However, a drawdown in the S&P
the Boom-Bust Barometer is currently increasing; historically, it is     500 usually occurs. Furthermore, this calculator may work as
unusual to see a major correlation in stock prices. As evidenced         well with other stock indices.
by the Boom-Bust Barometer chart, it is a fairly accurate indica-
tor of recessions.

                                   S&P 500 VERSUS BOOM-BUST BAROMETER
                                     December 31, 1966 To January 31, 2018

                                                                                 SOURCE: BLOOMBERG INVESTMENT SERVICE
                                                                                 COPYRIGHT 2018 LEGEND FIANNCIAL ADVISORS, INC.®

COPYRIGHT 2017 LEGEND FINANCIAL ADVISORS, INC.®

REPRINTED WITH PERMISSION OF LEGEND FINANCIAL ADVISORS, INC.®                                                                           PULSE

                                    10.0% CORRECTIONS WITHIN A 10-DAY PERIOD
                         By Louis P. Stanasolovich, CFP®, CCO, CEO and President of Legend Financial Advisors, Inc.® and
                                                 EmergingWealth Investment Management, Inc.®
Recently, the stock market had a                        Month          Year                         Event                      Recession
10.0% Correction in a 10-day period.
Historically, that type of event does not
                                                May                    1962       Kennedy Slide                                  Yes
usually occur very often except in or
near a recession. Below are the times           October                1987       Stock Market Crash                             Yes
this type of event occurred since 1954.
                                                August                 1998       Long-Term Capital                               No
                                                                                  Management Financial Debacle
COPYRIGHT 2018 LEGEND FINANCIAL
ADVISORS, INC.®                                 April                  2000       Tech Bubble                                    Yes

                                                August                 2011       U.S. Debt Downgraded                            No
REPRINTED WITH PERMISSION OF
LEGEND FINANCIAL ADVISORS, INC.®                August                 2015       China Currency Devaluation                      No

                                                January/February       2018       Rising Interest Rates Increased Volatility      No
                                                (9 trading days)

                                                                                                                                        PULSE

                                                                                          THE GLOBAL INVESTMENT PULSE, February, 2018   3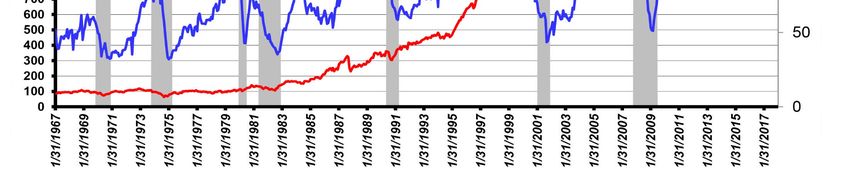
Interest Rate Changes, continued from page 1

years, its overall record in capturing the          signals of 2013 and 2017 led one to miss             Leuthold Group, LLC, (Perception
market’s major swings has been respect-             out on some of those years’ terrific gains.          Express, February 7, 2018), http://leuth.
able. The April 2008 “Sell” signal was                                                                   us/stock-market
terrific, and the indicator did not recom-          For an indicator that is “independent” of
mend reentering the market until almost             stock prices, however, its historical record         COPYRIGHT 2018 THE LEUTHOLD
a year later with the Dow Jones Industrial          has been exceptional.                                GROUP, LLC
Average 37.0% lower.
                                                    Source: This article was excerpted                   REPRINTED WITH PERMISSION OF
On the other hand, the spring 2011 “Buy”            from “Rates: Does Trend Or Level                     THE LEUTHOLD GROUP, LLC
signal occurred right in front of that year’s       Matter More?”, by Doug Ramsey, CFA,
third-quarter collapse, and the brief “Sell”        CMT, Chief Investment Officer, The

   As of: February 7, 2018                           Source: The Leuthold Group, LLC, Perception Express, February 7, 2018, http://leuth.us/stock-market
                                                     REPRINTED WITH PERMISSION FROM THE LEUTHOLD GROUP, LLC

                                                                                                                                                  PULSE

                                               WHAT IS THE DOW BOND OSCILLATOR?
                          By Louis P. Stanasolovich, CFP®, CCO, CEO and President of Legend Financial Advisors, Inc.® and
                                                  EmergingWealth Investment Management, Inc.®

The model looks at how quickly returns are weakening in corporate credit. Namely, it’s the 10-week exponential moving average
of the 26-week percentage change in the Dow Jones Corporate Bond Index (which measures price, the reciprocal of yields). The
lower it goes, the tighter monetary conditions, and therefore worse for stocks.

It’s the rate-of-change in bonds, not the bond yield level, that has the stronger impact on the stock market.

COPYRIGHT 2018 LEGEND FINANCIAL ADVISORS, INC.®

REPRINTED WITH PERMISSION OF LEGEND FINANCIAL ADVISORS, INC.®
                                                                                                                                                  PULSE

        4     THE GLOBAL INVESTMENT PULSE, February, 2018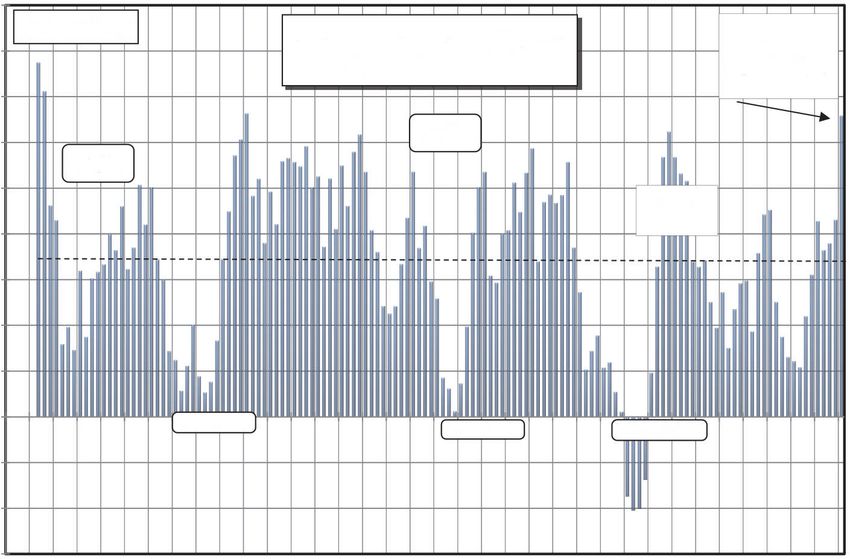
MONTHLY RISK AVERSION INDEX (RAI)
                  RISK INDEX INCREASES SLIGHTLY-STILL NEAR LOWEST LEVEL EVER

 Note: The Risk Aversion Index combines ten market-based measures including various credit and swap spreads,
       implied volatility, currency movements, commodity prices and relative returns among various high- and low-risk
       assets.

4                                                                                                                                                      4

3                                                                                                                                                      3

2                                                                                                                                                      2

1                                                                                                                                                      1

0                                                                                                                                                      0

    1980   1982   1984   1986   1988   1990   1992   1994   1996   1998   2000   2002   2004    2006    2008      2010   2012   2014   2016 2018

As of: February 7, 2018                                               Source: The Leuthold Group, LLC, Perception Express, February 7, 2018,
                                                                                    http://leuth.us/bond-market
COPYRIGHT 2018 THE LEUTHOLD GROUP, LLC
                                                                      REPRINTED WITH PERMISSION FROM THE LEUTHOLD GROUP, LLC

“Do You Want A Second Opinion?”
        To see if your investment portfolio is built to
    navigate the pitfalls and opportunities ahead, call us
             today for a “Free Second Opinion”
                       at (888) 236-5960
     www.legend-financial.com
                                                                                            THE GLOBAL INVESTMENT PULSE, February, 2018            5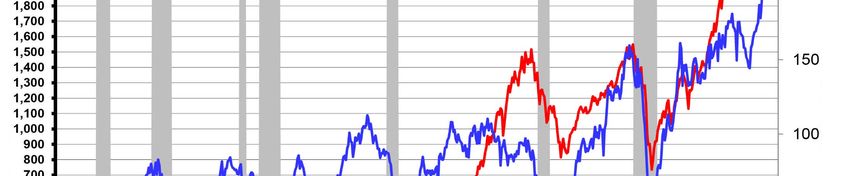
Low Volatility, continued from page 7

                                        CHART 2
             LEUTHOLD 3000 LOW VOLATILITY INDEX RELATIVE PRICE-TO-EARNINGS
                         RATIO VERSUS LEUTHOLD 3000 UNIVERSE

                                                                                                             November 2008
         1.20                                                                                                                                        1.20

         1.15                                                                                                        July 2016                       1.15

         1.10                                                                                                                                        1.10
                                                                     May 2003                                                               1.07
         1.05                                                                                                                                        1.05

         1.00                           October 1990                                                                                                 1.00
                                         September 1998
         0.95                                                                                                                                        0.95

         0.90                                                                                                                                        0.90

         0.85                                                                                                                                        0.85
                                                                                                                           Median = 0.85
         0.80                                                                                                                                        0.80

         0.75                                                                                                                                        0.75

         0.70                                                                                                                                        0.70
                             May 1987                                        March 2000
         0.65                                                                                                                                        0.65

                  86      88       90    92   94       96       98      00      02     04     06      08     10      12      14     16      18
    As of: February 7, 2018                                 Source: The Leuthold Group, LLC, Perception Express, February 7, 2018, http://leuth.us/stock-market
    COPYRIGHT 2018 THE LEUTHOLD GROUP, LLC                  REPRINTED WITH PERMISSION FROM THE LEUTHOLD GROUP, LLC

                                                                             CHART 3

                                                                  Low Volatility
                                                                   Relative P/E
                                                                   (right scale)

                                                                                                  10-Year Treasury
                                                                                                     Bond Yield
                                        1986-to-date median = 0.85x                             (inverted, left scale)

     As of: February 7, 2018                                Source: The Leuthold Group, LLC, Perception Express, February 7, 2018, http://leuth.us/stock-market
     COPYRIGHT 2018 THE LEUTHOLD GROUP, LLC                 REPRINTED WITH PERMISSION FROM THE LEUTHOLD GROUP, LLC

                                                                                                                                                            PULSE

        6       THE GLOBAL INVESTMENT PULSE, February, 2018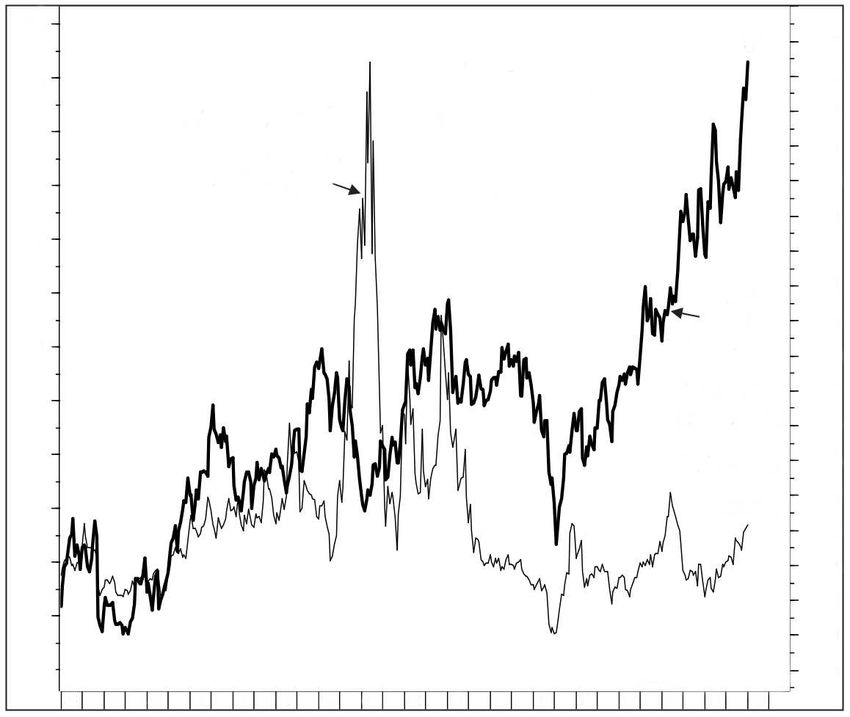
WILL INTEREST RATES KILL THE LOW VOLATILITY MANIA?
                              By Doug Ramsey, CFA, CMT, Chief Investment Officer, The Leuthold Group, LLC
While there are many parallels between         of growth stocks. Eighteen years later               vary inversely with swings in bond yields.
recent action and that of 1999-2000,           (maybe not coincidentally the length of a            However, Low Volatility stocks seem to
stock market leadership is not one of          “Saros” cycle in astronomical research),             have ignored the five-month spike in
them. The August-January up leg (move-         years of sluggish economic growth and                bond yields (Perhaps February’s early
ment) was—like most other legs of the          meager fixed income coupons have led to              action is payback for that oversight.). If
post-2008 bull market—led by Low Vola-         what we believe is an historic mispricing            Chart 3, on the bottom of page 6, is on
tility stocks, which closed January, 2018      of stock market “stability”.                         target, Low Volatility stocks should soon
at a record-high median [half the Price-                                                            move to a P/E discount.
To-Earnings Ratio (P/E) are above that         On a relative valuation basis, Low Volatil-
number, half the P/Es are below] trailing      ity stocks have been near or above cur-              Source: This article was excerpted
P/E ratio of 26.4x (Chart 1, below). The       rent levels several times (Chart 2, on the           from “Will Rates Kill The Low Vol
High Beta universe trades at a similar         top of page 6); in prior cases, each was             Mania?”, by Doug Ramsey, CFA, CMT,
multiple (26.9x), but that figure sits near    a juncture of stock market or economic               Chief Investment Officer, The Leuthold
its long-term median and is less than          angst (or both). It’s hard to explain why            Group, LLC, (Perception Express, Feb-
one-fourth of the level seen at the Y2K        the P/E premium exists in what is clearly            ruary 7, 2018), http://leuth.us/stock-
peak.                                          the most euphoric stock market environ-              market
                                               ment since the Technology bubble.
Bob Farrell of Merrill Lynch fame once                                                              COPYRIGHT 2018 THE LEUTHOLD
said, “Excesses in one direction will lead     Although many of the Large Cap Technol-              GROUP, LLC
to an opposite excess in the other direc-      ogy stocks squeezed their way in to the
tion.” In the 1990s, years of robust eco-      Low Volatility universe the last few years,          REPRINTED WITH PERMISSION OF
nomic growth led to a historic mispricing      their relative valuations have continued to          THE LEUTHOLD GROUP, LLC

                                               CHART 1
                              LOW VOLATILITY VALUATIONS GOING VERTICAL!
      120
                                                                                                                                                 27
                                                                                                                                26.4x
      110                                                                                                                                        26
                                      Leuthold 3000                                                                                              25
      100                            High Beta Index –
                                      Median P/E on                                                                                              24

       90                              Trailing EPS                                                                                              23
                                        (left scale)                                                                                             22
       80
                                                                                                                                                 21

       70                                                                                                                                        20
                                                                                                                           L3000
                                                                                                                            Low                  19
       60                                                                                                                Volatility              18
                                                                                                                          Index –                17
       50                                                                                                              Median P.E.
                                                                                                                                                 16
                                                                                                                        on Trailing
       40                                                                                                                   EPS                  15
                                                                                                                       (right scale)
                                                                                                                                                 14
       30                                                                                                                      26.9x
                                                                                                                                                 13

       20                                                                                                                                        12

                                                                                                                                                 11
       10
                                                                                                                                                 10

                                                                                                                                                 9
            86    88     90     92     94     96    98      00     02      04      06     08      10      12      14       16      18
  As of: February 7, 2018                      Source: The Leuthold Group, LLC, Perception Express, February 7, 2018, http://leuth.us/stock-market
  COPYRIGHT 2018 THE LEUTHOLD GROUP, LLC       REPRINTED WITH PERMISSION FROM THE LEUTHOLD GROUP, LLC

                                                                                                           Low Volatility, continued on page 6

                                                                                            THE GLOBAL INVESTMENT PULSE, February, 2018          7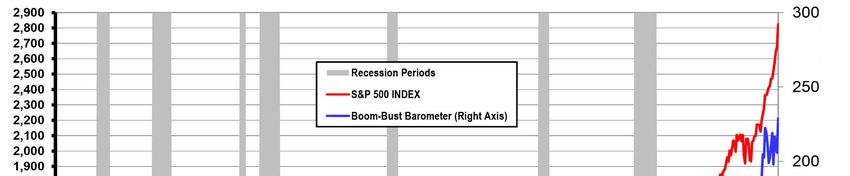
JANUARY MOMENTUM CAN LEAD TO CONTINUED GAINS
                                  A Big January Is A Great Sign For More Strength
      Year            S&P 500              January Return            Rest of Year              Full Year             Intrayear Pullback

      1951              21.66                   6.0%                    9.7%                   16.3%                       -8.1%

      1954              26.08                   5.1%                   38.0%                   45.0%                       -4.4%

      1961              61.78                   6.3%                   15.8%                   23.1%                       -4.4%

      1967              86.61                   7.8%                   11.4%                   20.1%                       -6.6%

      1975              76.98                  12.3%                   17.2%                   31.5%                     -14.1%

      1976             100.86                  11.8%                    6.5%                   19.1%                       -8.4%

      1980             115.12                   6.7%                   17.9%                   25.8%                     -17.1%

      1985             179.63                   7.4%                   17.6%                   26.3%                       -7.7%

      1987             274.08                  13.2%                    -9.9%                   2.0%                     -33.5%

      1989             297.47                   7.1%                   18.8%                   27.3%                       -7.6%

      1997             786.16                   6.1%                   23.4%                   31.0%                     -10.8%

      2013           1498.11                    5.0%                   23.4%                   29.6%                       -5.8%

      2018           2822.43                    5.6%                         ?                      ?                           ?

                           Average                                     15.8%                   24.8%                     -10.7%

                            Median                                     17.4%                   26.1%                       -7.9%

                           % Higher                                    91.7%                 100.0%
As of: February 5, 2018                              Source: LPL Research, FactSet 1/30/18 via 361 Capital, LLC, Weekly Research Briefing,
COPYRIGHT 2018 361 CAPITAL, LLC                              February 7, 2018, www.361capital.com
                                                     REPRINTED WITH PERMISSION FROM THE LEUTHOLD GROUP, LLC

                                                     FED WATCH
                                  INTEREST RATES AS OF FEBRUARY 28, 2018

                                         Fed Funds Rate Range:                             1.25% to 1.50%

                                         Fed Discount Rate:                                       2.00%

                                  2018 UPCOMING FED MEETINGS SCHEDULE

                          March 20-21                                                         September 25-26

                          May 1-2                                                                 November 7-8

                          June 12-13                                                           December 18-19

                          July/August 31-1

  8    THE GLOBAL INVESTMENT PULSE, February, 2018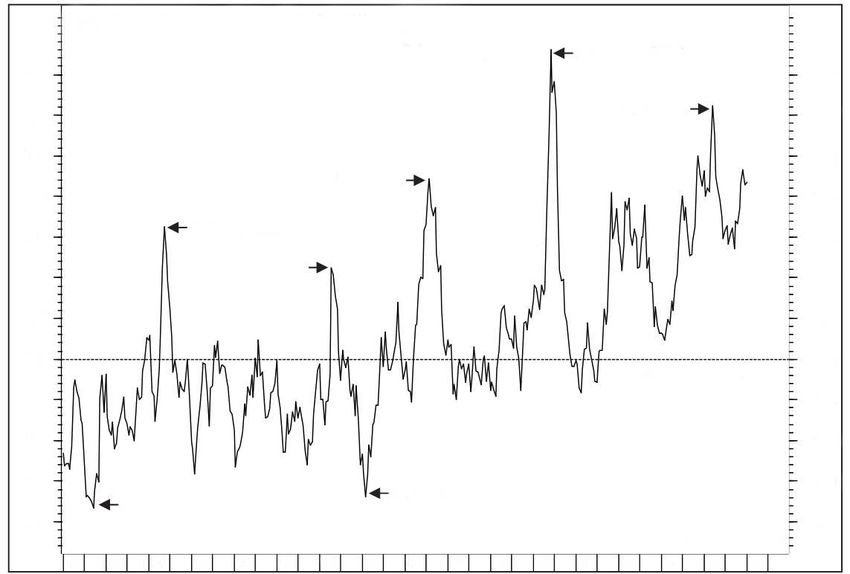
BOTH STOCKS AND BONDS NEGATIVE IN 2018? NOT LIKELY
                                    By James J. Holtzman, CFP®, Legend Financial Advisors, Inc.® and
                                           EmergingWealth Investment Management, Inc.®

The total return of stocks, as represented by the S&P 500, and the total return on bonds, as represented by the Bloomberg Barclays
U.S. Aggregate Bond Index, have not been negative in the same year at any time over the last 40 years, i.e., 1978 to 2017. That fact
should calm most investors who are concerned that there will be a meltdown of their entire portfolios. However, this assumes that
portfolios have both stocks and bonds in them.

Also, given the low yields of bonds (2.0% to 3.0%) and other debt securities of all types, it is unlikely that much protection will be of-
fered by debt investments on a total return basis for a balanced portfolio (Example: 50.0% Equity, 50.0% Debt). Portfolios that have
significantly more debt investments in them (Ex. 90.0%) will offer the most protection. Such portfolios will also offer very low returns.

(Source of Facts: Bloomberg Barclays)
                                                                                                                                                   PULSE

                         JANUARY WAS POSITIVE: GOOD TIMES FOR 2018 AHEAD?
                              By Doug Ramsey, CFA, CMT, Chief Investment Officer, The Leuthold Group, LLC
                                         Excerpted by Diane M. Pearson, CFP®, PPCTM, CDFA®,
                          Legend Financial Advisors, Inc.® and EmergingWealth Investment Management, Inc.®
The market’s stumble in early February was
so abrupt that there was no time for market
numerologists to bask in the limelight of the     JANUARY VERSUS ANY OTHER MONTH AS A PREDICTOR OF THE STOCK
bullish January Barometer, which holds that                    MARKET’S NEXT ELEVEN MONTHS, 1915 TO 2017
a stock market gain during the first month of      (“Hit Ratio” = Percentage Of Time Dow Jones Industrials Moved In Same
the year is a sign of gains for the remainder              Direction As Latest Month Over The Next Eleven Months)
of the year. Is there any truth to this old                                     Up Market              Down Market             Total Hit
market maxim?                                                                  Hit Ratio (%)           Hit Ratio (%)           Ratio (%)
                                                               January               77                      42                    64
The Leuthold Group designed a study that
eliminates the common flaw in other analy-                     February              75                      34                    57
ses, which is that a market gain in January                    March                 96                      32                    54
(and especially one as large as this year’s                    April                 70                      39                    58
Dow Jones Industrial Average increase of                       May                   73                      32                    54
5.9%) will by definition lift the probability
that the full year will show a gain. The rel-                  June                  74                      38                    56
evant question is whether January is more                      July                  66                      37                    55
predictive of the following eleven months’                     August                69                      34                    55
market action than any other month.                            September             67                      34                    48

Accuracy Good, But No Certainty:                               October               62                      24                    46
                                                               November              71                      41                    50
The answer is yes, based on historical “hit                    December              63                      38                    57
ratios” for both up and down markets in Jan-                   Average               70                      35                    55
uary. The “edge,” though, is certainly not
                                                       As of: February 7, 2018
one to bet the farm on. A January gain, for            COPYRIGHT 2018 THE LEUTHOLD GROUP, LLC
                                                                                                Source: The Leuthold Group, LLC, Perception Express,
                                                                                                        February 7, 2018, http://leuth.us/stock-market
example, has been followed by gains over                                                        REPRINTED WITH PERMISSION FROM THE LEUTHOLD GROUP, LLC

the next eleven months 77.0% of the time—        Conclusion:
only a bit higher than the overall 70.0%
average that any month’s market increase         In all, there’s at least a shard of truth in the notion that January’s stock market perfor-
portends a gain over the subsequent eleven       mance
months. See the chart to the right.              sets the tone for the remainder of the year. There’s not a lot of predictive information
                                                 here—just a little more than that of any other month.
Betting On Market Declines:
                                                 Source: This article was excerpted from “How About That January?!”, by Doug
What about the downside? Betting on a            Ramsey, CFA, CMT, Chief Investment Officer, The Leuthold Group, LLC, (Per-
market decline for any eleven-month period       ception Express, February 7, 2018), http://leuth.us/stock-market
is statistically a bad idea, but the best odds
(at a relatively low 42.0%) for doing so oc-     COPYRIGHT 2018 THE LEUTHOLD GROUP, LLC
cur following a January decline. As with the
up-market ratio, this January down market        REPRINTED WITH PERMISSION OF THE LEUTHOLD GROUP, LLC
“hit ratio” is 7.0% higher than the average of
all months’ results (35.0%).                                                                                                                      PULSE

                                                                                                THE GLOBAL INVESTMENT PULSE, February, 2018        9
Extreme Momentum, continued from page 11

                                                           TABLE 1

            As of: February 7, 2018                           Source: The Leuthold Group, LLC, Perception Express,
            COPYRIGHT 2018 THE LEUTHOLD GROUP, LLC                    February 7, 2018, http://leuth.us/stock-market
                                                              REPRINTED WITH PERMISSION FROM THE LEUTHOLD GROUP, LLC

                                                                                                                   PULSE

       10    THE GLOBAL INVESTMENT PULSE, February, 2018
IMPLICATIONS OF EXTREME MOMENTUM
By Doug Ramsey, CFA, CMT, Chief Investment Officer, The Leuthold Group, LLC
Historically, leadership (of a particular Many technicians will describe a market Across all 21 cycles, the S&P 500 had
style, category, asset class and/or sector) as “overbought,” (The Leuthold Group a median gain of +18.4% over a median
and breadth (how broad it is) accompany- does not agree) since the term itself im- span of 59 weeks from the bull market
ing an upside market move is far more plies that prices have outdone themselves momentum peak to its final price peak.
predictive than the pure momentum of the and are perhaps due for a kind of rubber- Based purely on the market’s recent
move. However, when intermediate-term band like recoil. This may be true in the momentum, a push to even higher highs
momentum is not just strong, but excep- very short-term (such as the next month could be in the cards for 2018.
tionally so (as it was until just recently), or two). Historically, when momentum
there has usually been even more market reaches its high for a bull market cycle (a Source: This article was excerpted
upside to follow over the next several fact which obviously can only be known in from “Implications of Extreme Momen-
months. hindsight), the market has been far more tum?”, by Doug Ramsey, CFA, CMT,
prone to move higher over the following Chief Investment Officer, The Leuthold
In January, the Standard & Poor’s (S&P) 6-12 months than to top out. Group, LLC, (Perception Express,
500 momentum index had made a new February 7, 2018), http://leuth.us/stock-
bull market high in late December on the Table 1, on page 10, shows that only two market
basis of the Leuthold Group’s preferred of the 21 cyclical bull market peaks since
intermediate-term measure: the 14-Week 1900 have coincided with the bull mar- COPYRIGHT 2018 THE LEUTHOLD
Relative Strength Index (RSI). January’s ket peak in the 14-Week RSI. With the GROUP, LLC
upside explosion generated three more exception of those two instances, the bull
cycle highs in this momentum measure, lasted at least another 21 weeks beyond REPRINTED WITH PERMISSION OF
culminating in the most overbought RSI the date of the momentum peak. The THE LEUTHOLD GROUP, LLC
reading in the history of the S&P 500 (91) best follow-through from an extreme mo-
on January 26th. This could very well be mentum reading occurred in the 1990s’
the momentum high for this cycle. (See bull, when the market pushed higher for
chart below.) almost four years beyond its momentum
peak.
CHART 1
As of: February 7, 2018 Source: The Leuthold Group, LLC, Perception Express, February 7, 2018, http://leuth.us/stock-market
COPYRIGHT 2018 THE LEUTHOLD GROUP, LLC REPRINTED WITH PERMISSION FROM THE LEUTHOLD GROUP, LLC
Extreme Momentum, continued on page 10
THE GLOBAL INVESTMENT PULSE, February, 2018 11COBALT – THE NEXT GREAT RARE EARTH/STRATEGIC METAL?
By Frank Holmes, CEO and Chief Investment Officer, U.S. Global Investors
Excerpted by Louis P. Stanasolovich, CFP®, CCO, CEO and President of
Legend Financial Advisors, Inc.® and EmergingWealth Investment Management, Inc.®
Cobalt has made stunning moves in the according to the Fortune Global 500. Also, sure to make investors happy, the
past three years on red hot demand, This would make sense, as Glencore— company also declared a distribution of
rising nearly 180.0%. The brittle bluish- the best-performing London-listed miner $2.9 billion, or $0.20 per share, to be paid
white metal is used in the production of last year, finishing up 41.0%—has been in two installments this year.
lithium-ion batteries, which power smart- positioning itself as the go-to supplier of
phones and electric vehicles (EV), among not just cobalt but other metals that are The earnings report made no mention of
other things. See “Cobalt Prices Con- used in so-called clean tech, including Apple—or smartphones, for that mat-
tinue to Surge on Electric Car Demand” copper, nickel, and zinc. ter—but it did emphasize the high rate
chart on the top of page 13. of growth in electric vehicle investment,
Apple is one of the world’s largest end which is expected to greatly benefit cobalt
According to mining consultant CRU users of cobalt for the batteries inside of demand.
Group, cobalt demand exceeded 100,000 its various gadgets, but up until now left
metric tons for the first time last year, and the business of buying the metal to the “Global automaker investments now total
over the next 10 years, it’s projected to companies that make its batteries. With more than $90 billion, with at least $19
grow at a compound annual growth rate the rapid growth in battery demand for billion attributed to the U.S., $21 billion
(CAGR) of 11.6%. electric vehicles threatening to create a to China and $52 billion to Germany,”
shortage of raw material, the tech giant Glasenberg writes. “Volkswagen alone
Warning: Approximately two-thirds of the maker is “keen to ensure that cobalt sup- plans to spend $40 billion by 2030 to
world’s cobalt is mined in the highly un- plies for its iPhone and iPad batteries are build electrified versions of over 300
stable Democratic Republic of the Congo. sufficient,” the story continues. This is models.”
A supply shortage is likely brewing. See almost reminiscent of when Ford started
“Cobalt Use in Electric Vehicles and switching to a more palladium centric Over the next three years, Glencore’s
Other Lithium-Ion Battery Applications” catalyst for emission and drove the price cobalt production growth is projected at
chart on the bottom of page 13. up ten-fold to later fall about 80.0%. 133.0%, followed by nickel at 30.0% and
However, the next generation of batter- copper at 25.0%.
“There just isn’t enough cobalt to go ies may be cobalt free, as Nano One had
around,” George Heppel, a CRU consul- developed one for commercial testing - a This year alone, the company believes
tant, told Bloomberg in January. “The high voltage spinel (HVS) using lithium, it will produce as much as 39,000 metric
auto companies that’ll be the most suc- manganese and nickel. Besides avoiding tons of cobalt, up 42.0% from 27,400 tons
cessful in maintaining long-term stability the high cost and supply chain risk of co- last year.
in terms of raw materials will be the ones balt, the higher six-volt cells would mean
that purchase the cobalt and then supply fewer battery cells needed, less weight,
that to their battery manufacturers.” less cost extending range, longer lifetime Source: This article was excerpted
or better warranties, greater storage, from “Gold And The Global Ticking
Automakers aren’t the only ones with this faster charging and more power. Debt Bomb”, by Frank Holmes, CEO
idea. Bloomberg reported this week that and Chief Investment Officer, U.S.
Apple, the world’s largest end user of Glencore Announces $2.9 Billion In Global Investors, (Advisor Alert, Feb-
cobalt, is in talks to buy the metal directly Dividends In 2018: ruary 23, 2018), www.usfunds.com
from miners, a move that could save the
iPhone-maker many billions of dollars. Furthermore, Glencore stock jumped COPYRIGHT 2018 U.S. GLOBAL IN-
more than 5.0% on February 21, 2018 VESTORS
Although details are scarce at this point, after the company reported phenomenal
Bloomberg writes that “Apple is seeking performance in 2017 that CEO Ivan REPRINTED WITH PERMISSION OF
contracts to secure several thousand Glasenberg describes as “our strongest U.S. GLOBAL INVESTORS
metric tons of cobalt a year for five years on record.” Earnings before interest,
or longer.” taxes, depreciation and amortization
(EBITDA) rose 44.0% year-over year,
One of the miners the company is ru- from $10.3 billion to $14.8 billion, led by
mored to be speaking with is Switzerland- higher commodity prices and “enhanced”
based Glencore, the 14th largest com- mining margins.
pany in the world by revenue as of 2016,
Cobalt, continued on page 13
12 THE GLOBAL INVESTMENT PULSE, February, 2018Cobalt, continued from page 12
COBALT PRICES CONTINUE TO SURGE ON ELECTRIC CAR DEMAND
February 1, 2015 To February 27, 2018
As of: February 23, 2018 Source: Bloomberg via U.S. Global Investors, Advisor Alert, February 23, 2018,
www.usfunds.com
COPYRIGHT 2018 U.S. GLOBAL INVESTORS
REPRINTED WITH PERMISSION FROM U.S. GLOBAL INVESTORS
COBALT USE IN ELECTRIC VEHICLES AND
OTHER LITHIUM-ION BATTERY APPLICATIONS
Projections In Thousands of Metric Tons
400
300
200
100
2016 2017 2020 2025 2030
As of: February 23, 2018 Source: Bloomberg, Darton Commodities via U.S. Global Investors, Advisor
COPYRIGHT 2018 U.S. GLOBAL INVESTORS Alert, February 23, 2018, www.usfunds.com
REPRINTED WITH PERMISSION FROM U.S. GLOBAL INVESTORS
PULSE
THE GLOBAL INVESTMENT PULSE, February, 2018 132018 YEAR-TO-DATE PERFORMANCE
January 1, 2018 to January 31, 2018
(1 month)
2018
Year-To-Date
Consumer Price Index (Inflation) 0.54%
90-Day Treasury Bills Index-Total Return 0.12%
Bloomberg Intermediate Term Corporate Bond Index -0.79%
Barclays Aggregate Bond Index-Total Return -1.15%
High Yield Corporate Bond Index – Total Return 0.14%
S&P Leveraged Loan Index – Total Return 0.99%
HFRX Global Hedge Fund Index 2.45%
S&P 500 Index (U.S. Stock Market) 5.72%
MSCI EAFE Index (Developed Foreign Equities) 5.03%
MSCI Emerging Market Index (Equities) 8.32%
Newedge CTA Index (Managed Futures) 3.90%
Dow Jones–UBS Commodity Index-Total Return (USD)** 1.85%
Dow Jones U.S. Real Estate Index-Total Return (USD)** -2.85%
Gold Bullion 2.27%
As of: January 31, 2018
Compound and Total Returns include reinvested dividends. Newedge Index is equally-weighted.
** USD = U.S. Dollar
Source: Bloomberg Investment Service COPYRIGHT 2018 LEGEND FINANCIAL ADVISORS, INC. ®
REPRINTED WITH PERMISSION OF LEGEND FINANCIAL ADVISORS, INC. ®
14 THE GLOBAL INVESTMENT PULSE, February, 2018UP/DOWN EARNINGS: POP GOES THE RATIO
By Doug Ramsey, CFA, CMT, Chief Investment Officer, The Leuthold Group, LLC
We kick off the 4th quarter (4Q) 2017 earnings season with our Up/Down Ratio soaring to an impressive reading of 2.65. Surpris-
ingly, nine years into the current recovery, this is the highest “one-month” reading we’ve seen since 1993. Before we break out
into a chorus of “Good Times Are Here Again,” please note that January has the lightest volume of “one-month” numbers—roughly
half of April, July, and October’s figures. A very, very impressive start to 4Q, but hold tight for a bigger sample size. See “Earnings
Advance/Decline Ratio” chart below.
Source: This article was excerpted from “Up/Down Earnings: Pop Goes The Ratio”, by Doug Ramsey, CFA, CMT, Chief
Investment Officer, The Leuthold Group, LLC, (Perception Express, February 7, 2018), http://leuth.us/stock-market.
3.25
The Leuthold Group
Copyright © 2018 EARNINGS ADVANCE/DECLINE RATIO
3.00 First Month Of Each Quarterly Period Earnings Reports
Based On Reported Earnings For Jan. 2018
(Q4 2017 Results)
2.75
SOFT
2.50 LANDING
SOFT
LANDING
2.25
AVERAGE
1.83
2.00
1.75
1.50
1.25
1.00
RECESSION
RECESSION RECESSION
0.75
0.50
0.25
83 84 85 86 87 88 89 90 91 92 93 94 95 96 97 98 99 00 01 02 03 04 05 06 07 08 09 10 11 12 13 14 15 16 17
Source: The Leuthold Group, LLC, Perception Express, February 7, 2018,
As of: February 7, 2018 http://leuth.us/market-internals
REPRINTED WITH PERMISSION FROM THE LEUTHOLD GROUP, LLC
PULSE
RECESSION PROBABILITIES
1Q 2Q 3Q 4Q
Current Average Current Average Current Average Current Average
USSECULAR BEAR MARKET WATCH
April 1, 2000 to January 31, 2018
(17 years and 10 months)
Annual Total
Compound Return Return
Consumer Price Index (Inflation) 2.09% 44.78%
90-Day Treasury Bills Index-Total Return 1.55% 31.51%
Barclays Aggregate Bond Index-Total Return 4.96% 137.38%
High Yield Corporate Bond Index – Total Return 8.95% 361.82%
S&P Leveraged Loan Index – Total Return 4.96% 137.38%
HFRX Global Hedge Fund Index 2.68% 60.29%
S&P 500 Index (U.S. Stock Market) 5.64% 166.42%
MSCI EAFE Index (Developed Foreign Equities) 4.28% 111.12%
MSCI Emerging Market Index (Equities) 8.09% 300.90%
Newedge CTA Index (Managed Futures) 4.85% 133.07%
Dow Jones–UBS Commodity Index-Total Return (USD)** -0.52% -8.85%
Dow Jones U.S. Real Estate Index-Total Return (USD)** 10.46% 490.80%
Gold Bullion 9.17% 379.06%
As of: January 31, 2018
Compound and Total Returns include reinvested dividends. MSCI Indexes do not include dividends prior to 2002. Newedge Index is
equally-weighted. SECULAR BEAR MARKET WATCH (CONTINUED)
** USD = U.S. Dollar April 1, 2000 COPYRIGHT
to January 201831,
LEGEND2018FINANCIAL ADVISORS, INC. ®
Source: Bloomberg Investment Service (17 years REPRINTED WITH PERMISSION OF LEGEND FINANCIAL ADVISORS, INC. ®
and 10 months)
Note: During Secular Bear markets U.S. Stocks have historically returned a little more than inflation or a little less than
inflation—plus or minus 1.50%—and generally last between 15 to 25 years. The last Secular Bear market (1966 to 1982)
lasted 17 years and underperformed inflation by approximately one-half of one percent per year. The other Secular
Bear markets since 1900 were 1901 to 1920 and 1929 to 1949. In both cases, the U.S. Stock market outperformed
inflation by approximately 1.50% per year. All of the aforementioned performance numbers are pre-tax.
The performance of the U.S. Stock market so far in the current period (April 1, 2000 to the present) certainly appears to
indicate that we are in a Secular Bear market. Long-term returns (over the next 10 years) for the S&P 500 will probably
be slightly worse than the last 17 years and 01 months. Current 10 year normalized P/Es (long-term valuations)
indicate approximate annual compound returns of slightly less than 3.00% over the next 10 years. Of course during
the next 10 years, returns during various periods will be significantly higher and lower than the expected return. For
example, the more the stock market rises in the near term, the less returns after that period will be and vice versa.
16 THE GLOBAL INVESTMENT PULSE, February, 2018LEGEND FINANCIAL ADVISORS, INC.® &
EMERGINGWEALTH INVESTMENT MANAGEMENT, INC.’S®
INVESTMENT MANAGEMENT SERVICES
Legend Financial Advisors, Inc.® (Legend) and EmergingWealth Investment Management, Inc.® (EmergingWealth) offer
Personalized Investment Management Services to individuals and institutions. Investment portfolios are developed to
match the client’s return and risk requirements, which are determined by the clients’ completion of a Risk Comfort Zone
Questionnaire, with the guidance of a Legend Wealth Advisor or EmergingWealth Advisor, respectively. Each type of
investment portfolio is managed to achieve the short, intermediate and long-term investment objectives of the client, as
may be applicable.
INVESTMENT PROCESS
Investment Portfolios:
Unlike most financial advisory firms that offer one style of investment or portfolio type, we offer a wide array of
investment portfolios that usually fit with the large majority of client needs. If necessary, we will create customized
solutions as well. For the types of investment portfolios, please see our Investment Portfolios, Potential Return and
Risk Spectrum Chart on the next page. For a detailed description of our portfolios, please contact Louis P.
Stanasolovich, CFP®, founder, CCO, CEO and President of both firms for a confidential discussion at (412) 635-9210
or e-mail us at legend@legend-financial.com.
Investment Research:
Our Investment Committee performs extensive research to identify opportunities, mitigate risks and structure
investment portfolios. Emphasis is placed on developing portfolios that maximize the potential return relative to the
amount of risk taken.
In-depth due diligence including face-to-face interviews in many instances with portfolio managers for open-end
mutual funds is performed on each investment we select for a portfolio. Factors (both from a qualitative and
quantitative standpoint) that we conduct a thorough analysis of each investment include, but is not limited to, liquidity
(including the primary investment and/or the underlying investments, if utilizing pass through vehicles such as open-
end mutual funds or exchange-traded products), income taxation, all related costs, return potential, drawdown potential
(historical declines from peak-to-trough), volatility and management issues (Anything having to do with the
management team of a stock, open-end mutual fund or an exchange-traded product.).
All portfolios for EmergingWealth are subadvised by Legend.
Client Education:
Education is very important to us. We are dedicated to educating each client about the different investment portfolio
types and how they relate to market volatility, time horizons, and investment returns. It is our goal to ensure that the
client understands and agrees with our investment philosophy. Furthermore, we assist each client in selecting a risk
tolerance level with which they are comfortable. Ultimately, an investment portfolio is designed to meet the client’s
objectives.
PERFORMANCE REPORTING
Many investment firms only offer monthly brokerage statements, which provide minimal information; typically only
account and investment balances. We, on the other hand, provide detailed quarterly reports that outline performance,
income and management fees (among other items) in a simple, easy-to-read report. In addition, each performance
report is sent with an extensive index page that illustrates the investment environment during the reporting period.
FEES
To find out more about the fees for either Legend or EmergingWealth’s Investment Management services, please
contact Louis P. Stanasolovich, CFP®, founder, CCO, CEO and President of both firms for a confidential discussion at
(412) 635-9210 or e-mail us at legend@legend-financial.com.
THE GLOBAL INVESTMENT PULSE, February, 2018 17® ®
LEGEND FINANCIAL ADVISORS, INC. AND EMERGINGWEALTH INVESTMENT MANAGEMENT, INC.'S
18
INVESTMENT PORTFOLIOS, POTENTIAL RETURN AND RISK SPECTRUM S&P 500 Risk
LOWER RISK (COLD BLUE) MODERATE RISK (WARM) HIGHER RISK (BLAZING HOT)
®
ALL PORTFOLIOS ARE MANAGED BY LEGEND FINANCIAL ADVISORS, INC.
HIGHER
High Quality
100%
Equity
The Portfolios In Red Despite
Their Placement All Have
Legend Multi- Ultra-
THE GLOBAL INVESTMENT PULSE, February, 2018
Similar Potential Return And Strategy Speculative
For A Description Of Risk Profiles 100% 100%
Each Investment Equity Equity
Portfolio Contact One
Of Our Advisors
Global
Global Strategic
Strategic Balanced
Balanced 100%
Global
80.0% Equity Equity
Strategic
20.0% Fixed
Global Balanced
Income
Strategic 70.0% Equity
Balanced 30.0% Fixed
POTENTIAL RETURN
Global Income
60.0% Equity
Strategic
40.0% Fixed
Balanced
Income
Global 50.0% Equity
Strategic 50.0% Fixed
Global Balanced Income
Strategic 40.0% Equity
Balanced 60.0% Fixed
30.0% Equity
Global Past Performance
70.0% Fixed
Strategic Does Not Guarantee
Balanced
Future Results
20.0% Equity
80.0% Fixed
LOWER
LOWER VOLATILITY RISK (VOLATILITY/STANDARD DEVIATION) HIGHER VOLATILITY
© 2014 Legend Financial Advisors, Inc. ® All Rights Reserved
©2014 Legend Financial Advisors, Inc.® All Rights ReservedYou can also read