FEDESSA
European Self Storage
Annual Survey
2018
←
→
Page content transcription
If your browser does not render page correctly, please read the page content below

FEDESSA European Self Storage Annual Survey 2018
FEDESSA | European Self Storage Annual Survey 2018

“The self storage industry in Europe continues to
perform well, with solid returns along with increasing
levels of supply and a strong supply pipeline. However,
this increase in supply combined with the current
economic uncertainty may test certain parts of the
market in the coming years.”
Rennie Schafer, FEDESSA                                   Lagerbox, Dresden, Germany

3

Introduction

This is the seventh consecutive annual survey carried out by the
Federation of European Self Storage Associations (FEDESSA) amongst
its member associations and their member companies. Following the
success of the reports over the last three years, this is the fourth year
it has been produced by JLL.
The survey provides a valuable insight into the industry across Europe. It is aimed at helping investors, funders
and operators in this growing and dynamic market.
The latest data shows that there are nearly 3,800 facilities across Europe, providing over 9.7 million
square metres of space. The more mature markets such as the UK, France and the Netherlands have been
established for more than two decades and between them have 67% of the total self storage current lettable
area of Europe, while emerging markets are expanding rapidly.
JLL and FEDESSA have received responses from operators in 14 countries who operate over 700 facilities
or 2.3 million square metres of lettable space, which totals 24% of the total market. Responses to the Self
Storage Association UK’s (SSA UK) Annual Industry Report 2018 have been added to this report where
appropriate. We are very grateful to the many members who took the time to contribute to the survey.
We hope that you find this report useful and informative and welcome feedback from operators,
owners, suppliers or other readers so that we can continue to improve the report in future years.

                    Rennie Schafer                                            Ollie Saunders
                    Chief Executive Officer                                   Lead Director
                    FEDESSA                                                   European Self Storage, JLL

September 2018
FEDESSA | European Self Storage Annual Survey 2018

  Executive summary

       In 2018, there are

                                                             40%
                                                                                    The European market remains

            3,792                                                                   highly fragmented, with the ten

    =
                                                                                     largest brands across Europe
                                                         of the total facilities            representing just
self storage facilities in Europe                      in Europe are in the UK
                                                                 with
                                                                                                23%
                                                                                    of the total number of facilities
                                                       82% of the facilities
9,707,500
                                                  over                                            and

                                                in the 6 most mature countries                  39%
   square metres of space                                                                  of the total space

     The average amount
                                                         The average rent is
    of storage per capita is

          0.020                                               €262
                                                 per square metre per annum,
                                                                                     There is increasing optimism
  square metres, with only                                                                 in the sector with
                                                  and average occupancy is           three out of four operators
        7         23
                                                                 78%
           out of                                                                           expecting 2018
  countries in Europe having                                                           to be a more profitable
       in excess of this                                                                     year than 2017

The average Current Lettable
     Area (CLA) is now

          3,769                                The average number of full time
                                                  staff per facility is now 1.64,
                                                                                       The number of facilities
                                                                                       with 24 hour access has
        square metres                           a decrease from 1.77 in 2015,
 while the average Maximum                       while the number of part time
                                              staff has increased from 0.23 per
                                                                                    increased from   19% in 2017
   Lettable Area (MLA) is
                                                                                               35% in 2018
          3,989                                 facility in 2015 to 0.34 in 2018          to

        square metres
5

Economic overview

World economic indicators remained broadly favourable during the first half of 2018,
although the trend was stable rather than upwards. Some new risks have also emerged,
notably a US-led tariff war and a rise in oil prices. Overall, growth is seen as robust enough
to withstand these challenges, but further escalation may bring a downside.
A year ago, European growth was outstripping expectations,                            Interest rates are slowly rising. As expected, the US Federal
but 2018 so far has seen a softening. Both Germany and France                         Reserve recently made its seventh successive hike in the
are now expected to see a dip in growth rates this year and                           current cycle. Despite having one of the weaker growth rates,
next, although expansion remains healthy by the standards                             the UK looks to be the most likely to follow, with the Bank
of the recent past. Neither are the Eurozone’s more dynamic                           of England Governor recently delivering an upbeat assessment
economies such as Spain and the Netherlands quite set                                 of the economy. If activity holds up, there is potential for further
to match their recent momentum. Brexit uncertainty also                               steady tightening into next year. In contrast, the European
undermines UK performance, with economic activity revised                             Central Bank (ECB) remains behind the curve. A concern not
sharply down this year and languishing until after the planned                        to derail the fragile Eurozone recovery is expected to result
European Union (EU) exit next year.                                                   in a gentle pace of upward adjustment to rates from 2020.

Figure 1 – European real estate investment volumes

     € Millions
€200,000                                                                                                                                       20%

€150,000
                                                                                                                                               15%

€100,000

                                                                                                                                               10%
 €50,000

      €0      H1   H2   H1   H2    H1    H2     H1    H2    H1    H2      H1   H2    H1       H2   H1      H2   H1      H2   H1      H2   H1   5%

               2008      2009         2010        2011        2012         2013        2014         2015         2016         2017        2018

                                ■ Total European real estate investment    ■ Alternatives     ––– Alternatives share (%)

Source: JLL

There is strong interest in real estate as an asset class with                        markets such as Student Housing, Healthcare and Self Storage.
year-on-year growth in transaction volumes since 2009. We are                         €1 in every €8 is now invested into Alternatives.
also seeing a growing share of transactions into non-traditional

“Self storage is an incredibly exciting industry to be involved in at the moment.
Its counter-cyclical nature gives it a great deal of resilience and we’re noticing
a significant increase in both demand and the competition in the market.”
Simon Vallance, Metro Bank
FEDESSA | European Self Storage Annual Survey 2018

European Self Storage Map
                                                                                   0.025
This map shows the self storage floor area per capita,                             €149
average self storage rent per square metre per
annum and the percentage of the total population
                                                                                    35%
who have moved within the last five years.
We see from the data that countries who have
a high self storage floor area per person also tend
to have the highest propensity to move homes,
most notable in the Scandinavian countries.
                                                                           0.056
                                                                             N/A
                                                                            41%

                                          0.034
                                            €260
                                            33%                            0.007
                                                                            €254
                                                                            22%
               0.052
                 €196
                  25%                                          0.019
                                                                    €256
                                                                    15%
                        0.067
                         €283
                         31%                              0.017
                                                           €196
                                                            22%
                           0.018
                            €268
                             27%

   0.005
       N/A                                0.020
       10%                                  €264
                                            13%

             Self storage floor area per capita (square metres)
             Average self storage rent per square metre per annum
             % population who moved home in the last five years.
                                                                           0.010
                                                                           €360
Source: JLL/Eurostat
                                                                            33%
7

                                  0.043
                                  €218
                                   41%

       0.028
       €242
        32%

                      0.002
                        N/A
                        16%

  0.004
       N/A
       10%
                                           0.001
                                            N/A
                     0.001                  6%
                      N/A
                      10%
0.001
 N/A
 20%

             0.004
              N/A
              7%

                        0.001
                            N/A
                            2%
 0.010
  €265
  20%
                                   0.003
                                    €216
                                    9%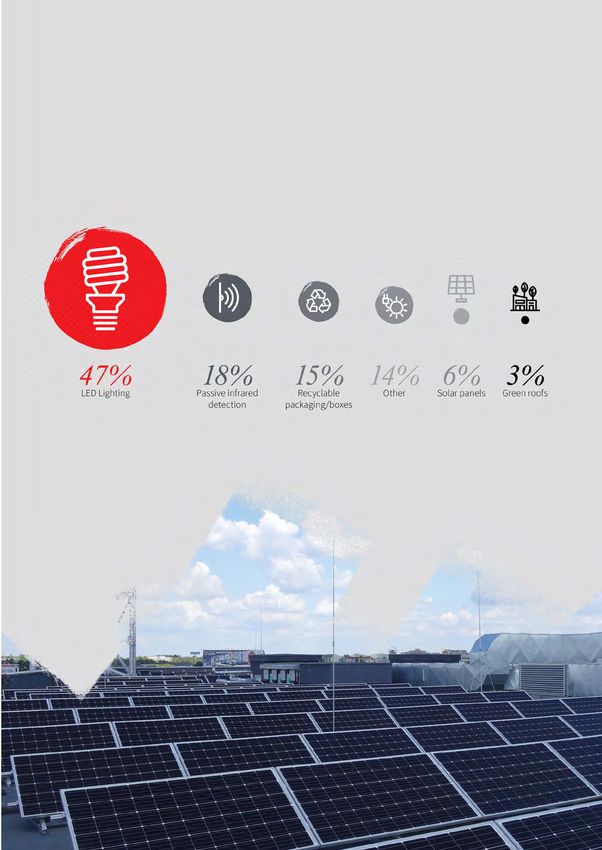
FEDESSA | European Self Storage Annual Survey 2018

                              The impact of the property market on self storage demand
                              A major driver for domestic self storage        The growing number of people living
                              demand is the number of people moving           in cities puts more pressure on urban
                              home. We see this reflected in countries        space, increasing the need for higher
                              that have a higher propensity to move,          density housing and leading to
                              like Norway where 75% of the population         a return of mixed-use developments
                              who rent have moved to a new house              in the residential sector. In Europe,
                              within the last five years, and also where      house prices in cities are rising with
                              domestic users occupy 80% of self               a greater percentage of people renting
                              storage space.                                  and a growing number of micro living
                                                                              schemes being developed.
                              Urbanisation and changing socio-
                              demographics have and will continue             The impact of micro living on self storage
                              to be the most significant trends for global    is that people are becoming more
“The operational              real estate. The majority of countries in       mobile, opting for shorter term leases
                              Europe have growing urban populations;          and living in smaller properties within
characteristics of the        even countries which are experiencing           city centre proximity. With micro living
self storage industry         negative population growth such as              and urbanisation trends set to continue,
                              Spain and Italy are seeing increasing           there are great opportunities for the self
are appealing; a diverse      urbanisation levels. Italy’s total population   storage sector in metropolitan areas.
customer base with            is forecast to decrease by 972,775 over the
                              next 10 years but the urban population
a diverse range of needs      will increase by 1,160,236.
and real potential for
strong management
to drive superior returns.”   European drivers of self storage
Rishi Patel                   Self storage is used by a wide range            starting a family, death in a family,
M3 Capital Partners           of customers for a variety of uses.             entering a relationship, travelling,
                              Around 33% of customers are                     renovating your house or divorce can
                              commercial, often using self storage            all lead to a demand for self storage.
                              as a flexible solution to their business        Interestingly, as this study shows, many
                              storage needs. A large percentage               customers take out their self storage unit
                              of these commercial customers are small         for a specific short term need, but then
                              businesses, e-businesses and other              find the service so convenient that they
                              home based operations. Self storage             keep their unit for a much longer period
                              is also used by large companies looking         of time. Existing customers also have
                              for overflow storage or the ability to          a propensity to re-use self storage.
                              place materials in various locations            Having more people use a service
                              for sales people or retail distribution.        obviously increases demand but in self
                                                                              storage this increase is magnified due to
                              At a domestic level self storage tends
                                                                              customers’ usage patterns and the fact
                              to be initially used at life changing
                                                                              that they often promote self storage to
                              moments. Events like moving house,
                                                                              other potential customers.
9

Key deals
Further to the landmark transactions in 2017 where new
sources of capital invested into the sector, there has been
continued transactional activity in Europe. For the first time
we saw over half of transactions take place outside of the UK.
The key transactions are:
• Angelo Gordon & Co, in a joint venture with BCN Capital
  Partners, acquired Easybox Self Storage S.r.l. in Italy from
  the Fahey family, the previous majority shareholders and
  Caledonia Investments PLC in June 2018. The portfolio
  had an MLA of 45,000 square metres and had a mix of
  mature stabilised assets and those that were in lease up.
• Shurgard acquired five freehold regional properties
  from Pelican in June 2018. The assets had a total MLA
  of around 24,500 square metres and the acquisition
  expanded Shurgard’s portfolio to 36 facilities in Sweden.
  Pelican also disposed of an additional regional satellite
  site in Västerås to a local developer, allowing them to
  focus on Stockholm-based locations.
• Smart Storage was sold to Kangaroo Self Storage in March
  2018 for c. £13 million (c. €14.5 million). The portfolio of six
  facilities are located in the north west of the UK and include
  a mixture of freehold and leasehold assets providing an
  MLA of around 22,500 square metres.
• Armadillo Self Storage added two more properties
  to their portfolio with the acquisition of 1st Storage             Storage King, Milton Keynes, UK
  Centres in the UK in Newcastle and Gateshead in March
  2018. The two modern facilities added 9,800 square metres
  of lettable space to the Armadillo portfolio.                          Bluespace, Barcelona, Spain

• Ready Steady Store acquired two freehold self storage
  facilities in Aylesbury, UK in Q1 2018 formerly trading
  as Store ‘N’ Go and Ace Self Storage, expanding their
  portfolio to 15 sites.
• Armadillo continued their expansion in the UK with
  the freehold acquisition of Storeit4U in Stockton-on-Tees
  in December 2017.
• Storage King expanded their portfolio through the
  acquisition of the former Storage Boost facility in Crewe
  in the north west of the UK in November 2017. The
  property offers 4,400 square metres of lettable space
  and increases the number of branded Storage King
  facilities to 26.
• StorageMart acquired Self Storage Space in Bognor
  Regis in the UK in Q4 2017, adding 2,200 square metres
  to their portfolio and increasing their number of branded
  properties in the UK to 16.
• Storage Giant acquired Your Self Storage in Cannock,
  UK in September 2017 along with an adjoining unit
  (acquired in January 2018) providing the ability for
  further expansion, making this Storage Giant’s fourth
  self storage acquisition in twelve months.
• In March 2017, Bluespace acquired Guardamás, a competitor
  operating a c. 4,250 square metres MLA freehold property
  in Madrid, increasing their portfolio in Spain to 34 assets.
FEDESSA | European Self Storage Annual Survey 2018

Industry overview

Number of facilities                                                      Figure 2 – Percentage share of the total number of facilities in Europe
The self storage industry in Europe continues
to grow. We estimate that there are now 3,792
facilities in total providing over 9,700,000                                                                                   4%           Sweden

square metres of self storage space.
                                                                                                          Germany   6%
Measuring the exact number of self storage
facilities and the space is challenging.
                                                                                Netherlands               8%
There are conflicts in the definition of self
storage, for example some countries include
container storage and others do not. There
                                                                                                                                                             40%
                                                                                                                               Top 6
                                                                                                                                                                     UK
are also a growing number of small self storage
businesses, often co-sharing sites with other                                   Spain    11%
developments on rural land. Every year more
research is put into determining the size of
                                                                                                                              countr
                                                                                                                               by the total number
the industry and improved data does account                                                                                         of facilities
for some of the year-on-year changes.
Six countries have 82% of the total number
of facilities in Europe, slightly lower than 85%                                        France            13%
in 2017, showing that the self storage market is
growing in the less established markets. The UK
market is the largest with 40%of the total number
of European facilities, followed by France, Spain,the                                                                         Others   18%
Netherlands, Germany and then Sweden.                                     Source: FEDESSA/JLL

Market share of the largest operators by number of facilities and space
The self storage market in Europe remains               markets have a small number of larger                                     recent consolidation has further widened
dominated by smaller independent                        operators with 10+ facilities and many                                    the gap. This means new entrants to
operators. Major operators in most                      smaller operators with one to three                                       the market have limited opportunites
countries have less than 50% of the total               facilities – but very few that bridge the                                 to acquire major portfolios and are
number of facilities. There is largely an               gap in between. This is the same even                                     having to consider consolidation or
absence of “mid tier” operators. Most                   in the established UK market where                                        development. This can take many years.

Figure 3 – Market share of the largest operators

70%

60%

50%

40%

30%

20%

10%

 0%
            France

                          Italy

                                          Sweden

                                                                     UK (incl
                                                                  containers)

                                                                                            Netherlands

                                                                                                                    Germany

                                                                                                                                        Belgium

                                                                                                                                                     Spain

                                                   ■ Facilities      ■ Space (square metres)

Source: FEDESSA/JLL
11
Floor area per capita
The amount of self storage available per person is greatest in the UK, with Iceland
and the Netherlands following closely behind. All three countries have nearly three
times more space than the European average, which is 0.020 square metres per
capita. These figures are consistent with those seen last year, which suggest that
when compared with the more mature markets in the US and Australia, which have
0.872 square metres and 0.163 square metres per capita respectively, there are still
opportunities for growth. However, it is unlikely that the amount of self storage space Norway:
26
per person will ever reach the same levels as that of the US, given a number
of factors including the availability and price of land.
Figure 4 – Floor area per capita
facilities for every
0.08
0.07
0.06
0.05
0.04
0.03
0.020
1 million
0.02 people
0.01
0.00
Lithuania
Poland
Czech Republic
Romania
Russia
Estonia
Italy
Latvia
Hungary
Portugal
Germany
Switzerland
Ireland
Austria
Belgium
France
Spain
Norway
Finland
Denmark
Sweden
Netherlands
Iceland
UK (incl
containers)
■ Floor area per capita (square metres) ––– Europe average
Source: FEDESSA/JLL
Greatest amount
In terms of the number of facilities, Norway leads the way with 26 facilities for every
one million people and the Scandinavian countries tend to have a greater number of self storage available
of smaller facilities. per person:
Figure 5 – Number of facilities per million population
UK, Iceland and
30
the Netherlands
25
20
15
10
7.7
5
The European average amount
0
of storage per capita is
Romania
Lithuania
Russia
Poland
Czech Republic
Italy
Latvia
Hungary
Portugal
Estonia
Germany
Austria
Ireland
France
Belgium
Spain
Switzerland
Finland
Sweden
Denmark
Netherlands
Iceland
UK (incl
containers)
Norway
■ Facilities per million population ––– Europe average
0.020
square metres
Source: FEDESSA/JLL
“One would need to be cautious about the speed in which
emerging markets will grow. The challenge is driving awareness
and price sensitivity among customers. But over the medium
term one would expect the storage markets in some of these
countries to grow substantially.”
Rishi Patel, M3 Capital PartnersFEDESSA | European Self Storage Annual Survey 2018
10 European operators
=
The market in Europe remains highly While the largest operators have a smaller
largest self storage brands fragmented, with the largest portfolio share of the total market in terms of
representing only 6.9% of the total facilities, when this is compared with
number of facilities or 12.9% of the the amount of space that they have, the
total space. Figure 6 shows the ten market share is significantly higher, which
largest self storage brands, who suggests that these operators generally
represent 23.2% of the total number have larger facilities.
of facilities, but in terms of space
This data is as at 31 March 2018.
represent 39.0% of the total square
23.2% metres of self storage space in Europe.
Figure 6 – Number of facilities compared to cumulative market share
of the total number 250 25%
of facilities
200
or 20%
150
15%
100
10%
39%
50
0 5%
Shurgard
Safestore
Big Yellow
Access
Self Storage
MyPlace
Selfstorage
Homebox
OK Minilager
Cityvarasto
Bluespace
Pelican
Self Storage
of the total square metres
■ Number of facilities ––– Cumulative market share (%)
of self storage space
Source: FEDESSA/JLL
in Europe
Figure 7 – Market share based on square metres
1,200,000 40%
1,000,000 35%
800,000 30%
“Out of our portfolio 600,000 25%
of 228 properties, 92% 400,000 20%
are located in capital 200,000 15%
or primary cities.” 0 10%
Shurgard
Safestore
Access
Self Storage
MyPlace
Selfstorage
Lok'nStore
Bluespace
Pelican
Self Storage
Une Pièce
en Plus
Big Yellow
Homebox
Marc Oursin, Shurgard
■ Square metre of facilities ––– Cumulative market share (%)
Source: FEDESSA/JLL
*Size of Homebox has been estimated using their number of facilities and the average size of facilities in their
given countries. Big Yellow, Safestore and Une Pièce en Plus have been derived from their annual reports.13
Sustainability
For the second time we asked operators what sustainability initiatives they have introduced to their individual facilities.
The results show that under half of facilities have energy saving LED lighting, while other initiatives such as solar panels
(6%) and green roofs (3%) are still relatively uncommon.
Figure 8 – Sustainability
Source: FEDESSA/JLL
“Corporate Social and Economic Responsibility is essential not only to our capacity to
develop new sites but also to consumer acceptance by Generation Y and Generation Z,
our key customers ten years down the road.”
Burkhart Franz, Pelican
Less Mess Storage, Warsaw, PolandFEDESSA | European Self Storage Annual Survey 2018
Survey results
The survey results are a snapshot of the industry
as at 31 March 2018, based on the data provided
by operators representing a quarter of the industry,
providing a good overview of the market.
Average rents per square metre per annum
Once again we asked companies The figure below shows the average
to confirm the average annual rent rent from the survey in each country,
received as at 31 March 2018. The average as well as the highest rent reported
across Europe is €262 per square metre, in each country.
which is a slight increase from €258 last
The highest rent achieved was seen in the The average rent across
year. The 2017 survey did highlight that
UK at €620 and highest average rent was
a third of operators expected rental rates
in Switzerland at €360 per square metre
Europe is
€262
to remain the same over the next 12 months.
per annum. The UK and Switzerland have
The data collected from operators both had historically high rents over the
highlights the broad range of rents last three years.
reported in each country. This reflects per square metre per annum,
the differences between prime modern which is a slight increase from
facilities in central major metropolitan €258 last year.
cities and second generation facilities
in secondary locations.
Figure 9 – Average rents per square metre per annum
€700
€600
The highest average rent is in
€500
€400 Switzerland
€300
€262 at €360 per square
€200 metre per annum.
€100
0
Netherlands
Sweden
Finland
Germany
Ireland
Denmark
Spain
Austria
France
UK
Switzerland
Italy
Belgium
Italy
■ Average ▲ Maximum ––– Europe average
Source: FEDESSA/JLL/SSA UK
This is the second year in a row
“Each year we are seeing a greater use of dynamic pricing
models – this is helping the more sophisticated operators
Spain
has seen a significant increase
deliver sometimes outstanding results.” in occupancy rates.
Ollie Saunders, JLL European Self Storage15
Occupancy levels
This year, the average occupancy across For example, Germany, Finland and
Europe was 78% compared to 81% last Switzerland have the youngest average
year and 80% in 2016. age of facilities and relatively low average
occupancy, while Belgium has the oldest
The largest percentage increase was
The average occupancy average facility age in the dataset, and the
seen in Italy, which saw a 5.8% increase
highest average occupancy.
across Europe is in occupancy, closely followed by Spain
78%
(4.8%) and Belgium (3.7%). Spain had Pricing will also influence occupancy.
a low occupancy rate in 2016 due to A facility may be sacrificing revenue to
significant expansion, and the occupancy increase occupancy through discounting.
compared to 81% last has been increasing rapidly now these A facility that is 90% occupied at a
year and 80% in 2016. new sites are starting to fill up. This is discounted rate could well be less
the second year in a row that Spain profitable than a facility at 80% that has
has seen a significant increase in its maintained its pricing levels.
occupancy rates.
Optimal occupancy for a mature self
Occupancy rates should not be storage business is usually considered
considered in isolation as there are a to be 85% – 90%, which allows the
number of contributing factors that will business to continue to offer space
influence occupancy. When new space to customers and maximise yield for
is added to a market through expansion the business. The addition of new space
or new sites, this will lower the average to a market will reduce the average
Italy has seen occupancy as the new space takes below the mature level for the market.
the largest increase time to fill up and meet optimal levels.
in occupancy of
5.8%
Figure 10 – Average occupancy levels 2018
100%
followed by Spain (4.8%)
80%
and Belgium (3.7%). 78%
60%
40%
20%
0%
Italy
Germany
Austria
Finland
Switzerland
UK
Ireland
Sweden
Denmark
Netherlands
Spain
France
Belgium
France & Belgium have ■ Occupancy ––– Europe average
the joint highest occupancy at
89% Source: FEDESSA/JLL/SSA UKFEDESSA | European Self Storage Annual Survey 2018
Business / Domestic split – by area
The European average for space occupied by business customers has remained
consistent with last year, with domestic customers occupying 73% of space
by floor area. While business customers tend to stay for longer periods,
they are usually in larger units with lower rents per square metre.
Figure 11 – Business / Domestic split – by area
100%
80%
73%
60%
40%
20%
The European average for 0%
Ireland
Austria
Finland
Switzerland
Germany
Netherlands
France
UK
Sweden
Denmark
Belgium
Norway
Italy
space occupied by business
customers has remained
consistent with last year
■ Domestic space ■ Business space ––– Domestic average
Source: FEDESSA/JLL
Business / Domestic split – by units
When these figures are compared with the number of units occupied by business
with domestic users (as opposed to the amount of space) the results show that in all countries,
customers occupying the percentage of the space that the business users occupy is greater than
73%
the percentage of the number of units. 23% of units are occupied by business
customers, but they occupy 27% of space on average across Europe.
Figure 12 – Business/ Domestic split – by units
of space by floor area and
77% 100%
80% 77%
of the number of units 60%
40%
20%
0%
Ireland
Austria
Finland
Norway
Italy
UK
Netherlands
Belgium
France
Sweden
Switzerland
Germany
Spain
Denmark
■ Domestic units ■ Business units ––– Domestic average
Source: FEDESSA/JLL
“We have a 55/45 split for domestic and commercial customers
in Poland. We would like to increase commercial customers
as they stay longer and take bigger units.”
Przemek Główczewski, Kangu Self Storage17
Average facility sizes
When comparing the average Current Lettable Area (CLA) and average Maximum
Lettable Area (MLA) by country, most facilities are sized between 2,000 and
6,000 square metres, with the average size of facility in the dataset now 3,769
square metres CLA, a slight decrease from 3,773 square metres last year.
Norway and Finland once again have the smallest average facility size due
to expensive real estate and other demographic factors. The Italian and Irish
markets are relatively small and have a large number of facilities that are not
yet fully fitted out, hence the significant difference between CLA and MLA.
The difference between CLA and MLA demonstrates expected
expansion potential in existing facilities.*
*CLA is the total area of the individual units fitted out today, while MLA is the estimated total area of the
individual units when the facility is fully fitted out, based on the existing buildings prepared for self storage
development. It is not unusual for a self storage business to build or acquire a building and then construct
the internal self storage units progressively, such as one floor at a time or adding a mezzanine in later.
Figure 13 – Average Current Lettable Areas and Maximum Lettable Areas
8,000
7,000
6,000
5,000
CLA MLA
4,000
3,769 3,989
3,000
2,000
1,000
0
Norway
Finland
Switzerland
Sweden
Spain
Germany
Denmark
UK
Netherlands
Italy
France
Ireland
Austria
Belgium
■ CLA (currently built) ■ MLA (fully built)
––– CLA average ––– MLA average
Source: FEDESSA/JLL/SSA UK
“Quality of assets and location is key; where? How big?
Do they match the current portfolio?”
Marc Oursin, Shurgard
Store that Self Storage, London, UKFEDESSA | European Self Storage Annual Survey 2018
Source of enquiries
Websites and the internet again account for the majority of enquiries,
with 67% of enquiries across Europe (excluding the UK) in 2018 generated
online. This is an increase from 62% last year and 58% in 2016.
Surprisingly, directories have also shown a slight increase year-on-year,
showing that traditional methods for generating enquiries are not yet obsolete.
Figure 14 – Source of enquiries
9.0%
Other
16.0%
Referrals
“Can independents 5.0% 2016
beat big players online?
Can our kids beat
Directories
58.0%
Website
their parents at online 12.0%
games?” Signage
Burkhart Franz, Pelican
7.3%
Other
13.5%
Referrals
5.6% 2017
Directories
61.7%
Website
11.9%
Signage
8.3%
Other
9.0%
Referrals
5.3%
Directories
2018
10.5% 66.9%
Signage
Website
Source: FEDESSA/JLL/SSA UK19
Online pricing
The majority of operators have their prices online and many operators now provide the
ability to make reservations on their website in some form. Although there are significant
variations between countries, on average 88% of operators across Europe had their
prices on their websites, whilst 60% of operators had the ability to reserve online.
Operators take a number of different views on the ability to reserve rooms online
– some operators still want potential customers to call them, or to visit the site so
that the benefits of self storage can be better articulated, particularly where a large
proportion of their customer base are first time users of self storage. Other operators want
to provide full transparency on pricing and to secure sales via their online platforms.
Figure 15 – Facilities with prices online and the ability to make On average
88%
reservations via website
100%
88% of operators across Europe
80%
had their prices on their
60% 60% websites, whilst
40%
60%
of operators
20%
had the ability to
0%
reserve online
Italy
Spain
Ireland
Germany
France
Netherlands
Sweden
UK
Denmark
Belgium
Finland
Switzerland
Austria
Norway
■ Ability to reserve on website ■ Prices on website
––– Ability to reserve on website average ––– Prices on website average
Source: FEDESSA/JLL
The UK figure is derived by JLL research, as this was not collected in the SSA UK survey.
96%
of operators provide
electronic access
“Globally the industry is moving slowly but surely
in the direction of transparency.”
Marc Oursin, Shurgard
“New generations are much more digitally aware.
They want to do everything online. We are at a
35%
of operators provide
point where everything is becoming automated, 24 hour access
in five to ten years’ time we will be able to do
everything online without leaving home!”
Przemek Główczewski, Kangu Self StorageFEDESSA | European Self Storage Annual Survey 2018
Tenure
The self storage business model has a range of tenures, from owner occupied
freehold businesses, to management contracts, where no ownership of the
underlying real estate exists.
There is still a preference towards freehold ownership in Europe. The average freehold
ownership across Europe is 77%, an increase from 74% in 2017 and 2016. Switzerland
The average freehold and Norway were the only countries who had a majority of leasehold ownership,
ownership across Europe is principally due to the high cost of freehold sites.
77%
The development of freehold assets is the most accretive to value and also enables
the operator to find more favourable debt terms. However, availability of land
or capital do not always allow this and the self storage model has proven to work
an increase from 74% effectively under a leasehold model when established correctly. It will be interesting
in 2017 and 2016 to see if over time more operators consider leasehold properties to gain access to
areas where freehold property is simply not available.
The results for Spain have been excluded due to insufficient data.
Figure 16 – Split between tenure
100%
80% 77%
The average ancillary 60%
income across Europe is 40%
12%
an increase from 11%
20%
0%
Switzerland
Norway
Finland
Sweden
Netherlands
UK
Denmark
Germany
Ireland
Belgium
France
Austria
Italy
in 2017 and 10% in 2016
■ Freehold ■ Leasehold ––– Europe freehold average
Source: FEDESSA/JLL
“For the first time in Europe we are seeing
technological innovations that are really changing
the industry, from mobile phone based access
systems to genuinely automated sites.”
Rennie Schafer, FEDESSA21
Ancillary income
Operators were asked about the level of net income generated from sales
of insurance and retail products, such as boxes and packaging materials.
The average across Europe is 12%, an increase from 11% in 2017 and
10% in 2016. There is a large variance in the data between countries
with the ancillary income ranging between 0% and 20%.
These additional sources of income can be at a high margin for operators.
The difference in range is more typically a result of the operator placing a higher
focus on selling these ancillary services, both to storage customers and, in terms
of packaging materials, to other non-storage related customers. The more
established markets of the UK and France have the highest additional source
of income, at around 20% of total income, with newly built prominent facilities
in the more established markets generating a higher percentage of ancillary
sales, diversifying their income streams.
Interestingly, it is often once a business reaches maturity and maximum capacity that
operators then try to drive additional services as a means of increasing revenue.
Figure 17 – Income from ancillary sales
20%
15%
12%
10%
5%
0%
Norway
Finland
Ireland
Switzerland
Italy
Germany
Austria
Sweden
Denmark
Spain
Netherlands
Belgium
France
UK
■ Income received from ancillary sales ––– Europe average
Source: FEDESSA/JLL
“Insurance is an integral part of what we sell to our
customers: safety and peace of mind!”
Burkhart Franz, Pelican
Shurgard, Delft, NetherlandsFEDESSA | European Self Storage Annual Survey 2018
Outlook
Operators were asked how they viewed the outlook
for the self storage market over the next 12 months.
76% Profitability
76% of respondents felt that 2018 would be a better year for increasing profitability,
increasing from 72% in 2017. Optimism during 2017 fell, possibly due to the significant
of respondents felt that political uncertainty seen throughout the year, which included the French, Netherlands,
2018 would be a better year German and UK general elections.
for increasing profitability,
increasing from 72% in 2017 Figure 18 – Profitability outlook
70%
60%
50%
40%
30%
20%
10%
0%
Much worse Slightly worse It will be the same Slightly better Much better
than last year than last year as last year than last year than last year
■ 2015 ■ 2016 ■ 2017 ■ 2018
Source: FEDESSA/JLL/SSA UK
40% Rental growth
Operators are less confident this year about rental growth, with only 40%
of respondents expect
there to be increases in of respondents expecting there to be increases, compared to 50% in 2017 and 62%
in 2016. Over half the respondents were expecting rents to remain the same in 2018,
rental growth, compared to and only 7% were expecting rental rates to decrease over the next 12 months.
50% in 2017 and 62% in 2016
Figure 19 – Rental growth
70%
60%
50%
40%
30%
20%
10%
0%
Decrease Remain the Increase less than Increase greater than
same inflation in your country inflation in your country
■ 2015 ■ 2016 ■ 2017 ■ 2018
Source: FEDESSA/JLLPelican Self Storage, Copenhagen, Denmark 23
“The Copenhagen economy continues
to boom even if signs of a residential real
estate slowdown are appearing.”
Burkhart Franz, PelicanFEDESSA | European Self Storage Annual Survey 2018
Expansion
On average, European operators have the ability to expand the amount of available
space (CLA) by 11% within their existing buildings, an increase on 7% last year.
There are a large number of new facilities in the dataset, which have substantial
expansion potential.
Figure 20 – Expansion
50%
European operators have
40% the ability to expand the
amount of available space
30%
(CLA) by
11%
20%
10% 11%
0% within their existing buildings,
an increase on 7% last year.
Belgium
France
Norway
Austria
Spain
Netherlands
Sweden
UK
Switzerland
Germany
Denmark
Finland
Ireland
Italy
■ Expansion potential within existing buildings ––– Europe average
Source: FEDESSA/JLL/SSA UK
The planned number of new facilities Care must be taken when considering
opening around Europe each year is once these results, as historically operators
again increasing. have been unable to open as many sites
as they had hoped. Over the past four
The survey asked how many new facilities
operators were planning to open over the
next three years. Responses were collated
years since this question has been added
to the survey, actual growth has always
Italy, Ireland
fallen well below intended growth. and
Finland
from operators who currently have 1,186
However, solid growth remains in the
facilities between them. These operators
market and operators’ intentions to grow
are predicting that they will increase the
number of facilities by 381 in the next
underlines their confidence in the sector have the largest
and anticipated continued performance expansion potential within
three years to provide a total number
in the future, despite the difficulties
of facilities of 1,567, which equates to their existing buildings.
of finding suitable sites.
an increase of 32% in those portfolios,
or Compound Annual Growth Rate (CAGR)
of 9.73% per annum.
Figure 21 – New openings
2,000
+125
+120 +136
1,500
1,000
500
0
Open New facilities New facilities New facilities Expected
facilities April 2018 April 2019 April 2020 facilities 2021
– March 2019 – March 2020 – March 2021
Source: FEDESSA/JLL/SSA UK25 “The outlook for the self storage sector in Europe is positive. With good macro and demographic fundamentals, the next few years should see this entrepreneurial sector continue to evolve. We are seeing innovative operators adopting technology in new ways, and developing better buildings. There are some young portfolios which are growing steadily, and some more established players who are both consolidating and developing new stores. There is plenty of room for both the independents and the big players, with a variety of ways for new capital to invest in the market.” Ollie Saunders, JLL European Self Storage
FEDESSA | European Self Storage Annual Survey 2018
27

Roving focus
France
This year, we have included a roving focus
on France to provide insight into the market.

The French market is the second largest in Europe by number                                        The macro fundamentals are good in France for self storage.
of facilities, with 480 facilities. This equates to 7.4 facilities per                             It has the second highest urban population in Europe, and Paris
million habitants, or 0.018 square metres per person, which                                        is the most densely populated city in Europe with more than
are just below the European averages. The market was first                                         21,000 people per square kilometre. Over the next 10 years
established in France in 1996 with Homebox, shortly followed                                       the total population of France is forecast to grow by 2.25
by the creation of Une Pièce en Plus, who are now part of the UK                                   million, while the total urban population is forecast to grow by
listed operator Safestore who also acquired Access Stockage in                                     3.6 million. 35% of the French population have moved home
2005. More brands have been introduced into the market in the                                      in the last five years, and the country also has the third highest
last ten years by operators such as Annexx.                                                        number of Small to Medium sized Enterprises (SMEs) in Europe,
                                                                                                   after Italy and Spain.
The market is one of the most consolidated in Europe, with
53% of facilities operated by the top seven brands. However,                                       The location of self storage facilities in France is correlated
there are more franchise agreement and trademark licence                                           strongly to the population density, although it is under
agreements in France than other European countries, with                                           represented in Paris as a result of high land costs. From
Homebox, Stockerseul and A Chacun son Box, meaning that the                                        a regulation and zoning perspective, France can be more
ownership of the assets is more fragmented than the operators.                                     time consuming to secure the necessary consents.
There are also a significant number of ‘Mom and Pop’ operators
in France with the vast majority of the other operators having
only one or two facilities.

Figure 22 – The largest operators in France by number of facilities (excluding container storage)

                                                                                                                                       227
500

400

300
                                                                                                           16             12
                                                                               23
                                                              27
                                       28
200                       58
              89
100

  0
              Homebox

                          Shurgard
                        Self Storage

                                        Une Pièce en Plus

                                                               Annexx

                                                                                A Chacun son Box

                                                                                                            Sos Box

                                                                                                                          Self Stock

                                                                                                                                        Others

                                                            ■ Number of facilities

Source: JLL
FEDESSA | European Self Storage Annual Survey 2018
Additional information
Membership of FEDESSA Methodology Interviewees
The following associations are An online survey was sent to operators • Burkhart Franz, Pelican Self Storage
current members of FEDESSA: in each country by FEDESSA and JLL.
• Przemek Główczewski, Kangu Self
Data was requested at both company
• Belgian Self Storage Association ASBL Storage
and facility level to gain as much
• Asociace Self-Storage – The Czech comprehensive information as possible. • Marc Oursin, Shurgard
Republic Some associations exclude certain
operators, for example those who
• Rishi Patel, M3 Capital Partners (UK) LLP
• Self Storage Association Denmark only provide containerised storage. • Rennie Schafer, FEDESSA
• Pienvarastoyhdistys ry – Finland
JLL collated the results and conducted • Simon Vallance, Metro Bank
• CISS – La Chambre operator interviews, with data
Interprofessionnelle du Selfstockage provided from the following sources:
– France
• Economic overview: Research
• Verband Deutscher Selfstorage provided by JLL research team
Unternehmen e.V. – Germany
• Key deals: Information collated by JLL
• Irish Self Storage Association
• Industry overview: Collected by each
• AIS – Associazione Imprese di Self member association and consolidated
Storage – Italy
by FEDESSA with analysis by JLL
• The Netherlands Self Storage • Survey results: Collected and
Association
consolidated by JLL from online survey
• Norwegian Self Storage Association responses of FEDESSA members.
Number of sites verified from operator
• AESS – Asociación Española de Self responses and on operator websites
Storage – Spain
• Outlook: Collected and consolidated
• Self Storage Association Sweden by JLL from online survey responses
• 3SA – Swiss Self-Storage Association of FEDESSA members
• Ukrainian Self Storage Association • Roving focus: Collected and consolidated
by JLL from online survey responses
• Self Storage Association United of FEDESSA members
Kingdom.
• European supply data: Information
consolidated by FEDESSA.Shurgard Self Storage, Rotterdam, Netherlands 29
“Investors love the fundamentals of self storage
which has consistently provided fantastic
returns. The challenge for the European market
is to be able to provide the scale of investment
that institutional investors want.”
Kathryn Pitts, JLLFEDESSA | European Self Storage Annual Survey 2018
MyPlace Self Storage, Zurich, Switzerland31
European supply data
Population Estimated number Current Floor space Facilities per
of facilities lettable area per capita million population
(square metres) (square metres)
Country 2018 (UN) 2018 2018 2018 2018
Austria 8,751,820 47 88,000 0.010 5.4
Belgium 11,498,519 88 200,000 0.017 7.7
Czech Republic 10,625,250 5 14,000 0.001 0.5
Denmark 5,754,356 92 196,000 0.034 16.0
Estonia 1,306,788 3 3,000 0.002 2.3
Finland 5,542,517 68 155,000 0.028 12.3
France 65,233,271 480 1,150,000 0.018 7.4
Germany 82,293,457 234 562,000 0.007 2.8
Hungary 9,688,847 16 41,000 0.004 1.7
Iceland 337,780 7 19,000 0.056 20.7
Ireland 4,803,748 28 90,000 0.019 5.8
Italy 59,290,969 56 175,000 0.003 0.9
Latvia 1,929,938 3 7,500 0.004 1.6
Lithuania 2,876,475 1 1,500 0.001 0.3
Netherlands 17,084,459 303 890,000 0.052 17.7
Norway 5,353,363 139 133,000 0.025 26.0
Poland 38,104,832 17 26,000 0.001 0.4
Portugal 10,291,196 19 56,500 0.005 1.8
Romania 19,580,634 5 15,000 0.001 0.3
Spain 46,397,452 426 910,000 0.020 9.2
Sweden 9,982,709 159 430,000 0.043 15.9
Switzerland 8,544,034 91 85,000 0.010 10.7
UK (incl containers) 66,573,504 1505 4,460,000 0.067 22.6
Europe in Total 491,845,918 3,792 9,707,500 0.020 7.7
Australia 24,772,247 1,300 4,050,000 0.163 52.5
Russia 143,964,709 54 160,000 0.001 0.4
US 326,766,748 54,100 285,000,000 0.872 165.6
Source: FEDESSA/JLL/UNContacts FEDESSA Rennie Schafer Paola Barraza Chrissie Ciani Chief Executive Officer Membership Services Officer Membership Services Officer +44 (0)12 7062 3150 +32 472 943 324 +44 (0)7761295379 rschafer@fedessa.org pbarraza@fedessa.org mso@fedessa.org fedessa.org JLL Ollie Saunders Paul Ben-Nathan Kathryn Pitts Lead Director Data Analytics Valuation +44 (0)20 7087 5843 +44 (0)20 7087 5332 +44 (0)20 7087 5989 ollie.saunders@eu.jll.com paul.ben-nathan@eu.jll.com kathryn.pitts@eu.jll.com Tom Caines Daniel Thorpe Paul Cooper Investment & Development JLL Alternatives Research JLL France +44 (0)20 7087 5860 +44 (0)20 7087 5765 +33 1 53 75 86 88 tom.caines@eu.jll.com daniel.thorpe@eu.jll.com paul.cooper@eu.jll.com Frank Rambow Luca Villani Yulia Nikulicheva JLL Germany JLL Italy JLL Russia +49 211 1300 6745 +39 02 8586 8651 +7 495 737 8530 frank.rambow@eu.jll.com luca.villani@eu.jll.com yulia.nikulicheva@eu.jll.com Nick Wride Patrik Lofvenberg Mateusz Polkowski JLL Spain JLL Sweden JLL Alternatives Research – Poland +34 673 156 526 +46 703 985 346 +48 22 1670 042 nick.wride@eu.jll.com patrik.lofvenberg@eu.jll.com mateusz.polkowski@eu.jll.com jll.co.uk/selfstorage © 2018 Jones Lang LaSalle IP, Inc. and the Federation of European Self Storage Associations (FEDESSA). All rights reserved. The information contained in this document is proprietary to JLL and FEDESSA. All such documentation and information remains the property of JLL and FEDESSA and shall be kept confidential. Reproduction of any part of this document is authorized only to the extent necessary for its evaluation. It is not to be shown to any third party without the prior written authorization of JLL and FEDESSA. All information contained herein is from sources deemed reliable; however, no representation or warranty is made as to the accuracy thereof.
You can also read