FELIXSTOWE NORTH & TRIMLEY - ELECTORAL DIVISION PROFILE 2021 www.suffolkobservatory.info - Suffolk Observatory
←
→
Page content transcription
If your browser does not render page correctly, please read the page content below
FELIXSTOWE
NORTH & TRIMLEY
ELECTORAL DIVISION PROFILE 2021
This Division consists of parts of Orwell & Villages, Western Felixstowe and
Eastern Felixstowe Wards

            www.suffolkobservatory.info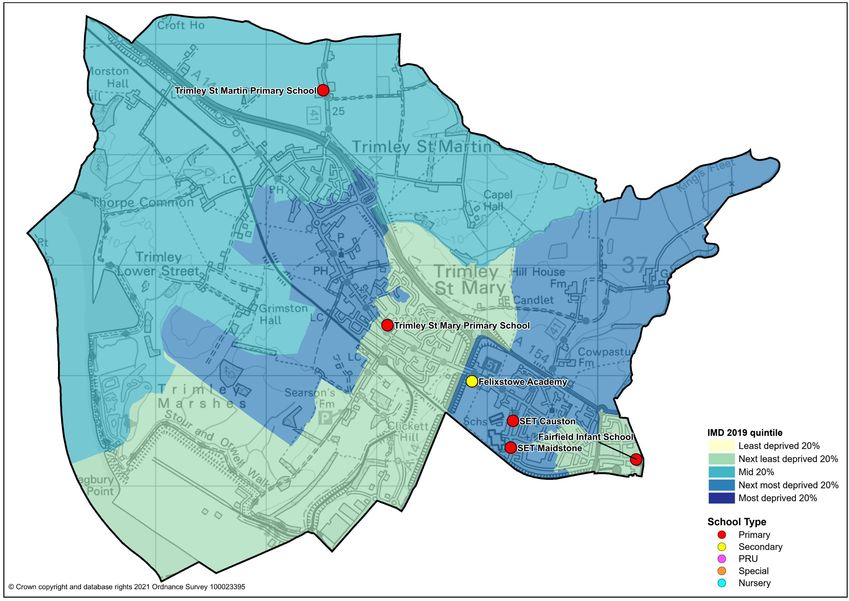
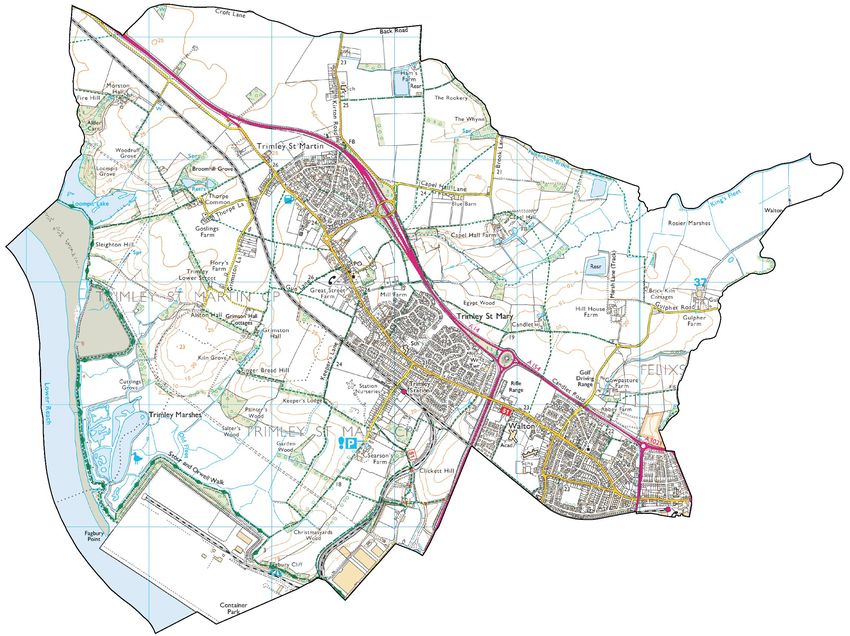
2
© Crown copyright and database rights 2021 Ordnance Survey 100023395
CONTENTS

▪   Demographic Profile: Age & Ethnicity
▪   Economy and Labour Market
▪   Schools & NEET
▪   Index of Multiple Deprivation
▪   Health
▪   Crime & Community Safety
▪   Additional Information
▪   Data Sources
ELECTORAL DIVISION PROFILES: AN INTRODUCTION
These profiles have been produced to support elected members, constituents and other
interested parties in understanding the demographic, economic, social and educational
profile of their neighbourhoods. We have used the latest data available at the time of
publication.

Much more data is available from national and local sources than is captured here, but it is
hoped that the profile will be a useful starting point for discussion, where local knowledge and
experience can be used to flesh out and illuminate the information presented here.

The profile can be used to help look at some fundamental questions e.g.
▪ Does the age profile of the population match or differ from the national profile?
▪ Is there evidence of the ageing profile of the county in all the wards in the Division or just
 some?
▪ How diverse is the community in terms of ethnicity?
▪ What is the impact of deprivation on families and residents?
▪ Does there seem to be a link between deprivation and school performance?
▪ What is the breakdown of employment sectors in the area?
▪ Is it a relatively healthy area compared to the rest of the district or county?
▪ What sort of crime is prevalent in the community?

A vast amount of additional data is available on the Suffolk Observatory

                            www.suffolkobservatory.info
The Suffolk Observatory is a free online resource that contains all Suffolk’s vital statistics; it is
the one-stop-shop for information and intelligence about Suffolk. Through data, reports and
profiles, the Suffolk Observatory provides a comprehensive picture of the County. It is a great
source for useful facts and figures that can be used for writing reports and presentations,
informing strategic and business planning, preparing funding applications or supporting
academic research. Data is presented around the key themes of education and skills,
economy and employment, health and care, population, deprivation, housing, environment,
transport and travel and crime. All areas of the county are covered, right down to district,
ward and parish level, with information easily accessible in a variety of formats. You can also
build your own reports by different themes and topics.

Technical Notes:
   1. Where Electoral Divisions do not exactly match ward boundaries, we have adopted a
      “best fit” approach to produce a dataset.
   2. District, county and national level data is provided where possible to provide a context
      for comparisons.

                                                 4
DEMOGRAPHIC PROFILE - AGE
In mid-2019, the population of Felixstowe North and Trimley stood at 10,490, an increase of
5.9% since the 2011 Census. The age structure of the division is set out below.
Felixstowe North and
Orwell & Villages Western Felixstowe Eastern Felixstowe
Trimley Division
All Ages 10,490 5,977 3,968 545
0-4 615 358 230 27
5-9 610 335 246 29
10-14 587 313 248 26
15-19 519 260 241 18
20-24 458 251 196 11
25-29 598 334 246 18
30-34 575 328 229 18
35-39 565 339 203 23
40-44 596 334 240 22
45-49 698 393 272 33
50-54 759 427 298 34
55-59 794 485 272 37
60-64 735 463 234 38
65-69 691 432 208 51
70-74 690 403 231 56
75-79 442 238 159 45
80-84 289 151 108 30
85-89 187 98 68 21
90+ 82 35 39 8
90+
85-89
80-84
75-79
70-74
65-69
60-64
55-59
50-54
45-49
40-44
35-39
30-34
25-29
20-24
15-19
10-14
5-9
0-4
10% 8% 6% 4% 2% 0% 2% 4% 6% 8% 10%
England - females England - males Felixstowe North & Trimley - females Felixstowe North & Trimley - males
▪ The age pyramid for Felixstowe North and Trimley shows a higher-than-average
proportion of people over the age of 50.
5▪ The most common age group in Felixstowe North and Trimley is 55-59-year-olds,
followed by 50-54-year-olds.
▪ There is a lower-than-average number of people in some of the younger age groups,
particularly 20–39-year-olds.
ETHNICITY
100%
90%
80%
70%
60%
50%
40%
30%
20%
10%
0%
Felixstowe North & Trimley East Suffolk Suffolk England
▪ According to the latest data (2011 Census), 97.5% (9,653) of the population of Felixstowe
North and Trimley are white, with 95% white British.
▪ There are 252 (2.5%) people of minority ethnic origin in the division.
▪ Felixstowe North and Trimley has generally lower proportions of minority ethnic groups
than Suffolk county, East Suffolk district and England as a whole.
Asian and Black and Other Total
All White minority
White Mixed Asian Black Ethnic ethnic
people British
British British Group population
Count Count % Count % Count % Count % Count % Count % Count %
Felixstowe
9,905 9,653 97.5 9,407 95.0 113 1.1 88 0.9 33 0.3 18 0.2 252 2.5
North & Trimley
East Suffolk 239,552 232,565 97.1 227,040 94.8 2,728 1.1 2,991 1.2 925 0.4 343 0.1 6,987 2.9
Suffolk 728,163 693,195 95.2 661,458 90.8 12,472 1.7 13,131 1.8 6,854 0.9 2,511 0.3 34,968 4.8
England 85.4 79.8 2.3 7.8 3.5 1.0 14.6
6ECONOMY
There are 2,300 people employed in Felixstowe North and Trimley.
50%
45%
40%
35%
30%
25%
20%
15%
10%
5%
0%
Felixstowe North & Trimley East Suffolk Suffolk England
▪ Transport and storage is the most important industry in the division by some margin. The
sector includes logistics activity related to the Port of Felixstowe. The sector provides just
over 45% of jobs in the division.
▪ Such is the dominance of transport and storage employment in the division that most
other sectors account for below average proportions of employment.
▪ Education is the second most important sector in Felixstowe North and Trimley, providing
1 in 7 jobs in the division.
7LABOUR MARKET
OUT-OF-WORK BENEFIT CLAIMANT RATE
7%
6%
5%
4%
3%
2%
1%
0%
Jan-18
Jun-18
Jul-18
Jan-19
Jun-19
Jul-19
Jan-20
Jun-20
Jul-20
Jan-21
Feb-18
Mar-18
Feb-19
Mar-19
Feb-20
Mar-20
Aug-18
Sep-18
Nov-18
Dec-18
Aug-19
Sep-19
Nov-19
Dec-19
Aug-20
Sep-20
Nov-20
Dec-20
Oct-18
Oct-19
Oct-20
May-18
May-19
May-20
Apr-18
Apr-19
Apr-20
Felixstowe North & Trimley East Suffolk Suffolk England
▪ Felixstowe North and Trimley saw a sharp increase in claimants of out-of-work benefits in
the first half of 2020 as a result of the COVID-19 pandemic, much like the rest of the
county and England as a whole.
▪ Claimant unemployment levels in the division are consistently below those of the district,
county and England as a whole.
▪ In percentage terms, approximately 3.6% of the working age population of Felixstowe
North and Trimley are claiming out-of-work benefits in January 2021.
8SCHOOLS
SCHOOL INFORMATION
Schools in the Division
Average cohort size at:
Foundation Stage
Academy Status
KS2 (age 11)
KS4 (age 16)
KS5 (age 18)
(age 5)
Latest
Latest
Ofsted
Ofsted
Date
Name Phase
Fairfield Infant School Primary LA 90 0 0 0 Good 12/07/2017
SET Causton Primary AC 0 49 0 0 Good 05/12/2018
SET Maidstone Primary AC 42 0 0 0 Good 13/03/2014
Trimley St Martin Primary School Primary LA 28 28 0 0 Good 04/12/2014
Trimley St Mary Primary School Primary LA 53 58 0 0 Good 28/01/2016
Felixstowe Academy Secondary AS 0 0 195 46 Inadequate 15/11/2017
Schools with catchments that overlap with the Division
Average cohort size at:
Foundation Stage
Academy Status
KS2 (age 11)
KS4 (age 16)
KS5 (age 18)
(age 5)
Latest
Latest Ofsted Ofsted
Date
Name Phase
Colneis Junior School Primary LA 0 87 0 0 Good 22/03/2017
Kingsfleet Primary School Primary LA 28 27 0 0 Good 07/03/2019
Academy Status key: AS = Academy Sponsored, AC = Academy Converter, LA = LA
Maintained, F = Free
*The latest full inspection judgement does not relate to the current school
9SCHOOL ATTAINMENT
Foundation Stage Profile (reception)
% pupils achieving Good Level of Development (GLD)
100%
90%
80%
70%
60%
50%
40%
30%
20%
10%
0%
2017 2018 2019
Fairfield Infant School SET Maidstone
Trimley St Martin Primary School Trimley St Mary Primary School
Suffolk National
▪ Foundation stage attainment at schools in Felixstowe North and Trimley has been
generally below average over the last three years of available data.
▪ Trimley St Mary Primary School (2018) and Trimley St Martin Primary School (2019) were
the only occasions when schools in the division saw above average Foundation Stage
attainment.
▪ Pupil attainment at Fairfield Infant School has seen a slight decline in attainment over the
three years of data presented here, while SET Maidstone has seen the opposite trend.
10Key Stage 2 (age 11)
% pupils achieving the Expected Level or better in Reading, Writing and Mathematics
80%
70%
60%
50%
40%
30%
20%
10%
0%
2017 2018 2019
SET Causton Trimley St Martin Primary School
Trimley St Mary Primary School Suffolk
National
▪ Key Stage 2 attainment at schools in Felixstowe North and Trimley has been generally
below average over the last three years of available data.
▪ SET Causton (2017) and Trimley St Mary Primary School (2018) were the only occasions
when schools in the division saw above average KS2 attainment. Performance at SET
Causton has declined in the two years since.
▪ Attainment at Trimley St Martin Primary School has been fairly stable but below the
county and national benchmarks during this period.
11Key Stage 4 (GCSE) (age 16)
% pupils achieving level 4-9 in English and Mathematics
70%
60%
50%
40%
30%
20%
10%
0%
2017 2018 2019
Felixstowe Academy Suffolk National
▪ GCSE attainment results Felixstowe Academy have been below the county and national
averages from 2017 to 2019.
▪ However, pupil attainment at the school has improved in each of the last two years, with
the gap to the national average down to 9 percentage points in 2019.
Key Stage 5 (A level) (age 18)
A Level Points entry
40
35
30
25
20
15
10
5
0
2017 2018 2019
Felixstowe Academy Suffolk National
▪ A Level attainment results at Felixstowe Academy have been consistently below average
from 2017 to 2019.
▪ There was an improvement in attainment in 2018 but this was reversed in 2019.
12NEET % (NOT IN EDUCATION, EMPLOYMENT OR TRAINING)
7%
6%
5%
4%
3%
2%
1%
0%
Felixstowe North & Trimley East Suffolk Suffolk
▪ In January 2021, 3.9% of 16–18-year-olds in Felixstowe North and Trimley were classified
as NEET (where current activity is known).
▪ The NEET level in Felixstowe North and Trimley is currently below the Suffolk average
but slightly above the East Suffolk rate. NEET figures in the division tend to be similar to
the district and county averages.
13INDEX OF MULTIPLE DEPRIVATION (IMD) 2019 (SEE MAP
OVERLEAF)
The IMD combines a number of indicators, chosen to cover a range of economic, social and
housing issues, into a single deprivation score for each small area in England. This allows
each area to be ranked relative to one another according to their level of deprivation. Small
areas (Lower Super Output Areas, average population 1,700) are most commonly described
as being in 1 of 5 quintile bands. The bottom quintile represents the 20% of areas that are
the most deprived in England; these are shaded pale yellow on the map. The top quintile
represents the least deprived areas in England and is shaded dark blue.
The Index is widely used to analyse patterns of deprivation, identify areas that would benefit
from special initiatives or programmes and as a tool to determine eligibility for specific
funding streams.
50%
% of population by deprivation quintile of residence
45%
40%
35%
30%
25%
20%
15%
10%
5%
0%
Most deprived 20% Next most deprived Mid 20% Next least deprived Least deprived 20%
20% 20%
Felixstowe North & Trimley East Suffolk England
▪ The IMD 2019 shows that relative deprivation levels in Felixstowe North and Trimley are
varied, with the division split across three of the five deprivation quintiles.
▪ Of the seven Lower Layer Super Output Areas (LSOA) comprising the division, three are
ranked in the next least deprived quintile in England (home to 41% of the population of
the division as shown in the chart above), one is in the mid quintile and three are in the
second most deprived quintile.
1415
HEALTH
The local data used here is based on relatively small numbers of deaths. The confidence
limits provide an indication of the reliability of the data. The 95% confidence intervals utilised
on the chart provide a range within which there is 95% chance of the true result lying.

LIFE EXPECTANCY AT BIRTH
    88
    86
    84
    82
    80
    78
    76
    74
    72
          Felixstowe North & Trimley         East Suffolk                         Suffolk                    England

                           Life expectancy at birth for males         Life expectancy at birth for females

▪        Estimated life expectancy at birth in Felixstowe North and Trimley is above average for
         females, but slightly below the district and county average for males.
▪        For women in the division, life expectancy is 84.9 years, around 18 months longer than
         the national average.
▪        Life expectancy for men in Felixstowe North and Trimley is 80.2 years. This is slightly
         below the East Suffolk figure of 80.7 but above the England average of 79.8.

DEATHS, UNDER 75 YEARS, STANDARDISED MORTALITY RATIO
    140

    120

    100

     80

     60

     40

     20

      0
            Deaths from all causes,    Deaths from all cancers,        Deaths from circulatory        Deaths from causes
               under 75 years              under 75 years              disease, under 75 years     considered preventable (all
                                                                                                             ages)

                             Felixstowe North & Trimley         Suffolk Coastal       Suffolk    England

▪        The estimated rate of early deaths for all causes, early deaths from cancer and deaths
         from causes considered preventable across all ages in Felixstowe North and Trimley are
         very slightly above the East Suffolk level but below the county and national average.
▪        The standardised mortality ratio data shown here means that for every 100 early deaths
         from all causes across England as a whole, there are an estimated 78 comparable deaths
         in Felixstowe North and Trimley.
▪        Early deaths from circulatory disease in the division are estimated to be very low.

                                                                 16
CRIME & COMMUNITY SAFETY
80
70
60
50
40
30
20
10
0
Felixstowe North & Trimley East Suffolk Suffolk England
Burglary Criminal damage and arson Drugs
Public order Shoplifting Other theft
Vehicle crime Violence and sexual offences Other
▪ Crime levels in Felixstowe North and Trimley are fairly low. 48 crimes per 1,000 residents
were recorded in the division in the year to the end of January 2021, compared to 59 in
East Suffolk and 66 countywide.
▪ Violence and sexual offences accounted for around half of recorded crime in the division
during this period.
▪ Most crimes occur at a similar or lower rate in the division than across Suffolk as a whole.
Drug offences are slightly more common in Felixstowe North and Trimley, with 2.8 crimes
recorded per 1,000 residents compared to 2 across East Suffolk and 2.3 across the
county.
ADDITIONAL INFORMATION
Parishes in Division
Felixstowe (part)
Trimley St. Martin
Trimley St. Mary
17DATA SOURCES
Category Indicator Source
ONS 2019 mid-year population
Quinary population table 2019
estimates
Demographic ONS 2019 mid-year population
Population pyramid 2019
Profile estimates
Ethnicity 2011 ONS 2011 Census
ONS Business Register and
Economy Employment by broad industrial sector 2019 Employment Survey via
NOMIS
Claimant count: The number of people claiming
Jobseeker's Allowance plus those who claim
Labour market DWP via NOMIS
Universal Credit who are out of work (% 16-64
population) January 2018- February 2021
School information and attainment 2017-2019 Suffolk County Council
Education % 16-18-year-olds NEET (Not in Employment, Suffolk County Council via the
Education or Training) 2017-2021 Suffolk Observatory
Ministry for Housing,
Deprivation Index of Multiple Deprivation 2019 Communities and Local
Government
Health Life expectancy at birth 2013-2017 Public Health England
Standardised mortality ratio for deaths from all
causes, cancer and circulatory disease, (aged
under 75), and death from causes considered
Health preventable (all ages), 2013-2017. The Public Health England
standardised mortality ratio is the ratio of
observed deaths in the study group to expected
deaths in the general population.
Community Recorded crime rate per 1,000 resident Data.police.uk via the Suffolk
Safety population February 2020 to January 2021 Observatory
For more data and information about Felixstowe North and Trimley Electoral Division,
see the Suffolk Observatory www.suffolkobservatory.info
1819
You can also read