Fernando Martins Secco Luce Do Neighbors Vote Alike? Evidence from the Brazilian Congress - Departamento de Economia ...
←
→
Page content transcription
If your browser does not render page correctly, please read the page content below
Fernando Martins Secco Luce

                                                 Do Neighbors Vote Alike? Evidence from the
                                                                          Brazilian Congress
PUC-Rio - Certificação Digital Nº 1612158/CA

                                                                                 Dissertação de Mestrado

                                               Dissertation presented to the Programa de Pós–graduação em
                                               Economia of PUC-Rio in partial fulfillment of the requirements
                                               for the degree of Mestre em Economia .

                                                          Advisor: Prof. Claudio Abramovay Ferraz do Amaral

                                                                                               Rio de Janeiro
                                                                                                   April 2018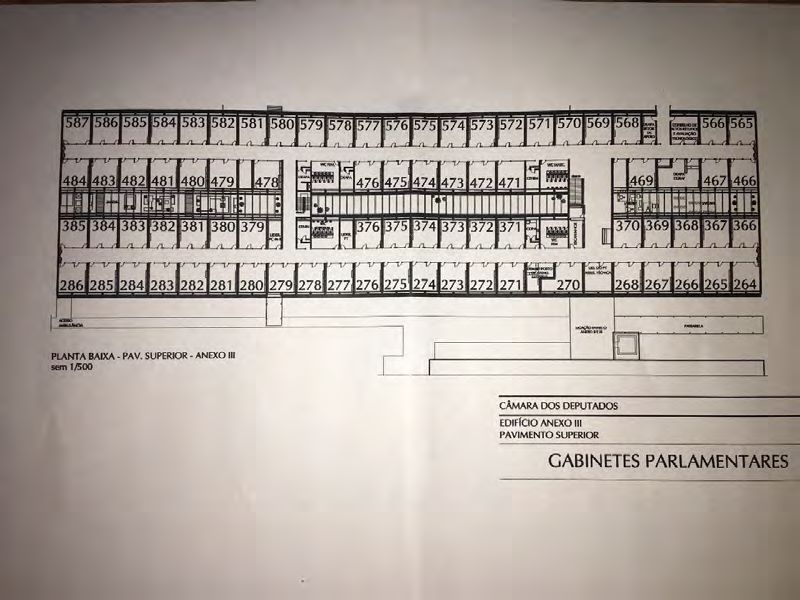
Fernando Martins Secco Luce

                                                  Do Neighbors Vote Alike? Evidence from the
                                                                           Brazilian Congress

                                               Dissertation presented to the Programa de Pós–graduação em
                                               Economia of PUC-Rio in partial fulfillment of the requirements for
                                               the degree of Mestre em Economia . Approved by the undersigned
                                               Examination Committee.
PUC-Rio - Certificação Digital Nº 1612158/CA

                                                              Prof. Claudio Abramovay Ferraz do Amaral
                                                                                                 Advisor
                                                                     Departamento de Economia – PUC-Rio

                                                                       Prof. Fabio Adriano Miessi Sanches
                                                                       Departamento de Economia – PUC-Rio

                                                              Prof. Carlos Eduardo Ferreira Pereira Filho
                                                   Escola Brasileira de Administração Pública e de Empresas –
                                                                                                 FGV/EBAPE

                                                                     Prof. Augusto Cesar Pinheiro da Silva
                                                                               Vice Dean of Graduate Studies
                                                                         Centro de Ciências Sociais – PUC-Rio

                                                                                 Rio de Janeiro, April 4th, 2018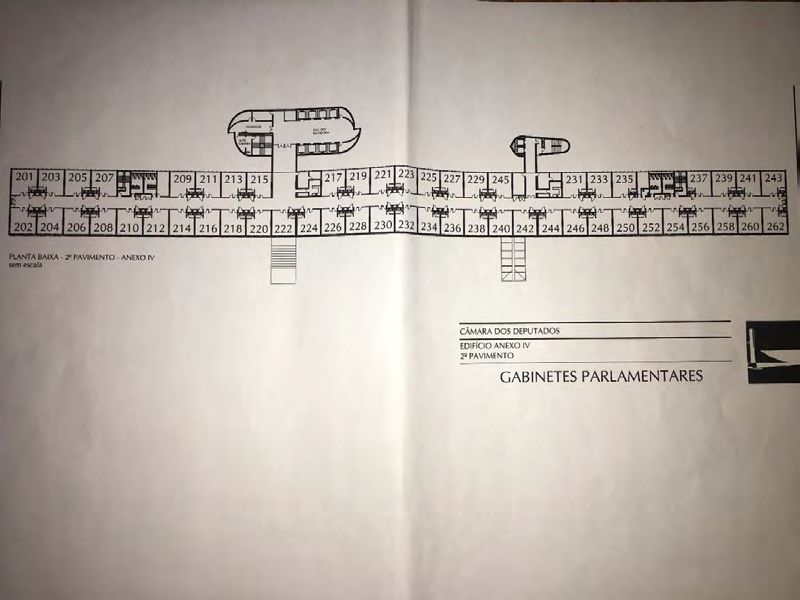
All rights reserved.

                                                                               Fernando Martins Secco Luce

                                               B.A., Economics, Pontifícia Universidade Católica do Rio de
                                               Janeiro (PUC-Rio), 2014
PUC-Rio - Certificação Digital Nº 1612158/CA

                                                                                               Bibliographic data
                                                Luce, Fernando Martins Secco

                                                    Do Neighbors Vote Alike? Evidence from the Brazilian
                                                Congress / Fernando Martins Secco Luce; advisor: Claudio
                                                Abramovay Ferraz do Amaral. – Rio de janeiro: PUC-Rio ,
                                                Departamento de Economia , 2018.

                                                    v., 49 f: il. color. ; 30 cm

                                                    Dissertação (mestrado) - Pontifícia Universidade Católica
                                                do Rio de Janeiro , Departamento de Economia .

                                                    Inclui bibliografia

                                                    1. Economia – Teses. 2. Efeito dos pares;. 3. Sorteio de
                                                gabinetes;. 4. Votos de políticos;. 5. Congresso Brasileiro..
                                                I. Ferraz, Claudio. II. Pontifícia Universidade Católica do Rio
                                                de Janeiro . Departamento de Economia . III. Título.

                                                                                                  CDD: 620.11
Acknowledgments
I would like to thank my parents and my sister, Fernanda, Claudio and Fabiola,
for all their love and help throughout all my life and for showing me that I was
able to accomplish all my dreams if I never gave up.
To my advisor Claudio Ferraz, thank you for your guidance and contri-
PUC-Rio - Certificação Digital Nº 1612158/CA
butions for the past two years.
I also want to thank my colleagues for making my days better than I
could have imagined for the past two and a half years. A special thank you to
Roberto Hsu, Rodolfo Rigato and Vitor Martello for being almost co-advisers
in this project.
To my oldest friends, Rodrigo Abrahão, Breno Gouvea, Lucas Ronchini
thank you for everything and for being by my side at every step of the way,
alongside with our bell.
Finally, I want to thank my wife, Anna Frangipani, for her unconditional
support, love and help. I was only able to overcome all the difficulties of this
project because you were by my side giving me the strength to go on.Abstract
Luce, Fernando Martins Secco; Ferraz, Claudio (Advisor). Do
Neighbors Vote Alike? Evidence from the Brazilian Con-
gress. Rio de Janeiro, 2018. 49p. Dissertação de mestrado – De-
partamento de Economia , Pontifícia Universidade Católica do Rio
de Janeiro .
This work analyses the presence of peer effects in the Brazilian
Congress among federal deputy. I test if a deputy is influenced by its next-
door neighbor when casting a vote for a proposition. Since politicians can
select colleagues with similar political position to be their neighbors, I use
an office lottery that randomly allocates offices for newcomers and test if
PUC-Rio - Certificação Digital Nº 1612158/CA
office proximity increases the likelihood of agreement. I use data for all 1026
Brazilian federal deputies from 54th and 55th legislature elected in 2010 and
2014 and observe their votes in all propositions held between February 2011
and May 2017. I find that being next-door office neighbors does not increase
the probability of agreement. Similar findings are obtained when restricting
the sample for different types of proposition, for deputies from the same
party, as well as for congressmen from the same state.
Keywords
Peer effects; Office Lottery; Politicians’ votes; Brazilian Congress.Resumo
Luce, Fernando Martins Secco; Ferraz, Claudio. Do Neighbors
Vote Alike? Evidence from the Brazilian Congress. Rio de
Janeiro, 2018. 49p. Dissertação de Mestrado – Departamento de
Economia , Pontifícia Universidade Católica do Rio de Janeiro .
Este trabalha analisa a presença de peer effects no Congresso Brasileiro
entre os seus deputados federais. Neste trabalho, eu testo se um deputado
é influenciado pelo seu vizinho de porta no momento de votar em uma
proposição. Dado que eles podem selecionar colegas com posições políticas
semelhantes para serem seus vizinhos, eu utilizo uma loteria de gabinetes
que aleatoriamente define os gabinetes dos novos deputados para observar
PUC-Rio - Certificação Digital Nº 1612158/CA
se a proximidade de gabinetes aumenta a probabilidade de concordância.
Os dados foram coletados para todos os 1026 deputados federal brasileiros
da 54a e 55a legislatura, eleitas em 2010 e 2014, e observa os seus deputados
em todas as proposições votadas entre Feveireiro de 2011 e Maio de 2017.
Os results indicam que ser "vizinho de porta" nos gabinetes não aumentam a
probabilidade de concordância em uma votação. Resultados semelhantes são
obtidos quando a amostra foi restrita para diferentes tipos de proposição,
para deputados do mesmo partido, assim como para deputados do mesmo
estado.
Palavras-chave
Efeito dos pares; Sorteio de gabinetes; Votos de políticos; Con-
gresso Brasileiro.Table of contents
1 Introduction 11
2 Political Networks 14
3 Brazil’s Chamber of Deputies 16
3.1 Background 16
3.2 Congressional Voting 17
3.3 Office Lottery 17
4 Data and Empirical Strategy 19
5 Results 22
6 Conclusion 31
Bibliography 32
PUC-Rio - Certificação Digital Nº 1612158/CA
A Figures 36
B Additional Tables 38
C Different Clustering Specifications: Dyadic and Two-Way 47
C.1 Sub sample 1 47
C.2 Sub sample 2 48List of figures
Figure A.1 Aerial photo of the Chamber’s Main Complex 36
Figure A.2 Plan for Anexo III only floor 37
Figure A.3 Plan for Anexo IV 2nd floor 37
PUC-Rio - Certificação Digital Nº 1612158/CAList of tables
Table 4.1 Agreement Measures 19
Table 4.2 Summary of Agreement Measures 20
Table 5.1 Baseline Results 22
Table 5.2 Sub Sample: Pairs from the Same Party 23
Table 5.3 Sub Sample: Pairs from the Same State 24
Table 5.4 Sub Sample based on Political Ideology. Dependent vari-
able: Agree1ijt 25
Table 5.5 Sub Sample based on Political Ideology. Dependent vari-
able: Agree1ijt 25
Table 5.6 Sub Sample based on Political Alignment. Dependent
variable: Agree1ijt 26
Table 5.7 Heterogeneous effect based on election criterion 27
Table 5.8 Analysis by Absence Rate. Dependent Variable: Agree1ijt 28
Table 5.9 Analysis by Agreement Rate. Dependent Variable: Agree1ijt 28
Table 5.10 Analysis by Type of Proposition. Dependent Variable:
Agree1ijt 29
PUC-Rio - Certificação Digital Nº 1612158/CA
Table 5.11 Analysis by Type of Proposition. Dependent Variable:
Agree1ijt 29
Table 5.12 Analysis by proportion of time away from position. De-
pendent Variable: Agree1ijt 30
Table B.1 Number of Federal Deputies elected by Political Party 38
Table B.2 Number of Federal Deputies elected by Political Ideology 39
Table B.3 Number of Federal Deputies elected by Political Coalition 39
Table B.4 Sub Sample based on Political Ideology. Dependent vari-
able: Agree2ijt 39
Table B.5 Sub Sample based on Political Ideology. Dependent vari-
able: Agree2ijt 40
Table B.6 Sub Sample based on Political Ideology. Dependent vari-
able: Agree3ijt 40
Table B.7 Sub Sample based on Political Ideology. Dependent vari-
able: Agree3ijt 41
Table B.8 Sub Sample based on Political Alignment. Dependent
variable: Agree2ijt 41
Table B.9 Sub Sample based on Political Alignment. Dependent
variable: Agree3ijt 42
Table B.10 Heterogeneous effect based on election criterion 42
Table B.11 Neighbor’s Impact for Different absence rates. Dependent
Variable: Agree2ijt 43
Table B.12 Neighbor’s Impact for Different absence rates. Dependent
Variable: Agree3ijt 43
Table B.13 Analysis by Agreement Rate. Dependent Variable: Agree2ijt 43
Table B.14 Analysis by Agreement Rate. Dependent Variable: Agree3ijt 44List of tables 10
Table B.15 Analysis by Type of Proposition. Dependent Variable:
Agree2ijt 44
Table B.16 Analysis by Type of Proposition. Dependent Variable:
Agree2ijt 44
Table B.17 Analysis by Type of Proposition. Dependent Variable:
Agree3ijt 45
Table B.18 Analysis by Type of Proposition. Dependent Variable:
Agree3ijt 45
Table B.19 Analysis by proportion of time away from position. De-
pendent Variable: Agree2ijt 45
Table B.20 Analysis by proportion of time away from position. De-
pendent Variable: Agree3ijt 46
Table C.1 Agree1 - Sample 1 47
Table C.2 Agree2 - Sample 1 47
Table C.3 Agree3 - Sample 1 48
Table C.4 Agree1 - Sample 2 48
Table C.5 Agree2 - Sample 2 49
Table C.6 Agree3 - Sample 2 49
PUC-Rio - Certificação Digital Nº 1612158/CA1
Introduction
Political polarization appears to be an ongoing event on some countries of
the world1 . (40) present evidence that ideological polarization has been rising
in the USA since 1970’s among members from different parties. A similar
picture can be seen in Brazil using LAPOP (Latin American Public Opinion
Project) data. In their questionnaire, interviewees are asked to classify their
political ideology in a scale from from 1 (left wing) to 10 (right wing). While
in 2006, only 13.52% of interviewees classified themselves as 1 or 10, in 2016,
this percentage rose to 23.85%.
Existing literature has attributed this phenomenon to the rise of social
media ((36)), while some argue that it cannot be addressed to them ((37)).
PUC-Rio - Certificação Digital Nº 1612158/CA
Regardless of its source, political polarization of the population is expected
to have impacts on elections and, as shown by (35), it can lead to severe
consequences for a country, such as the rise of xenophobic views among the
people . Given that, it is important to understand what can be done to
overcome this polarization and increase agreement between politicians. In
this work I test if congressman’s decision process is affected by his peers.
Specifically, I analyze if office neighbors have a higher agreement in a legislative
voting.
The analysis uses data from all 513 federal deputies elected in 2010 for the
54th legislature (2011-14) and for those elected in 2014 for the 55th legislature
(2015-18) in Brazil for all 26 states and the federal district2 . The data contains
their votes for 1036 roll-call voting that took place in the Brazilian Congress
between February 2011 and May 2017. In this paper, I test if office neighbors
are more likely to agree on legislative voting. However, this is difficult due to
the reflection problem ((14)). That problem arises from the fact deputies can
choose their office seeking to be neighbor to politicians with similar preferences.
In that case, a possible similarity in voting behavior due to other social links
might be mislabeled as a peer effect from spatial proximity.
In order to overcome this problem, I use an office lottery, mandatory only
for first term male deputies, that randomly allocate them in vacant offices in
1
(41), (38) and (39) present evidence and discussions about polarization
2
Throughout this paper, I’ll treat the federal district as another state, since it is a unit
of the federation as are all the Brazilian statesChapter 1. Introduction 12
Brazil. The sample was restricted for 227 deputies that participated in the
lottery (114 in the 54th and 113 in the 55th). The sample restriction allows me
to estimate the causal impact of office proximity in the likelihood of agreement
between two politicians. Given that the randomized deputies were elected for
the first time, it is likely that they do not have yet developed strong ties with
other deputies. In this case, the office proximity might help them develop a
social relation with their neighbors and, once it is established, it will make
both deputies subject to be influenced by each other.
My findings indicate that office neighbors do not have a more similar
voting behavior in a legislative voting. Perhaps it is possible that politicians
must share other social links, such as being affiliated to the same party or
representing the same state, to develop a stronger tie due to office proximity.
However, the results were similar for sub samples that belong to the same
party, same state, same coalition and similar political ideology. No impacts
were found when restricting the sample for different types of proposition and
for different measures of importance of the voting.
Those findings might be due to the fact that a federal deputy, in Brazil,
PUC-Rio - Certificação Digital Nº 1612158/CA
can be temporarily away from his position to assume another one. Therefore,
another possible exercise is to restrict the sample of deputies based on the
proportion of time that they are licensed from their offices, since it is likely
that social ties are only built for those that remain most of their term in
office. But, even for deputies that were not licensed, spatial proximity does
not generate a higher voting agreement.
This paper is closely related with the literature of peer effects among
politicians. (15) use an office lottery in the US congress for newly elected
members to estimate peer effects on roll call behavior and bill co-sponsorship.
However, the US office lottery randomly selects the order in which newly
elected deputies choose their office, instead of randomly allocating them. This
allows them to choose neighbors with similar political views, which is different
from the Brazilian lottery. Apart from that, they can only observe if two
congressmen are in the same wing of a building, whereas this paper can observe
if two deputies are next door neighbors and if it affects the deputy voting
behavior.
(16) study the existence of peer effects on legislative voting on the Eu-
ropean Parliament. The authors explore a quasi-random seating assignment
determined alphabetically by politician’s last name. However, European polit-
ical groups sits in block in Parliament and the alphabetical assignment only
happens within parties. They conclude that seating together decreased the
probability of two members of the European Parliament disagreeing in a leg-Chapter 1. Introduction 13
islative voting by 13.1 percent.
(4) empirically estimates another possible channel for peer effects: learn-
ing on the job. Using an annual lottery that randomly assigned seats to MPs
in Iceland, they observe that politicians sitting together have higher language
similarity in speeches, but only if they are on the same political group. Since
this effect is only observed after seating together for a year, the authors argue
that this is an indication of learning on the job.
The present work can be placed in the same literature as the previously
cited articles. It differentiates from (4) by looking at peer effects on legislative
voting, instead of looking on language similarity and from (16) by looking at
office neighbors instead of parliament seating neighbors.
This work also contributes to the literature on sources of influence on
congressional voting. Contributions have been provided regarding the impact
of family background, parties, composition of supporters and protests on voting
behavior ((17), (18), (18), (19) (20) and (21), (5)). Since it focus on the
Brazilian congress, it also add to the literature that analyzes aspects of the
Brazilian legislative, such as (22), (23), (24) and (9). And also broadly relates
PUC-Rio - Certificação Digital Nº 1612158/CA
with the literature that estimates the presence of peers effects ((25), (26) are
examples of peers effects in schools, while (1) and (2) present peer effects on
sports and workplaces).
The remainder of this work is organized as follows. Sections 2 and 3
present a brief summary on political networks and on Brazil’s federal house of
representatives composition and functioning, respectively. Section 4 explains
the data and the empirical strategy applied, whereas section 5 presents the
results. Section 6 concludes.2
Political Networks
Any political environment, such as the Congress, is a place of constant
interaction between its members. This is even more important in a democracy
where congressmen must meet with their peers to listen their suggestions
and demands before having a legislation voted if they seek to increase their
likelihood of having it approved. Also, as any other workplace, congressmen
tend to have more frequently interaction with coworkers that share the most
similarities. For example, members with similar political ideology or that
represent the same state might develop a stronger relationship. Given their
different backgrounds and characteristics, each politician might developed
distinct connections with his peers. That is why (10) suggested that the politic
PUC-Rio - Certificação Digital Nº 1612158/CA
context should be understood as a social network.
In that setting, politicians are nodes connected by social links created and
developed by reasons such as similar political ideology, similar backgrounds
and/or spatial proximity. Once linked, it is expected to see a greater cohesion
between those congressmen. The literature presents evidence that having
similar features impacts on-the-job features such as their voting behavior
((12), (17), (28), (29), (16)) and their policies’ beliefs ((13)), as well as their
electoral pretensions, since the more connections a congressman has, the higher
his campaign contributions ((27)). Thus, politicians might have incentives to
maintain and possibly expand his connections in Congress.
Therefore, the literature indicates that peer effects appear to take place
in a Congressional environment. Nevertheless, the mechanism through which
they act is sometimes unclear. One possible channel is through social learning
among congressmen, as observed in (4) for language similarity in speeches
in Parliament. In a context of legislative voting, social learning might occur
through information sharing. In a given network, each congressman might be
specialized in a different subject. In this scenario, how a politician shares his
knowledge about a certain policy might lead the members of his network to
vote more like him, generating a higher likelihood of agreement in a voting.
This greater cohesion might also appear if congressmen want to learn from his
most successful peers, such as those that have received the larger number of
votes in the election, and emulate their behavior.Chapter 2. Political Networks 15
Another possible mechanism is related to social pressure and its strategic
behavior. Even in the theoretical field it is hard to disentangle those two
effects. As argued before, it is possible that in a situation some congressmen
might pressure a minority to follow the desire of a majority. That would be an
indication of social pressure. However, if the minority agrees with the condition
the majority supports them in the future, that would be characterize as
strategic behavior, since they are exchanging favours. Therefore, social pressure
and strategic behavior must be understood together, as a single mechanism.
(5) modeled this type of interaction and found evidence that there is indeed
complementarities between the efforts of congressmen in passing legislation.
Even though social networks in Congress are part of the congressmen
voting decision, it is possible that those impacts are not homogeneous. As
discussed before, social ties might be stronger when politicians share more than
one link. For example, being office neighbors and belonging to the same party or
representing the same state and seating next to each other during votes might
generate a larger voting cohesion that only sharing one of those links. The size
of the influence might also vary depending on the importance of the voting.
PUC-Rio - Certificação Digital Nº 1612158/CA
On one hand, a voting with high absence rate can be considered unimportant,
therefore congressmen might more susceptible to be persuaded by politicians
that are interested in the outcome of the voting. On the other hand, a more
controversial voting (where there is a high percent disagreement) might be
seen as important by the politicians and they would use all their connections
to influence its outcome. In both cases, we should observe a higher likelihood
of agreement.
Since this article intends to observe if office neighbors have a higher
probability of agreement on a legislative voting, those impacts rely on one
hypothesis: congressmen are present in their office during work days. If
politicians prefer to be in the aisles of the Congress instead of being in their
offices, the social ties between neighbors will not be created and, therefore,
they will not influence themselves.3
Brazil’s Chamber of Deputies
3.1
Background
General elections are held in Brazil every four years. In those, the
population chooses its president, state governors, senators, federal and state
deputies. The analysis provided here focus only in federal deputies. In each poll,
513 deputies are elected across the 26 states and the federal district (Brasília).
They are chosen in a proportional open list system, where the list is formed
by all candidates for federal deputy in a coalition1 and ordered according to
number of votes that each one received. In each state, parties in a coalition
PUC-Rio - Certificação Digital Nº 1612158/CA
sum all the votes that their candidates have received and divided that total
by the electoral coefficient in that state (defined as the ratio between the total
votes received by all candidates for that position and the number of deputies
in that state defined by the Brazilian constitution). The integer part of that
ratio will be the number of deputies elected in that list. The remaining seats
are distributed according to the Maiores médias ("higher averages") criteria.
An important aspect of the Brazilian elections is that federal deputies can seek
reelection for unlimited terms2 .
Another unusual characteristic of Brazil’s political system is the number
of parties represented in Congress (25 in 2010 and 28 in 2014)3 . This large num-
ber of political parties illustrates how politically fragmented is the Brazilian
Congress4 and highlights the need of the president’s party to form a coalition
to be able to govern the country, as first explained by (43).
In Brazil, a federal deputy is responsible for inspect the actions of
Executive power and propose, discuss and vote on legislative matters. Those
activities take place in Brasília, Brazil’s federal district. However, they can
1
Parties’ coalition may differ between state and position. The coalition in a given state
may differ from the national coalition used in the presidential race
2
(30) and (31) presents discussions about Brazil’s elections.
3
This represents the number of parties represented by federal deputies right after the
election. During the term, congressmen can, in specific situations, transfer to a different
party. The entire list of parties represented in Congress in each year and the number of
deputies elected is in table B.1 in appendix B.
4
(32) discuss some implications of Brazil’s multiparty system.Chapter 3. Brazil’s Chamber of Deputies 17
take temporarily licenses from their position to assume another one, such as
minister or a state secretary, for example. If that happens, he is replaced by
the next non-elected candidate on his list until he returns.
3.2
Congressional Voting
Brazil has a bicameral system, composed by the Senate and the Federal
Chamber of Deputies. This article focus on the voting behavior of Chamber’s
members (federal deputies). There are six main types of legislative proposi-
tion: Ordinary law, Complementary law, Provisional Measure, Constitutional
Amendment Project (PEC), Legislative Decree and Resolution for Internal
Regulation. The last two voting are the only types that are not obliged to
be voted in both houses. The remaining four can be voted in only one round
(Ordinary Law and Provisional Measure) or in two round system (PEC and
Complementary Law). They can also differentiate themselves by the number of
deputies required to approve it. Provisional measures and ordinary laws require
only a present majority to be approved, whereas complementary law requires
PUC-Rio - Certificação Digital Nº 1612158/CA
an absolute majority (at least half of all deputies, whether they are present
or not) and PEC requires a qualified majority (three fifths of of all deputies).
Also, federal deputies vote on requirements that, in general, are related to re-
quests to change dates of voting and they vote on whether they accept or not
a presidential veto on a matter.
Propositions can only be taken to vote in the Congress if there are at least
257 deputies (half of all deputies) present in the House. If required quorum
is presented, the propositions in the agenda, that is defined by the president
of the Chamber, are voted. In a voting, a deputy can vote in favor of the
proposition, against or he can abstain from the voting. Besides that, he can be
absent due to private reasons or due to a political maneuver by his party called
obstruction, where the leader of the party asks all its affiliates to withdrawn
from the plenary.
3.3
Office Lottery
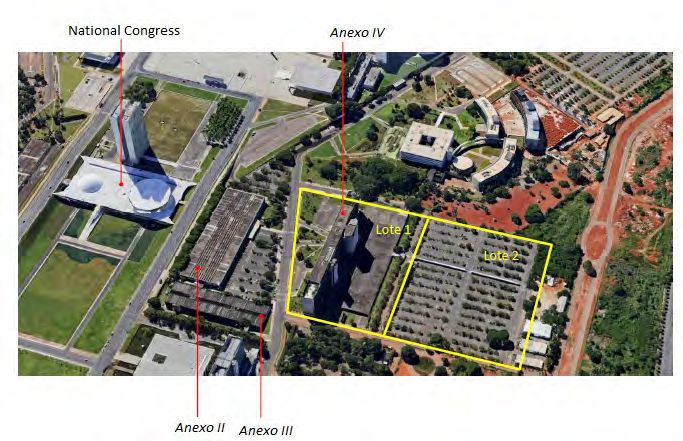
The Chamber of Deputies is located in the Brazil’s federal district,
Brasília. Its main complex is composed by National Congress (which is where
the Plenary is located) and three buildings, known as Anexo II ,III and IV 5 .
Federal deputies’ offices are divided in two buildings: Anexo III and Anexo
IV. The first one has 81 offices in only one floor and the remaining offices are
5
An aerial photo of the complex is in figure A.1Chapter 3. Brazil’s Chamber of Deputies 18
located on other building and are divided in 8 floors. Usually, deputies prefer
offices on Anexo IV since they are bigger than the ones in Anexo III and have
a private bathroom, whereas the only advantage from Anexo III ’s is being
closer to the congress building6 .
In order to determine offices allocation, the president of Brazil’s chamber
of federal deputies issued a statement in October 2006 regulating its rules.
It was defined that there will be a lottery to determine each deputy office.
However, it would not participate in the lottery former elected deputies (that
were elected in any previous legislature), deputies that served as replacement
in the previous legislature, disabled deputies, congressmen older than 60 years
old, women deputies, former Chamber of Deputies’ president and first degree
relative of non-reelected deputies.
Therefore, the office lottery would randomly allocate first term male
deputies that are not related to any non-reelected deputy in the vacant offices.
In the 54th legislature (2011-2014), 114 politicians participated in the lottery.
As for the 55th legislature (2015-2018), 137 deputies participated in the lottery
but only 113 deputies were randomly assigned to an office, where 66 offices were
PUC-Rio - Certificação Digital Nº 1612158/CA
in the Anexo IV building and the 47 remaining were in Anexo III 7 . The reasons
for office changes by the other congressmen are undisclosed. From the group of
113 deputies, 4 were licensed during the whole analyzed period and, therefore,
are not part of the study.
6
Figure A.2 shows the Anexo III only floor plan and figure A.3 shows the Anexo IV 2nd
floor that it is organized in the same way as the other 7 floors in that building.
7
https://www.youtube.com/watch?v=tg_wNDU-Frg : Link for a short video of the
lottery4
Data and Empirical Strategy
The data used in this article was provided by Brazil’s Chamber of
Deputies. It was collected the votes on legislative voting from all federal
deputies that took place between February 2011 and May 2017. In that period,
1036 propositions were put to vote in a plenary session. It was also gathered
information regarding the results of the office lottery, the office number of each
federal deputy in that period, as well as their party and the state that they
represent. The data contains only federal deputies that were elected in 2010
and 2014 for the 54th (2011-2014) and 55th legislature (2015-2018), therefore
dismissing information about replacement deputies.
As explained in section 3, each federal deputy have five different options
PUC-Rio - Certificação Digital Nº 1612158/CA
in a voting: he can vote "yes", "no" or abstain himself, he may choose not
to attend to the voting and he can be obstructed by his party. Since this
paper intends to analyze if office neighbors have a higher voting cohesion, it
is important to determine measures of agreement. However, only the first two
options (vote yes or no) clearly states their preferences. In a case where both
deputies abstain from voting or are absent, it is not clear if they influenced
themselves or not. For example, two deputies can choose to be absent in a
voting because they do not want to vote against or in favor of a proposition
or they can be absent because both have different private reasons to miss the
session. This does not happen when a deputy is obstructed given that this
is a party maneuver and does not necessarily represent deputy’s opinion on
that matter. Thus, three different agreement measures are used based on their
possible "valid actions", as shown in table 4.1.
Table 4.1: Agreement Measures
Variable Valid Actions
Agree1ijt Vote yes or no
Agree2ijt Vote yes, no or abstain from voting
Agree3ijt Vote yes, no, abstain or be absent
The variable Agreeijt equals 1 if deputies i and j perform the same
"valid action" in the voting t and 0 if they act differently within the set ofChapter 4. Data and Empirical Strategy 20
"valid actions". If i or j perform an action that is not valid, Agreeijt assumes
a missing value.
The agreement measures were only calculated for federal deputies that
participated in the lottery in order to observe a causal effect of spatial
proximity. Each one of the 227 randomly allocated politicians is analyzed in
pairs with all the other 512 deputies in his legislature for each of the proposition
that both participated. Table 4.2 presents a summary of the agreement
measures used in the analysis. The large number of observations is explained by
the use of dyadic data (where each observation is a pair of congressmen).The
distinct mean and the difference in the number of observations across the
agreement measures arise from the fact that different agreement measures have
different set of "valid actions". Therefore, some observations valued as 0 or 1
in Agree3ita are possibly classified as missing in Agree1ijt or Agree2ijt .
As previously mentioned, I intend to analyze if office neighbors have
a higher likelihood of agreement. Here, office neighbors are defined as the
deputies located on the left and on the right of a given office. In the case that
a office have a hallway on its left or right, only the neighbors next-door are
PUC-Rio - Certificação Digital Nº 1612158/CA
considered. For example, office 379 have only one neighbor, 380 and the same
with office 215 whose only neighbor is 213.1 .
Additional variables were defined for the intended analysis. SameP artyijt
and SameStateij are dummy variables that indicate if deputies i and j are
affiliated with same party and if they represent the same state, respectively. It
is important to emphasize that SameP artyijt is indexed by t because deputies
change parties during his term in Congress, under some conditions. Then, it
is possible that i and j might belong to the same party in t voting but not in
t+1.
Table 4.2: Summary of Agreement Measures
Variable Obs Mean Std. Dev.
Agree1ijt 21,048,724 0.716 0.451
Agree2ijt 21,329,850 0.707 0.455
Agree3ijt 40,129,499 0.488 0.500
N eighborij 53,560,563 0.003 0.052
SameP artyij 47,731,154 0.079 0.270
SameStateij 53,207,241 0.059 0.236
The ideal setting to estimate spacial proximity effects would consist in all
politicians being randomly allocated in different offices at the beginning of their
1
The floor plans are in figures A.2 and A.3 on appendix AChapter 4. Data and Empirical Strategy 21
terms. Even though the Brazilian Congress does an office randomization, as
explained in section 3, only for first term male deputies participate. Therefore,
using all federal deputies would probably lead to a biased estimated since
non-randomized deputies might choose offices near colleagues that behave
similarly to him. In this scenario, it is likely that a similar behavior in legislative
votes should be observed but it can not be addressed to the office proximity.
Therefore, it is necessary to restrict the sample for those that were randomized,
observe their agreement with all the other deputies and analyze if they have a
higher probability of agreement with their office neighbor. Hence, the intended
regression would be:
Agreeijt = α+βN eighborijt +γ1 SameP artyijt +γ2 ∗SameStateij +δt +it (4-1)
Where i is a randomized deputy, j is another deputy (randomized or not)
from i’s legislature, t is a voting in the Congress. N eighborijt , SameP artyijt
and SameStateijt are constructed as explained before. δt are voting fixed
effects. Thus, β would estimate the impact of office proximity in the likelihood
PUC-Rio - Certificação Digital Nº 1612158/CA
of agreement between two federal deputies.
The regression is estimated by OLS. Since this is a dyadic data, an
observation is a pair of politicians observed in a voting. This implies that there
is a mechanical correlation on error terms between pairs that share at least
one member. Following (33), I estimate dyadic-cluster robust standard errors
to deal with this possible correlation. Nonetheless, this is very demanding
computationally due to the fact that there are more than 100,000 pairs (each
randomized congressman forms a pair with all the others congressmen). An
alternative possibility is to calculate standard errors using robust two-way
clustering at each deputy level ((34)).
Using only cluster at each pair level, I would ignore all the other
correlation between pairs. If I use two-way clustering (that is computationally
feasible) instead, the standard errors would be estimated taking into account
the correlation between pairs (i, j) and (i’, j’) when i = i’ or j = j’. Therefore
this method does not estimate the possible correlation between pairs when i =
j’ or j = i’. The only problem is that, if those correlations are large, that would
generate incorrect estimation of the standard errors. Thus, in order to observe
the size of that correlations, I selected two 1% sub samples and estimated the
baseline regression using two-way cluster and dyadic-cluster. The results can
be seen in appendix C. The tables indicate that both estimate are very close
and, therefore, using two-way cluster would not generate a significant bias in
the standard errors estimate.5
Results
The first analysis observes if office proximity generates a higher likelihood
of agreement in a voting regardless of sharing other social ties. The estimates
for equation (1) are presented in table 5.1. For the first two measures of
agreement, the estimate is not statistically significant at 10%, whereas for
Agree3ijt it is at 10%. Nevertheless, its point estimates is very small, as are
the others. It indicates an increase of 0.2 to 1.1 percentage points on the
probability of agreement, which represents less than 1% increase for the first
two measures and less than 2.2 % for the third. Therefore, this suggests that
neighbors do not tend to agree more in a voting.
PUC-Rio - Certificação Digital Nº 1612158/CA
Table 5.1: Baseline Results
(1) (2) (3) (4) (5) (6)
VARIABLES Agree1ijt Agree1ijt Agree2ijt Agree2ijt Agree3ijt Agree3ijt
Neighborijt 0.00220 0.00192 0.00221 0.00199 0.0104* 0.0106*
(0.00816) (0.00789) (0.00809) (0.00786) (0.00589) (0.00588)
Observations 20,898,000 20,898,000 21,177,319 21,177,319 39,889,223 39,889,223
R-squared 0.019 0.013 0.019 0.013 0.004 0.004
Voting FE No Yes No Yes No Yes
Notes: Each column represents a distinct specification. Additional controls used: same state, same party
and legislature dummies. Agreeijt and N eighborijt are dummy variables respectively indicating if deputies
i and j voted in the same way in proposition t and if i and j are next-dorr office neighbors.Standard
errors are clustered at each deputy level. When *** pChapter 5. Results 23
It is important to make a remark on the estimate of the N eighborijt
on Agree3ijt for the sub sample of members from the same party. The point
estimates presents 3.4 p.p. increase in the likelihood of agreement if the federal
deputies are neighbor, which represents a 5.7% increase in the measure of
agreement. This estimate is significant at 1%. However, this effect appears
to be driven by the deputies’ absence on voting. This suggests at least
two possibilities. On one possible scenario, a deputy might observe another
politician being absent and probably not facing any problems. Therefore, he
might learn how to be absent and not face problems with neither the chamber
nor their party and starts being absent too. In this case it does not represent
an influence in the actual voting behavior. It only relates with learning the
procedures of the house. Another possibility is associated with the aim of
this article. It is possible that they both are absent because they agreed to
be against a certain legislation and do not want to exposed their position in
Congress. Nonetheless, I am not able to distinguish which situation is taking
place here.
PUC-Rio - Certificação Digital Nº 1612158/CA
Table 5.2: Sub Sample: Pairs from the Same Party
(1) (2) (3) (4) (5) (6)
VARIABLES Agree1ijt Agree1ijt Agree2ijt Agree2ijt Agree3ijt Agree3ijt
Neighborijt 0.0118 0.00490 0.0111 0.00404 0.0349*** 0.0342***
(0.0121) (0.0118) (0.0129) (0.0124) (0.0125) (0.0126)
Observations 1,622,443 1,622,443 1,642,594 1,642,594 3,046,547 3,046,547
R-squared 0.006 0.004 0.005 0.003 0.000 0.001
Voting FE No Yes No Yes No Yes
Mean of Dep. Var. 0.887 0.887 0.877 0.877 0.593 0.593
Notes: Each column represents a distinct specification. Standard errors are two way clustered at each
federal deputy level. Additional controls are used: same state and legislature dummies. Agreeijt and
N eighborijt are dummy variables respectively indicating if deputies i and j voted in the same way in
proposition t and if i and j are next-dorr office neighbors. When *** pChapter 5. Results 24
Table 5.3: Sub Sample: Pairs from the Same State
(1) (2) (3) (4) (5) (6)
VARIABLES Agree1ijt Agree1ijt Agree2ijt Agree2ijt Agree3ijt Agree3ijt
Neighborijt 0.0178 0.0209 0.0143 0.0174 0.0504 0.0500
(0.0719) (0.0700) (0.0713) (0.0696) (0.0433) (0.0434)
Observations 1,188,045 1,188,045 1,203,205 1,203,205 2,265,347 2,265,347
R-squared 0.027 0.018 0.026 0.017 0.006 0.005
Voting FE No Yes No Yes No Yes
Mean of Dep. Var. 0.721 0.721 0.712 0.712 0.492 0.492
Notes: Each column represents a distinct specification. Standard errors are two way clustered at each
federal deputy level. Additional controls are used: same state, same party and legislature dummies.
Agreeijt and N eighborijt are dummy variables respectively indicating if deputies i and j voted in the
same way in proposition t and if i and j are next-dorr office neighbors. When *** pChapter 5. Results 25
Table 5.4: Sub Sample based on Political Ideology. Dependent variable:
Agree1ijt
(1) (2) (3) (4) (5) (6)
VARIABLES Both Left Both Center Both Right
N eighboritj 0.0447** 0.0377* -0.0159 -0.00562 0.0188* 0.0135
(0.0224) (0.0217) (0.0193) (0.0175) (0.0101) (0.00973)
Observations 2,522,679 2,522,679 981,872 981,872 5,424,775 5,424,775
R-squared 0.074 0.054 0.060 0.064 0.006 0.004
Voting FE No Yes No Yes No Yes
Mean of Dep. Var 0.744 0.744 0.757 0.757 0.802 0.802
Notes: Each column represents a distinct specification. Additional controls are used such as: same
state, same party, same floor and legislature dummies. Standard errors are clustered at each deputy
level. Agreeijt and N eighborijt are dummy variables respectively indicating if deputies i and j voted
in the same way in proposition t and if i and j are next-dorr office neighbors. When *** pChapter 5. Results 26
supported the winning candidate in the presidential election, otherwise he was
considered to be a part of the opposition4 . As seen in table 5.6, the estimates are
not statistically significant regardless if the politicians are politically aligned
or not5 .
Table 5.6: Sub Sample based on Political Alignment. Dependent variable:
Agree1ijt
(1) (2) (3) (4) (5) (6)
VARIABLES Both Gov. Coalition Both Opposition Gov. Coalition and Opposition
N eighboritj 0.00532 0.00439 -0.00718 0.00468 0.00254 0.00229
(0.0101) (0.00895) (0.0141) (0.0143) (0.0102) (0.00976)
Observations 8,507,021 8,507,021 3,848,609 3,848,609 11,219,056 11,219,056
R-squared 0.032 0.016 0.020 0.018 0.004 0.000
Voting FE No Yes No Yes No Yes
Mean Dep. Var. 0.766 0.766 0.740 0.740 0.670 0.670
Notes: Both Gov. Coalition: Sub sample where both deputies i and j belongs to parties that supported the
winning presidential candidate in the election. Both Opposition: Sub sample where both deputies i and j belongs
to parties that supported a presidential candidate that lost in the election. Gov. Coalition and Opposition: Sub
PUC-Rio - Certificação Digital Nº 1612158/CA
sample where one of the deputies supported the winning candidate and the other supported a losing candidate
in the presidential election. Each column represents a distinct specification. Additional controls are used such as:
same state, same party, same floor and legislature dummies. Standard errors are clustered at each deputy level.
Agreeijt and N eighborijt are dummy variables respectively indicating if deputies i and j voted in the same way
in proposition t and if i and j are next-dorr office neighbors. When *** pChapter 5. Results 27
Table 5.7: Heterogeneous effect based on election criterion
(1) (2)
VARIABLES Agree1ijt Agree1ijt
N eighboritj -0.0111 0.00411
(0.0173) (0.00639)
N eighboritj *1{Elect by Electoral Coefficient} 0.0181 0.0194
(0.0188) (0.0186)
Observations 23,574,686 23,574,686
R-squared 0.019 0.013
Voting FE No Yes
Mean Dep. Var. 0.716 0.716
Notes: Elect by Electoral Coefficient is a dummy that indicates if a deputy was
elected by the electoral coefficient. Additional controls are used such as: same
state, same party, same floor and legislature dummies. Standard errors are clustered
at each deputy level. Agreeijt and N eighborijt are dummy variables respectively
indicating if deputies i and j voted in the same way in proposition t and if i and j
are next-dorr office neighbors. When *** pChapter 5. Results 28
Table 5.8: Analysis by Absence Rate. Dependent Variable: Agree1ijt
(1) (2) (3) (4) (5) (6) (7) (8)
VARIABLES 1st Quartile 2nd Quartile 3rd Quartile 4th Quartile
Neighborijt 0.00670 0.00779 0.000638 0.00131 -0.00177 -0.00284 -0.00253 -0.00537
(0.01000) (0.00986) (0.00808) (0.00781) (0.00845) (0.00818) (0.00976) (0.00917)
Observations 8,146,280 8,146,280 6,031,552 6,031,552 4,285,262 4,285,262 2,572,406 2,572,406
R-squared 0.015 0.014 0.017 0.014 0.010 0.011 0.016 0.012
Voting FE No Yes No Yes No Yes No Yes
Mean of Dep. Var. 0.662 0.662 0.716 0.716 0.768 0.768 0.797 0.797
Notes: Each column represents a distinct specification. In the first quartile are all the proposition with less than 20.1% of deputies
absent. In second, all the propositions had between 20.1% and 29.3% of deputies absent, whereas the in third it was between 29.3%
and 37.4%. The remaining propositions are in the fourth quartile. Standard errors are two way clustered at each federal deputy
level. Additional controls are used: same state, same party and legislature dummies. Agreeijt and N eighborijt are dummy variables
respectively indicating if deputies i and j voted in the same way in proposition t and if i and j are next-dorr office neighbors.
When *** pChapter 5. Results 29
Table 5.10: Analysis by Type of Proposition. Dependent Variable: Agree1ijt
(1) (2) (3) (4) (5) (6) (7) (8)
VARIABLES PEC PDC PL PLP
Neighborijt -0.00570 -0.00507 0.0153 0.0157 0.00122 0.00158 -0.0119 -0.0141
(0.00976) (0.00940) (0.0153) (0.0139) (0.00941) (0.00911) (0.0109) (0.0109)
Observations 5,292,476 5,292,476 276,658 276,658 3,502,819 3,502,819 2,182,151 2,182,151
R-squared 0.037 0.007 0.013 0.012 0.019 0.018 0.006 0.007
Voting FE No Yes No Yes No Yes No Yes
Mean of Dep. Var. 0.791 0.791 0.785 0.785 0.616 0.616 0.773 0.773
Notes: Each column represents a distinct specification. PEC, PDC, PL and PLP stands for Constitutional Amendment Project,
Legislative Decree Project, Ordinary law and Complementary law Projects, respectively. Standard errors are two way clustered
at each federal deputy level. Additional controls are used: same state, same party and legislature dummies. Agreeijt and
N eighborijt are dummy variables respectively indicating if deputies i and j voted in the same way in proposition t and if i and
j are next-dorr office neighbors. When *** pChapter 5. Results 30
Since there is available data on each deputy’s time away from the position, I
used sub samples of deputies that in no period were licensed and for deputies
that were licensed at most 10%, 25% and 50% of their term. However, all
estimates were not statistically significant. This might be an indication that
office neighbors do not create a social tie strong enough to generate an influence
on each other.
Table 5.12: Analysis by proportion of time away from position. Dependent
Variable: Agree1ijt
(1) (2) (3) (4) (5) (6) (7) (8)
VARIABLES Prop. Away = 0 Prop. Away < 0.1 Prop. Away < 0.25 Prop. Away < 0.5
Neighborijt 0.00670 0.00594 0.000613 0.000228 0.00549 0.00527 0.00351 0.00339
(0.00821) (0.00796) (0.00832) (0.00803) (0.00830) (0.00803) (0.00834) (0.00807)
Observations 18,024,114 18,024,114 18,985,854 18,985,854 20,031,454 20,031,454 20,353,143 20,353,143
R-squared 0.019 0.013 0.019 0.013 0.019 0.013 0.019 0.013
Voting FE No Yes No Yes No Yes No Yes
Mean of Dep. Var. 0.715 0.715 0.716 0.716 0.714 0.714 0.714 0.714
Notes: Each column represents a distinct specification. Standard errors are two way clustered at each federal deputy level.Standard errors
are two way clustered at each federal deputy level. Additional controls are used: same state, same party and legislature dummies. Agreeijt
and N eighborijt are dummy variables respectively indicating if deputies i and j voted in the same way in proposition t and if i and j are
next-dorr office neighbors. When *** p6
Conclusion
The rise of political polarization in recent years might have some severe
consequence as shown by (35). Thus, understand what increases cohesion
between politicians might help to diminish this movement. In this paper, I test
if office neighbors have a higher likelihood of agreement in a legislative voting.
Since individuals can select their neighbors according to similar preferences, I
used a lottery conducted by the Brazilian Congress that randomized first term
male federal deputies in vacant offices to deal with the reflection problem.
The analysis was made using data from the Brazilian Congress. It was
collected the votes from 1036 voting that took place between February 2011
and May 2017 for all the 1036 federal deputies elected in 2010 and 2014 for
PUC-Rio - Certificação Digital Nº 1612158/CA
the 54th (2011-2014) and 55th legislature (2015-2018). The results indicates
that congressmen do not have a higher probability of agreement with a office
neighbor. The results stand when restricting the sample for pairs of the same
party and for pairs that represents the same state, which indicates that, even
when sharing previous links do not, neighbors do not have a larger probability
of agreement. The conclusion was the same when estimated for different sub
samples of voting, divided by level of importance and by type of proposition.
Since the Brazilian government allows federal deputies to temporarily be
licensed from their position, I ran the same analysis restricting the sample
for federal deputies with different proportions of time away from its office, but
not impact was found despite it.
There are some possibles explanations for the absence of effect. The first
one relies on the definition of a politician. If he is a representative of his
supporters, perhaps he should not be influenced by his peers, only by the
opinion and desire of his voters. However, this is not necessarily true given
that electors do not have always an opinion on a certain matter.
Another possibility for these results relies on the fact that the offices
are located in a different building from the plenary. It can be possible that
the deputies actually spend their work hours gathered on the aisles of the
Congress, while their advisers remain in office. In that case, neighbors do not
create social links and, therefore, do not impact themselves. Nonetheless, there
are no data available to test this hypothesis.Bibliography
[1] GARICANO, L.; PALACIOS-HUERTA, I. ; PRENDERGAST, C.. Fa-
voritism under social pressure. The Review of Economics and Statistics,
87(2):208–216, 2005.
[2] MAS, A.; MORETTI, E.. Peers at work. The American economic review,
99(1):112–145, 2009.
[4] JO, D.; LOWE, M.. Social learning of political elites. Working Paper,
2017.
[5] CANEN, N.; TREBBI, F.. Endogenous network formation in
congress. Technical report, National Bureau of Economic Research, 2017.
PUC-Rio - Certificação Digital Nº 1612158/CA
[9] BUTTÒ, M.; PEREIRA, C. ; TAYLOR, M.. Sunshine or shield? secret
voting procedures and legislative accountability. Journal of Artificial
Societies and Social Simulation, 17(4):10, 2014.
[10] LAZER, D.. Networks in political science: Back to the future. PS:
Political Science & Politics, 44(1):61–68, 2011.
[12] ARNOLD, L. W.; DEEN, R. E. ; PATTERSON, S. C.. Friendship and
votes: The impact of interpersonal ties on legislative decision
making. State and Local Government Review, 32(2):142–147, 2000.
[13] RINGE, N.; VICTOR, J. N. ; GROSS, J. H.. Keeping your friends close
and your enemies closer? information networks in legislative
politics. British Journal of Political Science, 43(3):601–628, 2013.
[14] MANSKI, C. F.. Identification of endogenous social effects: The
reflection problem. The review of economic studies, 60(3):531–542, 1993.
[15] ROGOWSKI, J. C.; SINCLAIR, B.. Estimating the causal effects of
social interaction with endogenous networks. Political Analysis,
20(3):316–328, 2012.
[16] HARMON, N.; FISMAN, R. ; KAMENICA, E.. Peer effects in legislative
voting. Working Paper, 2017.Bibliography 33
[17] SNYDER JR, J. M.; GROSECLOSE, T.. Estimating party influence in
congressional roll-call voting. American Journal of Political Science, p.
193–211, 2000.
[18] CAREY, J. M.. Competing principals, political institutions, and
party unity in legislative voting. American Journal of Political Science,
51(1):92–107, 2007.
[18] FUJIWARA, T.. Voting technology, political responsiveness, and
infant health: Evidence from brazil. Econometrica, 83(2):423–464,
2015.
[19] CASCIO, E. U.; WASHINGTON, E.. Valuing the vote: The redistribu-
tion of voting rights and state funds following the voting rights
act of 1965. The Quarterly Journal of Economics, 129(1):379–433, 2013.
[20] MADESTAM, A.; SHOAG, D.; VEUGER, S. ; YANAGIZAWA-DROTT, D..
Do political protests matter? evidence from the tea party move-
ment. The Quarterly Journal of Economics, 128(4):1633–1685, 2013.
PUC-Rio - Certificação Digital Nº 1612158/CA
[21] MCGUIRK, E.; HILGER, N. ; MILLER, N.. No kin in the game: Moral
hazard and war in the us congress. Technical report, National Bureau
of Economic Research, 2017.
[22] ALSTON, L. J.; MUELLER, B.. Pork for policy: executive and legisla-
tive exchange in brazil. Journal of Law, Economics, and Organization,
22(1):87–114, 2005.
[23] FIGUEIREDO, A. C.; LIMONGI, F.. Presidential power, legislative
organization, and party behavior in brazil. Comparative Politics, p.
151–170, 2000.
[24] RAILE, E. D.; PEREIRA, C. ; POWER, T. J.. The executive toolbox:
Building legislative support in a multiparty presidential regime.
Political Research Quarterly, 64(2):323–334, 2011.
[25] SACERDOTE, B.. Peer effects with random assignment: Results for
dartmouth roommates. The Quarterly journal of economics, 116(2):681–
704, 2001.
[26] CALVÓ-ARMENGOL, A.; PATACCHINI, E. ; ZENOU, Y.. Peer effects
and social networks in education. The Review of Economic Studies,
76(4):1239–1267, 2009.Bibliography 34
[27] BATTAGLINI, M.; PATACCHINI, E.. Influencing connected legislators.
Technical report, National Bureau of Economic Research, 2016.
[28] MASKET, S.. Where you sit is where you stand: The impact of
seating proximity on legislative cue-taking. 2008.
[29] COHEN, L.; MALLOY, C. J.. Friends in high places. American Economic
Journal: Economic Policy, 6(3):63–91, 2014.
[30] AMES, B.. The deadlock of democracy in Brazil. University of
Michigan Press, 2002.
[31] NICOLAU, J.. Representantes de quem?: Os (des) caminhos do
seu voto da urna à Câmara dos Deputados. Zahar, 2017.
[32] MELO, M.; PEREIRA, C.. Making Brazil work: checking the presi-
dent in a multiparty system. Springer, 2013.
[33] CAMERON, A. C.; MILLER, D. L.. Robust inference for dyadic data.
Unpublished manuscript, University of California-Davis, 2014.
PUC-Rio - Certificação Digital Nº 1612158/CA
[34] CAMERON, A. C.; GELBACH, J. B. ; MILLER, D. L.. Robust inference
with multiway clustering. Journal of Business & Economic Statistics,
29(2):238–249, 2011.
[35] BURSZTYN, L.; EGOROV, G. ; FIORIN, S.. From extreme to main-
stream: How social norms unravel. Technical report, National Bureau
of Economic Research, 2017.
[36] HONG, S.; KIM, S. H.. Political polarization on twitter: Implications
for the use of social media in digital governments. Government
Information Quarterly, 33(4):777–782, 2016.
[37] BOXELL, L.; GENTZKOW, M. ; SHAPIRO, J. M.. Is the internet causing
political polarization? evidence from demographics. Technical
report, National Bureau of Economic Research, 2017.
[38] IYENGAR, S.; WESTWOOD, S. J.. Fear and loathing across party
lines: New evidence on group polarization. American Journal of
Political Science, 59(3):690–707, 2015.
[39] GENTZKOW, M.. Polarization in 2016. Toulouse Network of Information
Technology white paper, 2016.
[40] ABRAMOWITZ, A. I.; SAUNDERS, K. L.. Is polarization a myth? The
Journal of Politics, 70(2):542–555, 2008.Bibliography 35
[41] LAYMAN, G. C.; CARSEY, T. M. ; HOROWITZ, J. M.. Party polar-
ization in american politics: Characteristics, causes, and conse-
quences. Annual Review of Political Science, 9:83–110, 2006.
[42] FIGUEIREDO, A.; LIMONGI, F.. Partidos políticos na câmara dos
deputados: 1989-1994. Dados, 38(3):497–524, 1995.
[43] ABRANCHES, S.. Presidencialismo de coalizão: o dilema institu-
cional brasileiro. Dados, 31(1):5–38, 1988.
[44] LIMONGI, F.. A democracia no brasil: presidencialismo, coalizão
partidária e processo decisório. Novos estudos-CEBRAP, (76):17–41,
2006.
[45] ABRANCHES, S.. Os ciclos do presidencialismo de coalizão.
Ecopolítica Ensaios, 2014.
PUC-Rio - Certificação Digital Nº 1612158/CAA
Figures
PUC-Rio - Certificação Digital Nº 1612158/CA
Figure A.1: Aerial photo of the Chamber’s Main ComplexYou can also read


