FIFTY SHADES OF MIMO QUANTIFYING THE IMPACT OF MIMO IN COMMERCIAL LTE NETWORKS - SPECIAL PREVIEW EDITION
←
→
Page content transcription
If your browser does not render page correctly, please read the page content below

Redefining Research       August 12, 2013, Vol. 9 No. 6 PREVIEW

FIFTY SHADES oF MIMO
  Quantifying the Impact of MIMO in
     Commercial LTE Networks
 part of “The Mother of All Network Benchmark Tests”
                  series of reports
                SPECIAL PREVIEW EDITION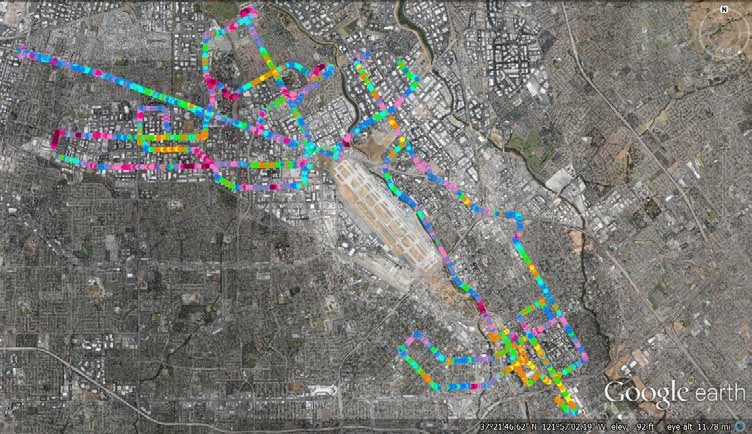
YOUR
ATTENTION
PLEASE
This document contains a preview of a separately published 76 page report that analyzes the incremental benefits of MIMO,
specifically Transmission Mode 3 (TM 3), in commercial LTE networks. The results are based on testing in LTE networks from
two different operators (Knoxville, TN and Santa Clara, CA) with TM 3 enabled and with the network specially configured
to only support Transmission Mode 2. In addition to adhering to a fairly rigorous test methodology, the analysis of the data
included mapping the results to a common set of KPIs – primarily device-reported SINR and RSRP, to ensure an apples-
to-apples comparison. This report is included as part of a corporate subscription to Signals Ahead or it can be purchased
separately for $1,795.

In addition to a sanitized Executive Summary, we include the complete Table of Contents, List of Figures (63), List of
Tables (11), our Test Methodology, a list of past reports and a preview of reports that are currently being planned for the
upcoming year.

Executive Summary
The various MIMO (Multiple Input, Multiple Output) antenna schemes
are key technology enablers and they play a critical part of the LTE stan-
dard. In theory, 2 x 2 MIMO can double the end user throughput, but in
practice the actual gains can be far more modest. Given the large number
of dependencies, the most valid and interesting approach is to convince
an operator [in our case two operators] to turn off MIMO and then see
what happens. Easier said than done!
                                There are nine different transmission modes in Release 10, which is impressive but nowhere near the
                                 fifty transmission modes that we alluded to in the title of this report. Our version of the fictional
                                 story may not be as titillating as the original, but we’re confident that we will still get the juices
                                 flowing with our readers as they turn the pages.
           For this study, we       For purposes of this study we focused exclusively on Transmission Mode 3 (TM 3 – Open Loop
         focused exclusively     MIMO) and Transmission Mode 2 (TM 2 – Transmit Diversity) and the relative gains associated
          on TM 3 and TM 2.      with a network configured to support TM 3 versus a network configured to only support TM 2.
                                We collected data during two consecutive nights in each market that we tested with TM 3 enabled
                                 during the first night and TM 3 turned off during the second night. We also tested in two different
                                 frequency bands. In downtown Knoxville, Tennessee we had access to a network that supported 2 x 5
                                 MHz of LTE in 850 MHz (Band 5). In T-Mobile’s network in Santa Clara, California, we had access
                                 to 2 x 10 MHz of LTE in 1700/2100 MHz (Band 4). In total, we transferred nearly 140 GB of data.
 We once again collaborated         We once again collaborated with Accuver, who supplied us with its XCAL drive test solution and
 with Accuver, who supplied      its XCAP post-processing software. We have used their solutions since we conducted our first drive
       us with its XCAL drive    test of LTE way back in February 2010. Since that time we have taken advantage of their tool’s capa-
  test solution and its XCAP
                                 bilities to test an acronym soup of radio access technologies, not to mention interesting sidebar studies,
  post-processing software.
                                 including in-building performance and user experience testing. We look forward to collaborating
                                 with them in the future to provide the industry what we hope continues to be useful information.
                                 SRG takes full responsibility for the analysis and commentary presented in this report.
          With TM 3 enabled,        With TM 3 enabled, we measured some of the highest average throughput that we’ve recorded
        we measured some of      in a commercial / pre-commercial LTE network. In Knoxville, the average throughput during the
          the highest average    daytime over a geographical region that extended well beyond the test cluster was 12.81 Mbps –
       throughput that we’ve
                                 21.6% of the time the throughput was higher than 20 Mbps. In T-Mobile’s Santa Clara / San Jose
  recorded in a commercial /
pre-commercial LTE network.      network, the average throughput of its 2 x 10 MHz network during daytime testing was 24.71 Mbps
                                – during the nighttime drive testing the average throughput over a 9.7 mile drive test was closer to 30
                                 Mbps. The daytime throughput also exceeded 40 Mbps for 18.5% of the time.

3 	                                                                 August 12, 2013 | Signals Ahead, Vol. 9, Number 6 PREVIEW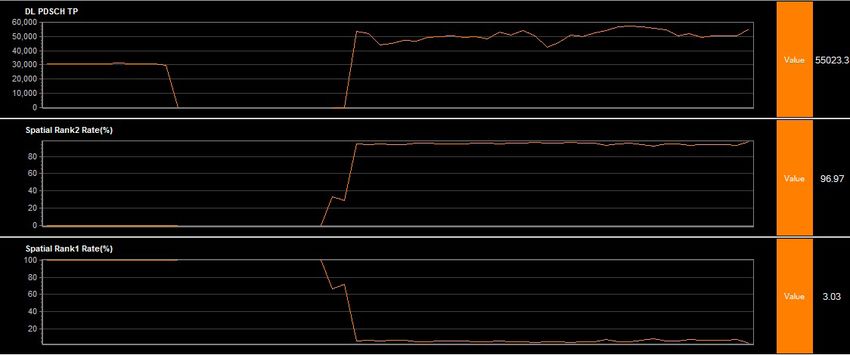
The following figure provides the distribution of Physical Layer throughput in T-Mobile’s LTE
                                         network in Santa Clara and San Jose.

Figure 1. Probability Distribution of Daytime Physical Layer Throughput – Santa Clara Band 4 Network
PDSCH Throughput (Median) = 21.71 Mbps         PDSCH Throughput (Average) = 24.71 Mbps
Total Data Transfer = 108.7 GB
                                                                                                                                    x < 2.5 Mbps 0.3%
Probability (%)
                                                                                                                60 Mbps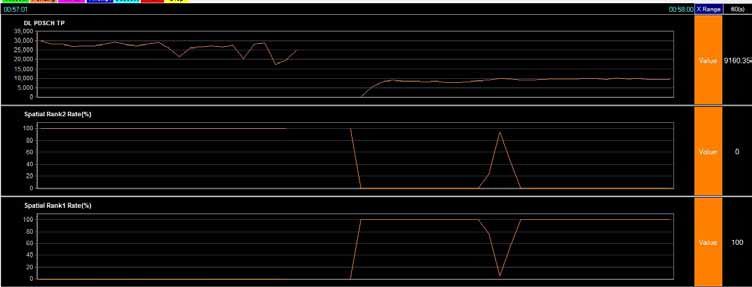
The second figure provides a geo plot of the Physical Layer throughput. This figure is followed by a
                                      third figure that shows probability distribution plots for the throughput in the T-Mobile network and
                                      in the AT&T network. We point out that these results were obtained over a large subset of the drive
                                      routes that appear in Figure 2, but the results are not all-inclusive. We observed that the loading was
                                      higher in the AT&T network based on the number of assigned resource blocks. The adjusted average
                                      throughput values (AT&T = 19.83 Mbps; T-Mobile = 26.46 Mbps) were calculated by normalizing
                                      the measured throughput to the maximum number of potential resource blocks that are available in
                                      a 10 MHz LTE channel. It is evident that the T-Mobile throughput was still considerably higher
                                      than the AT&T throughput (the two lines in the figure show the measured throughput and not the
                                      adjusted throughput).

Figure 3. Probability Distribution of Daytime Physical Layer Throughput – Santa Clara Band 4 Network

AT&T PDSCH Throughput (Average) = 13.17 Mbps       T-Mobile PDSCH Throughput (Average) = 24.5 Mbps
AT&T PDSCH Throughput (Adj Avg) = 19.83 Mbps       T-Mobile PDSCH Throughput (Adj Avg) = 26.46 Mbps

Probability (%)
100%

80%

60%

                                                                                                   T-Mobile
40%

20%                                                                     AT&T

0%
       0           2.5           5              10             15              20             30              40   50       60             MAX
                                                                    PDCSH Throughput (Mbps)
                                                                                                                        Source: Signals Research Group

                                        In addition to analyzing the impact of MIMO when trying to maximize downlink throughput over
                                      an extended period of time, we also evaluated the impact of MIMO with more typical usage patterns,
                                      such as web page browsing and viewing a YouTube video. The analysis included the impact on web
                                      page load times and the Transport Block Size (TBS) allocations on a per sub-frame basis.
                                        As shown in the Test Methodology section, which is included in this report preview, MIMO can
                                      double the throughput relative to a network that only supports transmit diversity. However, its actual
                                      benefit in more realistic conditions is a bit more convoluted and far more interesting!
                                        Analysis and figures/tables included in this report include the following:

                                      ➤➤ Physical     Layer throughput versus reported SINR Scatterplots (TM3 enabled and TM 2 only)

                                      ➤➤ Physical     Layer throughput versus reported RSRP Scatterplots (TM3 enabled and TM 2 only)

                                      ➤➤ Best      Fit plots of Physical Layer throughput versus SINR and RSRP (TM3 enabled and TM 2
                                           only)

                                      ➤➤   SINR probability distribution plots

5 	                                                                             August 12, 2013 | Signals Ahead, Vol. 9, Number 6 PREVIEW
➤➤ Rank    Indicator requests / assignments as a function of reported SINR (TM3 enabled)

      ➤➤ Physical   Layer throughput probability distribution plots

      ➤➤ Relative   performance impact of MIMO as a function of SINR

      ➤➤ Edge-of-cell   Physical Layer throughput versus reported SINR Scatterplots

      ➤➤ BestFit plots of Edge-of-Cell Physical Layer throughput versus SINR (TM3 enabled and TM2
        only)

      ➤➤ Physical Layer Throughput versus reported SINR Scatterplots for two devices running in parallel
        (TM3 enabled and TM 2 only)

      ➤➤ Probabilitydistribution plots of combined Physical Layer throughput for two devices running in
         parallel (TM3 enabled and TM 2 only)

      ➤➤ Web    page load times (TM3 enabled and TM 2 only)

      ➤➤ Geo    plots of Physical Layer throughput and Transmission Mode usage

      ➤➤ Transport   Block Size Analysis on a per sub-frame basis (TM3 enabled and TM 2 only)

      ➤➤ Physical   Layer throughput versus time at high vehicular speed (TM3 enabled and TM 2 only)

6 	                                      August 12, 2013 | Signals Ahead, Vol. 9, Number 6 PREVIEW
The European Microwave Industry’s
Largest Knowledge Exchange
PACKET MICROWAVE
& MOBILE BACKHAUL
23-25 September 2013 Düsseldorf, Germany
Optimising solution economics & performance for Mobile Backhaul
Expanding the Role of Microwave in LTE and Small Cells
Meet Learn Exchange
NETWORK EVOLUTION LTE BACKHAUL SMALL CELL NEW SPECTRUM
De-risk purchasing decisions Achieve rapid LTE deployment Spot opportunities in new Small Evaluate new technologies, tools
by understanding key and control costs & QoS Cell & HetNet backhaul & architectures
technology roadmaps
You r Congress check list
AUDIENCE NETWORKING EXCHANGE ONLINE
200+ Participants Online community Keynotes Webinars
Technology leaders On-site ice breaking Analyst Led Panel Debates Layer123 App
Network & Service strategy Booths and demos Workshops CHANNEL123 News
Procurement Strategy Networking Reception Topical Debates Over Lunch Live Webcasts
20+ Countries Represented Private meeting area White Paperss
Tier 1 Mobile Operators
Industry Analysts
Sponsor – Platinum Event Partners Sponsors – Gold
Sponsors – Silver Analyst Partners Supporting Organisations
T: +44 (0)20 8465 5440
E: registration@layer123.com
www.layer123.com/microwave
7 August 12, 2013 | Signals Ahead, Vol. 9, Number 6 PREVIEWContents
1.0 Executive Summary………………………………………………………………………………………………………………………………………… 3
2.0 Key Conclusions and Observations…………………………………………………………………………………………………………………10
3.0 Detailed Results – low-speed mobility…………………………………………………………………………………………………………… 17
3.1 Overall Daytime PDSCH and SINR Results………………………………………………………………………………………………… 17
3.2 Sample Nighttime Drive Test Results – Physical Layer Throughput versus SINR……………………………………… 21
3.2.1 Sample Nighttime Drive Test Results – Knoxville Band 5 Network……………………………………………………… 21
3.2.2 Sample Nighttime Drive Test Results – Santa Clara Band 4 Network……………………………………………… 25
3.3 Sample Nighttime Drive Test Results – Physical Layer versus RSRP……………………………………………………… 28
3.4 Mapping MIMO Performance Impacts as a Function of SINR ………………………………………………………………… 30
3.5 Sample Nighttime Drive Test Results – PDSCH versus SINR during Cell Handovers……………………………………37
4.0 Detailed Results – stationary positions……………………………………………………………………………………………………… 40
5.0 Detailed Results – high-speed vehicular……………………………………………………………………………………………………… 47
6.0 User Experience Tests (Web browsing and YouTube)……………………………………………………………………………………… 51
7.0 Test Methodology……………………………………………………………………………………………………………………………………… 58
8.0 Final Thoughts……………………………………………………………………………………………………………………………………………… 61
9.0 Appendix……………………………………………………………………………………………………………………………………………………… 62
Index of Figures
Figure 1. The Impact of MIMO in a Commercial LTE Network – Band 4 and Band 5……………………………………………………… 13
Figure 2. Probability Distribution of Daytime Physical Layer Throughput – Knoxville Band 5 Network…………………………… 17
Figure 3. Probability Distribution of Daytime Physical Layer Throughput – Santa Clara Band 4 Network………………………… 18
Figure 4. Daytime Physical Layer Throughput – Knoxville Band 5 Network (geo plot)…………………………………………………… 18
Figure 5. Distribution of Daytime Physical Layer Throughput – Santa Clara Band 4 Network (geo plot)………………………… 19
Figure 6. Probability Distribution of Daytime Reported SINR Values– Knoxville Band 5 Network……………………………… 20
Figure 7. Probability Distribution of Daytime Reported SINR Values – Santa Clara Band 4 Network…………………………… 20
Figure 8. Physical Layer Throughput with TM 3 Enabled, June 18th, 0148 hours – Knoxville Band 5 Network (geo plot)…… 21
Figure 9. Transmission Mode Assignments with TM3 Enabled, June 18th, 0148 hours –
Knoxville Band 5 Network (geo plot)……………………………………………………………………………………………………………………… 22
Figure 10. Physical Layer Throughput Versus SINR Scatterplot Plus Assorted KPIs with TM 3 Enabled,
June 18th 0148 hours – Knoxville Band 5 Network…………………………………………………………………………………………………… 22
Figure 11. Physical Layer Throughput with TM 2 Only, July 19th, 0117 hours –
Knoxville Band 5 Network (geo plot)…………………………………………………………………………………………………………………………23
Figure 12. Transmission Mode Assignments with TM2 Only, June 19th, 0117 hours –
Knoxville Band 5 Network (geo plot)……………………………………………………………………………………………………………………… 24
Figure 13. Physical Layer Throughput Versus SINR Scatterplot Plus Assorted KPIs with TM 2 Only, June 19th 0117 hours –
Knoxville Band 5 Network……………………………………………………………………………………………………………………………………… 24
Figure 14. Physical Layer Throughput with TM 3 Enabled, July 18th, 0232 hours –
8 August 12, 2013 | Signals Ahead, Vol. 9, Number 6 PREVIEWSanta Clara Band 4 Network (geo plot)…………………………………………………………………………………………………………………… 25 Figure 15. Transmission Mode Assignments with TM3 Enabled, July 18th, 0232 hours – Santa Clara Band 4 Network (geo plot)…………………………………………………………………………………………………………………… 26 Figure 16. Physical Layer Throughput Versus SINR Scatterplot Plus Assorted KPIs with TM 3 Enabled, July 18th 0232 hours – Santa Clara Band 4 Network………………………………………………………………………………………………… 26 Figure 17. Physical Layer Throughput with TM 2 Only, July 19th, 0105 hours – Santa Clara Band 4 Network (geo plot)…………………………………………………………………………………………………………………… 27 Figure 18. Physical Layer Throughput Versus SINR Scatterplot Plus Assorted KPIs with TM 2 Only, July 19th 0105 hours – Santa Clara Band 4 Network………………………………………………………………………………………………… 27 Figure 19. Physical Layer Throughput Versus RSRP Scatterplot with TM 3 Enabled, July 18th 0127 hours – Santa Clara Band 4 Network…………………………………………………………………………………………………………………………………… 28 Figure 20. Physical Layer Throughput Versus RSRP for all Drive Tests – Santa Clara Band 4 Network…………………………… 29 Figure 21. Consolidated Physical Layer Throughput Versus RSRP for TM 3 Enabled Versus TM 2 Only – Santa Clara Band 4 Network…………………………………………………………………………………………………………………………………… 29 Figure 22. Physical Layer Throughput Versus SINR for all Drive Tests – Knoxville Band 5 Network……………………………… 30 Figure 23. Consolidated Physical Layer Throughput Versus SINR for TM 3 Enabled Versus TM 2 Only – Knoxville Band 5 Network……………………………………………………………………………………………………………………………………… 30 Figure 24. Physical Layer Throughput Versus SINR for all Drive Tests – Santa Clara Band 4 Network……………………………… 31 Figure 25. Consolidated Physical Layer Throughput Versus SINR for TM 3 Enabled Versus TM 2 Only – Santa Clara Band 4 Network……………………………………………………………………………………………………………………………………… 31 Figure 26. Physical Layer Throughput Gains with TM 3 Enabled Versus TM 2 Only as a Function of SINR – Knoxville Band 5 Network…………………………………………………………………………………………………………………………………………32 Figure 27. Physical Layer Throughput Gains with TM 3 Enabled Versus TM 2 Only as a Function of SINR – Santa Clara Band 4 Network……………………………………………………………………………………………………………………………………… 33 Figure 28. The Impact of MIMO in a Commercial LTE Network – Band 4 and Band 5………………………………………………… 34 Figure 29. Physical Layer Throughput Versus SINR Scatterplot at Edge of Cell with TM 3 Enabled, July 18th 0127 hours – Santa Clara Band 4 Network……………………………………………………………………………………………………37 Figure 30. Physical Layer Throughput Gains with TM 3 Enabled Versus TM 2 Only at Edge of Cell as a Function of SINR – Knoxville Band 5 Network………………………………………………………………………………… 38 Figure 31. Physical Layer Throughput Gains with TM 3 Enabled Versus TM 2 Only at Edge of Cell as a Function of SINR – Santa Clara Band 4 Network…………………………………………………………………………… 39 Figure 32. Locations of Stationary Points - Knoxville………………………………………………………………………………………………… 40 Figure 33. Locations of Stationary Points - Santa Clara……………………………………………………………………………………………… 40 Figure 34. Transport Block Size Assignments with TM 3 Enabled, Point 7 – Knoxville, Band 5 Network…………………………… 41 Figure 35. Transport Block Size Assignments with TM 2 Only, Point 7 – Knoxville, Band 5 Network……………………………… 42 Figure 36. Transport Block Size Assignments with TM 3 Enabled, Point 3 – Knoxville, Band 5 Network………………………… 43 Figure 37. Transport Block Size Assignments with TM 2 Only, Point 2 – Knoxville, Band 5 Network……………………………… 44 Figure 38. Transport Block Size Assignments with TM 3 Enabled, Point 2 – Santa Clara, Band 4 Network……………………… 45 Figure 39. Transport Block Size Assignments with TM 2 Only, Point 2 – Santa Clara, Band 4 Network………………………… 46 Figure 40. Transmission Mode Assignments with TM 3 Enabled, July 18th, 0529 hours – Santa Clara Band 4 Network (geo plot)…………………………………………………………………………………………………………………… 47 Figure 41. Transmission Mode Assignments with TM 2 Only, July 19th, 0410 hours – Santa Clara Band 4 Network (geo plot)…………………………………………………………………………………………………………………… 47 9 August 12, 2013 | Signals Ahead, Vol. 9, Number 6 PREVIEW
Figure 42. Physical Layer Throughput Versus SINR Scatterplot Plus Assorted KPIs with TM 3 Enabled,
July 18th 0529 hours – Santa Clara Band 4 Network………………………………………………………………………………………………… 48
Figure 43. Physical Layer Throughput Versus SINR Scatterplot Plus Assorted KPIs with TM 2 Only,
July 19th 0410 hours – Santa Clara Band 4 Network………………………………………………………………………………………………… 49
Figure 44. Physical Layer Throughput Versus Serving PCI with TM 3 Enabled, July 18th 0529 hours –
Santa Clara Band 4 Network…………………………………………………………………………………………………………………………………… 50
Figure 45. Physical Layer Throughput Versus Serving PCI with TM 2 Only, July 19th 0410 hours –
Santa Clara Band 4 Network…………………………………………………………………………………………………………………………………… 50
Figure 46. Web Page Load Times with and without TM 3 Enabled – Knoxville Band 5 Network……………………………………… 51
Figure 47. Web Page Load Times with and without TM 3 Enabled – Santa Clara Band 4 Network……………………………………52
Figure 48. Transport Block Size Assignments with TM 3 Enabled with FTP and Web Browsing, Point 7 –
Knoxville, Band 5 Network………………………………………………………………………………………………………………………………………… 53
Figure 49. Transport Block Size Assignments with TM 3 Enabled with Web Browsing, Point 3 –
Santa Clara, Band 4 Network…………………………………………………………………………………………………………………………………… 54
Figure 50. Transport Block Size Assignments with TM 2 Only with Web Browsing, Point 3 –
Santa Clara, Band 4 Network………………………………………………………………………………………………………………………………………55
Figure 51. Physical Layer Throughput with YouTube, Hotel – Knoxville, Band 5 Network…………………………………………… 56
Figure 52. Transport Block Size Assignments with TM 3 Enabled with YouTube, Hotel – Knoxville, Band 5 Network……… 57
Figure 53. XCAL in Action……………………………………………………………………………………………………………………………………… 58
Figure 54. XCAL in Action……………………………………………………………………………………………………………………………………… 58
Figure 55. Physical Layer Throughput Versus SINR Scatterplot for Two Devices with TM 3 Enabled,
June 18th 0427 hours – Knoxville Band 5 Network…………………………………………………………………………………………………… 67
Figure 56. Physical Layer Throughput Versus SINR Scatterplot for Two Devices with TM 2 Only,
June 19th 0300 hours – Knoxville Band 5 Network…………………………………………………………………………………………………… 68
Figure 57. Probability Distribution of Physical Layer Throughput for Two Devices with TM 3 Enabled
and with TM 2 Only – Knoxville Band 5 Network……………………………………………………………………………………………………… 69
Figure 58. Physical Layer Throughput Versus SINR Scatterplot Plus Assorted KPIs with TM 3 Enabled,
 June 18th 0128 hours – Knoxville Band 5 Network…………………………………………………………………………………………………… 70
Figure 59. Physical Layer Throughput Versus SINR Scatterplot Plus Assorted KPIs with TM 2 Only,
June 19th 0136 hours – Knoxville Band 5 Network……………………………………………………………………………………………………… 71
Figure 60. Physical Layer Throughput Versus SINR Scatterplot Plus Assorted KPIs with TM 3 Enabled,
July 18th 0340 hours – Santa Clara Band 4 Network………………………………………………………………………………………………… 72
Figure 61. Physical Layer Throughput Versus SINR Scatterplot Plus Assorted KPIs with TM 2 Only,
July 19th 0320 hours – Santa Clara Band 4 Network………………………………………………………………………………………………… 73
Figure 62. Transport Block Size Assignments with TM 3 Enabled, Point 3 – Santa Clara, Band 4 Network……………………… 74
Figure 63. Transport Block Size Assignments with TM 2 Only, Point 3 – Santa Clara, Band 4 Network………………………… 75

10 	                                                      August 12, 2013 | Signals Ahead, Vol. 9, Number 6 PREVIEW
Index of Tables
Table 1. Physical Layer Throughput Gains with TM 3 Enabled Versus TM 2 Only as a Function of SINR –
Knoxville Band 5 Network…………………………………………………………………………………………………………………………………………32
Table 2. Physical Layer Throughput Gains with TM 3 Enabled Versus TM 2 Only as a Function of SINR –
Santa Clara Band 4 Network……………………………………………………………………………………………………………………………………… 33
Table 3. Rank 2 Indicator Usage as a Function of SINR – Knoxville Band 5 Network………………………………………………………35
Table 4. Rank 2 Indicator Usage as a Function of SINR – Santa Clara Band 4 Network………………………………………………… 36
Table 5. Physical Layer Throughput Gains with TM 3 Enabled Versus TM 2 Only at Edge of Cell as a
Function of SINR – Knoxville Band 5 Network………………………………………………………………………………………………………… 38
Table 6. Physical Layer Throughput Gains with TM 3 Enabled Versus TM 2 Only at Edge of Cell as a
Function of SINR – Santa Clara Band 4 Network……………………………………………………………………………………………………… 39
Table 7. Comparable Web Page Load Times - Santa Clara Band 4 Network……………………………………………………………………52
Table 8. Detailed Results, Part I - Knoxville……………………………………………………………………………………………………………… 63
Table 9. Detailed Results, Part II - Knoxville……………………………………………………………………………………………………………… 64
Table 10. Detailed Results, Part I – Santa Clara………………………………………………………………………………………………………… 65
Table 11. Detailed Results, Part II – Santa Clara………………………………………………………………………………………………………… 66

11 	                                                August 12, 2013 | Signals Ahead, Vol. 9, Number 6 PREVIEW
LIMITED FREE CARRIER PASSES AVAILABLE!
                                         DON’T MISS OUT… CLAIM YOURS TODAY!
                                                                            Co-located with:             Strategic         Officially Endorsed by:
       6th Annual                                                                                        Partner:

       21st-22nd November 2013                                                   SIGNALING
       Westin Galleria, Dallas, Texas, USA                                       FOCUS DAY

                                                                                                               Previous Event Host Carriers:

                                                                            The ONLY 4G event
                                                                              in North America!

           1250+                             150+                              75+                                   40+
               High-level                    Distinguished                  Exhibitors and                    Analysts, Press &
               attendees                       Speakers                     meeting rooms                   Influential Bloggers!

       VISIONARY SPEAKERS ALREADY CONFIRMED FOR 2013:
              BILL STONE                      JOHN SAW                        SOLYMAN ASHRAFI                        CAMERON DUNN
              Executive Director,             CTO                             Vice President, Product                Director International,
              Network Strategy                Clearwire                       Management                             Alliances & Integrations,
              Verizon Wireless                                                Metro PCS                              AT&T Mobility
                                              DEAN HARDY
              NAROTHUM SAXENA                 CTO, NetSet                     GREGORY CASEY                          BEJOY PANKAJAKSHAN
              Senior Director Advanced        Communications                  CEO                                    Principal Member Technical
              Technology & Strategy                                           Texas Energy Network                   Staff, Metro PCS
                                              EMIL OLBRICH
              US Cellular
                                              Public Safety                   FEZA BUYUKDURA                         ERIK NEITZEL
              MASAAKI MAEDA                   Demonstration Network           Lead Principle Technical               DMTS, Technology
              President                       Project Lead Engineer, NIST     Architect, AT&T                        Development Group
              NTT DoCoMo USA                                                                                         US Cellular
                                              BERNARD ST-LAURENT              GLENN WELLBROCK
              RICK VERGIN                     Project Manager, 700MHz         Director of Backbone                   BONNIE CHEN
              CEO                             Broadband Spectrum,             Network Design                         Research Scientist
              Mosaic Telecom                  Public Safety Canada            Verizon                                Sprint

       LTE WORLD SERIES SUPPORTED BY

       2013 SPONSORS ALREADY CONFIRMED:

                                                                                           ®
                                                                                                                                 WebRadar

12 	   Register today! Visit www.lteconference.com/northamerica
                                             August 12, 2013 | Signals Ahead, Vol. 9, Number 6 PREVIEW
Test Methodology
We used the Accuver For the MIMO testing we once again used the Accuver XCAL drive test tool to collect the data and
suite of drive test the Accuver XCAP post-processing tool to analyze the data and to help us create the figures that
solutions for this study. appear in this report.
Figure 53 and Figure 54 illustrate a typical display that we used when collecting the data. Both
figures are especially interesting since they capture the moment in time when the operator turned on
TM 3 (Figure 53) and the moment in time when the operator turned off TM 3 (Figure 54) – note
the allocation of Rank Indicator values in both figures. Both figures stem from testing that we did
in our hotel – the first figure is from Santa Clara and the second figure is from Knoxville.
Figure 53. XCAL in Action
Source: Accuver and SRG
Figure 54. XCAL in Action
Source: Accuver and SRG
13 August 12, 2013 | Signals Ahead, Vol. 9, Number 6 PREVIEWThe entire effort was The two operators who supported this effort provided us with smartphones to collect the data,
self-funded with our SIM cards without any data restrictions, and [most importantly] they were willing to reconfigure
subscription-based model their networks for our benefit and the benefit of our subscribers. As a courtesy, we provided both
being the only way we are
operators with a pre-brief of the results. This pre-brief also gave us the opportunity to ask some ques-
compensated for our effort.
tions. As it is the case with all of our Signals Ahead reports, other than the aforementioned logistical
support, the entire effort was self-funded with our subscription-based model being the only way we
are compensated for our effort.
We also could not have done this report without the support of Accuver who provided us with its
suite of drive test tools and post-processing software. SRG takes full responsibility for the analysis
and conclusions that are documented in this report.
Virtually all testing took place during the nighttime hours for hopefully obvious reasons. In
Knoxville, we tethered the smartphone to our Windows 7 notebook computer and then used FTP
(FileZilla) to generate the data traffic. We used multiple FTP sessions to ensure that the data pipe
was fully loaded and that TCP ACK/NACK round trip times did not impact the throughput.
In Santa Clara, we used the Datum client and an external Spirent/Metrico server (UDP) to
generate the data traffic for the T-Mobile network. This approach was done out of necessity since we
were not able to get the Samsung Galaxy S 3 to support tethering mode and provide access to the
diagnostic port at the same time.
The frequency of how often the chipset reported the different KPIs that we used in this report was
not consistent. Some KPIs were reported on the order of tens of milliseconds in the log file while
other KPIs were reported only once per second. This approach is done to ensure that the processing,
reporting and collecting of information, combined with the limitations of the notebook computer do
not unintentionally degrade the performance of the modem.
As we understand it, in all instances the reported value is a median or an average value calculated
for all sub-frames over the pertinent time duration versus being simply a sample value. For this reason,
we believe that all values are accurate but there is a natural loss of granularity. We demonstrated this
relationship when we did the YouTube analysis. While the average Physical Layer throughput never
exceeded much higher than 8 Mbps, there were individual sub-frames/TTIs when the maximum
TBS value/throughput was achieved.
By reparsing the data With XCAP, it was possible to reparse the data and extract many of the more valuable KPIs on a
it was possible to extract per sub-frame basis and we did this for the stationary testing log files. For example, we analyzed the
many of the KPIs on a actual allocation of transmission modes (once per sub-frame) and compared this information with
per sub-frame basis.
the requested allocation of transmission modes (once per second) that we generally used. By taking
this approach, we determined that the network scheduler assigned the mobile device the transmis-
sion mode that it requested – or at least the percentages were nearly identical. One can imagine the
amount of processing time required for a lengthy test and the number of rows of data (1,000 rows for
each second of the test) so we elected to limit the number of files that we reviewed in this manner.
The following information identifies how frequently the KPIs were reported in the log files.
➤➤ Vehicular Speed – once per second/data collected and averaged over the entire interval
➤➤ Serving PCI – ~once every 40 ms/data collected and averaged over the entire interval
➤➤ SINR – ~once every 40 ms/data collected and averaged over the entire interval
➤➤ RSRP – ~once every 40 ms/data collected and averaged over the entire interval
➤➤ Rank Indicator 1/Rank Indicator 2 – once per second/data collected and averaged over the entire
interval
➤➤ CQI – ~once every 10 ms/data collected and averaged over the entire interval
14 August 12, 2013 | Signals Ahead, Vol. 9, Number 6 PREVIEW➤➤ Number of Assigned Resource Blocks – once per second/data collected and averaged over the
entire interval
➤➤ MCS Code Word 0/Code Word 1/data collected and averaged over the entire interval
➤➤ Modulation Rate (QPSK, 16 QAM, 64 QAM) – ~once every 50 ms/data collected and averaged
over the entire interval
➤➤ BLER – once per second/data collected and averaged over the entire interval
➤➤ PDSCH Throughput – once per second/data collected and averaged over the entire interval
We note that the average resource block allocation KPI that we presented in this report calculated
the average across all sub-frames, even if they weren’t assigned to the mobile device. For example, if
the mobile device was assigned 40 resource blocks in the first 500 sub-frames and 0 resource blocks
in the second 500 sub-frames, the RB value that we would use would have been 250.
For the scatterplots, we linked the two applicable KPIs together and then did the necessary aver-
aging. For example, for the Physical Layer throughput versus SINR plots, we averaged all reported
SINR values plus or minus one second from the reported throughput value in order to obtain the
corresponding SINR value – we used this methodology for each throughput value in the log file. For
the cell handover analysis, we used the first reported throughput value following a change in the
Serving PCI, the next reported throughput value, and the two previous throughput values before the
change in the Serving PCI to calculate the edge-of-cell throughput.
15 August 12, 2013 | Signals Ahead, Vol. 9, Number 6 PREVIEWPending Topics
Here is a list of topics that we are currently considering or actively pursuing.
➤➤ Over-the-air testing of leading smartphone platforms in an anechoic chamber
➤➤ LTE TDD network benchmark study
➤➤ LTE-Advanced Carrier Aggregation network benchmark study
➤➤ VoLTE versus OTT benchmark study (including chipset benchmark study to analyze vendor
VoLTE client implementations)
➤➤ MIMO utilization and network loading/scheduling drive test
➤➤ VoLTE drive test network evaluation
➤➤ Software Defined Networking (SDN)
➤➤ A-GNSS platform benchmark study (Round II)
➤➤ Baseband chipset + application processor benchmark study
➤➤ Smartphone signaling implications across operating systems
➤➤ How network performance (throughput and latency) impacts the user experience
➤➤ Smartphone signaling implications and LTE
➤➤ LTE Chipset performance benchmark study, including carrier aggregation
➤➤ HSPA+ (MIMO) network performance benchmark results
➤➤ The challenges of delivering video in a mobile network
➤➤ Cloud RAN and the use of a Distributed Network Architecture
16 August 12, 2013 | Signals Ahead, Vol. 9, Number 6 PREVIEWIn Case You Missed It: Signals Ahead Back Issues
➤ 5/28/13 “What’s the PSC, Kenneth? (Quantifying the scale to support future traffic demands. Finally, we compare and
need and benefits of interference cancellation solu- contrast the performance of the VZW and AT&T LTE networks.
tions in a 3G network)” We provide insight into the amount
of interference that exists in a 3G network, its potential impact on ➤ 12/5/12 “LTE Band 7 versus LTE Band 4 – GAME ON!” With
data rates and network efficiency, and how an advanced equalizer the support of Accuver, we used its XCAL-M and XCAP drive
can be used to maximize performance when these challenging test solutions to conduct a network benchmark study of LTE
conditions exist. For purposes of this report, we used AT&T’s Band 7 and LTE Band 4. This benchmark study leveraged the
HSPA+ network in San Francisco and the surrounding vicinity. Rogers Wireless network in Vancouver, Canada where they have
This report was done in collaboration with Accuver who provided deployed both frequency bands in virtually every single cell site. In
us with its XCAL and XCAP drive test solutions. addition to looking at basic throughput, we include a host of other
device-reported KPIs to analyze the downlink and uplink perfor-
➤ 4/25/13 “Everything under the SON” We discuss the back- mance characteristics of the two frequency bands under identical
ground of SON, including discussions of work within NGMN, network conditions, including edge-of-of cell and in-building.
3GPP and the SOCRATES/SEMAFOUR projects. We also
cover the basics of SON including the laundry list of SON-like ➤ 11/6/12 “M2M – toward the Internet of things” We
features, explain how they work, and what they mean for opera- analyze the M2M landscape and some of the key players involved
tors and vendors. We then move on to discuss the present and in realizing this vision. The business models for M2M are still in
future requirements of SON, including what may be in store with flux and eventually multiple business models will have to be imple-
Release 12 and beyond. Finally, we discuss the motivations and mented. We look at the new business models being explored by
challenges of SON, including multi-vendor integration, vaguely- mobile operators and MVNOs. The global connectivity require-
defined use cases, OSS limitations, 3G SON, and centralized ments of M2M services make it natural fit for cloud services so
versus decentralized architectures. there will need to be new cloud platforms in both the operator
networks and enterprises to support M2M services. We also
➤ 3/22/13 “Rich Communication Services – reinventing analyze the requirements and vendors for such platforms. More
voice and messaging” In this issue of Signals Ahead we importantly, the radio and core networks will require enhance-
provide a detailed analysis of RCS. In addition to providing the ments to support the deluge of new M2M connections. We
history of RCS since its introduction in 2008, we examine why discuss some of the major issues and how the 3GPP standards
operators have not yet fully adopted it, the capabilities by release, body and operators are planning to address these issues.
the inherent challenges that exist, the business relationships that
exist or at least should exist, and the opportunities that could ➤ 10/15/12 “Lost and Found” As a follow-on report to “Chips
allow operators to beat the OTT providers at their own game. and Salsa XV,” we examine the real world A-GNSS performance
capabilities of leading smartphones. We also evaluate the perfor-
➤ 2/25/13 “Chips and Salsa XVI: Sweet 16 and never been mance attributes of the most popular navigation applications,
benchmarked” This report provides performance bench- including the amount of data traffic they generate, the length
mark analysis of 8 LTE baseband chipsets, including Altair, of time the smartphones remain connected to the network, and
GCT, Intel, NVIDIA, Qualcomm, Renesas Mobile, Samsung, the amount of signaling traffic that they generate. Ultimately, we
Sequans. This benchmark study marks the 8th time that we have conclude that there are fairly dramatic performance differences for
collaborated with Spirent Communications to leverage its 8100 both the A-GNSS platforms and the navigation applications that
test system and engineering support. All chipsets performed well have user experience and network implications.
under less challenging conditions but with the more challenging
conditions there was a wide variance in the results with more than ➤ 9/13/12 “Chips and Salsa XV – Disparately Seeking
a 20% difference between the top- and bottom-performing chip- Satellites” In collaboration with Spirent Communications,
sets. Three chipsets vied for top honors but ultimately we had to we provide the industry’s first independent analysis of A-GNSS
declare one the winner. platforms. The study includes conducted tests of vendor supplied
A-GPS and A-GNSS (A-GPS + GLONASS) solutions and over-
➤ 01/23/13 “The Mother of all Network Benchmark the-air testing of several leading smartphones. We demonstrate
Tests - On the Inside Looking Out: evaluating the that while the performance across the platforms is largely compa-
in-building performance capabilities of commercial rable, there are significant differences in the performance of the
LTE networks (Band 4, Band 7, Band 13, and Band 17)” solutions once they are implemented in the smartphone.
With the continued support of Accuver, we leveraged its XCAL-M
drive test solution and its enhanced support for in-building testing ➤ 8/20/12 “The B Side of LTE – when your ‘A Game’ just
to evaluate the performance of four LTE networks at Band 4, isn’t good enough” We take a look at many of the proposed
Band 7, Band 13 and Band 17. In this report we quantify the features being considered for 3GPP Release 12 and beyond,
amount of LTE network traffic that we observed in the outdoor including advancements in the use of small cells, higher order
macro network and how it compares with our in-building testing. MIMO and modulation schemes, 3D beamforming, network
We also demonstrate that 700 MHz isn’t a panacea for in-building optimization, machine type communication, and device to device
coverage, that potential coverage problems are being masked discovery and communication.
by ample capacity, and that some in-building networks may not
17 August 12, 2013 | Signals Ahead, Vol. 9, Number 6 PREVIEWSignals Ahead Subscription
The Signals Ahead newsletter is available on a subscription basis. We offer four distinct packages that have
been tailored to address the needs of our corporate users. The Group License includes up to five users from
the same company. The Global License is the most attractive package for companies that have several read-
ers since it is offered to an unlimited number of employees from the same organization. Finally, the Platinum
package includes the Global License, plus up to five hours of analyst time. Other packages are available.
Corporate Rates (12 issues)
❒ Group License ($3,995) ❒ Global License ($7,995) ❒ Platinum ($9,495)
Payment Terms
❒ American Express ❒ Visa ❒ MasterCard Credit Card # Exp Date / /
❒ Check Check Number
❒ Purchase Order PO Number
Name: Title:
Affiliation: Phone: ( )
Mailing Address:
Mailing Address
Signals Research Group – ATTN: Sales
10 Ormindale Court
Oakland, CA 94611
Our fax number is (510) 338-1284.
Alternatively, you may contact us at (510) 273-2439 or at information@signalsresearch.com and we will contact you for
your billing information. We will not process your payment until after the trial subscription period is completed.
Terms and Conditions: Any copying, redistributing, or republishing of this material, including unauthorized
sharing of user accounts, is strictly prohibited without the written consent of SRG.
please note disclaimer: The views expressed in this newsletter reflect those of Signals Research Group and are based on our understanding of past and current events shaping the wireless industry.
This report is provided for informational purposes only and on the condition that it will not form a basis for any investment decision. The information has been obtained from sources believed to be
reliable, but Signals Research Group makes no representation as to the accuracy or completeness of such information. Opinions, estimates, projections or forecasts in this report constitute the current
judgment of the author(s) as of the date of this report. Signals Research Group has no obligation to update, modify or amend this report or to otherwise notify a reader thereof in the event that any matter
stated herein, or any opinion, projection, forecast or estimate set forth herein, changes or subsequently becomes inaccurate.
If you feel our opinions, analysis or interpretations of events are inaccurate, please fell free to contact Signals Research Group. We are always seeking a more accurate understanding of the topics
that influence the wireless industry. Reference in the newsletter to a company that is publicly traded is not a recommendation to buy or sell the shares of such company. Signals Research Group and/or
its affiliates/investors may hold securities positions in the companies discussed in this report and may frequently trade in such positions. Such investment activity may be inconsistent with the analysis
provided in this report. Signals Research Group seeks to do business and may currently be doing business with companies discussed in this report. Readers should be aware that Signals Research Group
might have a conflict of interest that could affect the objectivity of this report. Additional information and disclosures can be found at our website at www.signalsresearch.com. This report may not be
reproduced, copied, distributed or published without the prior written authorization of Signals Research Group (copyright ©2013, all rights reserved by Signals Research Group).
18 August 12, 2013 | Signals Ahead, Vol. 9, Number 6 PREVIEWYou can also read


