Fill the Nutrient Gap - Cambodia SUMMARY REPORT - WFP
←
→
Page content transcription
If your browser does not render page correctly, please read the page content below
Saving Lives, Changing Lives

                               Fill the Nutrient Gap
                               Cambodia
                               SUMMARY REPORT

                                                       March 2017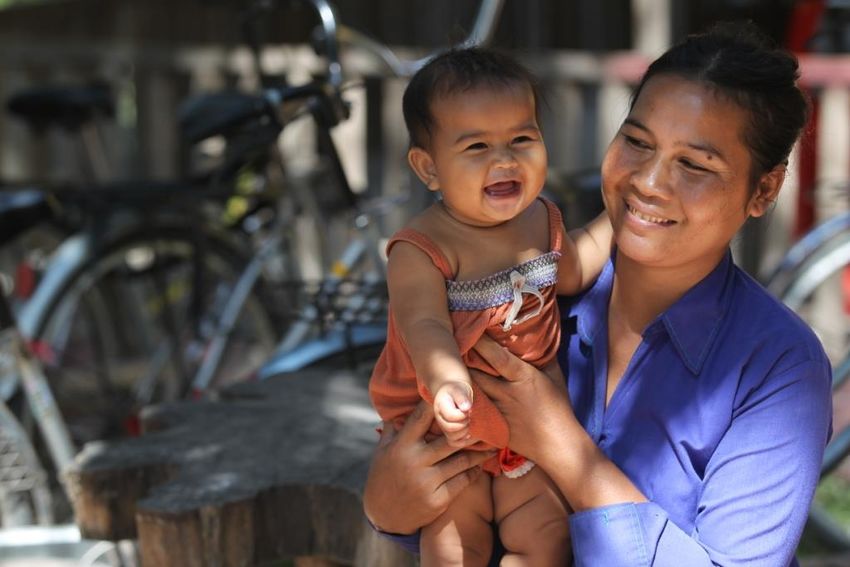
LIST OF ACRONYMS:                                  SPECIAL THANKS TO:
CARD     Council for Agricultural and Rural        National Government
         Development                               • Council for Agricultural and Rural Development
CotD     Cost of the Diet                            (CARD)
FNG      Fill the Nutrient Gap                     • Ministry of Agriculture, Forestry and Fisheries (MAFF)
IFPRI    International Food Policy Research        • Ministry of Education, Youth and Sport (MoEYS)
         Institute                                 • Ministry of Planning (MOP)
MAD      Minimum Acceptable Diet                   • National Maternal and Child Health Center (NMCHC)
MAFF     Ministry of Agriculture, Forestry and     UN Agencies
         Fisheries                                 • Food and Agriculture Organization (FAO)
MAFF     Ministry of Agriculture, Forestry and     • United Nations Children’s Fund (UNICEF)
         Fisheries                                 • World Health Organization (WHO)
MDD      Minimum Dietary Diversity                 NGOs
MDD-W    Minimum Dietary Diversity for Women       • Action Against Hunger (ACF)
MMF      Minimum Meal Frequency                    • Deutsche Gesellschaft für Internationale
NSFSN    National Strategy for Food Security and     Zusammenarbeit (GIZ) Cambodia
         Nutrition                                 • Foundation of Netherlands Volunteers (SNV)
PLW      Pregnant and Lactating Women              • Helen Keller International (HKI)
SBCC     Social Behaviour Change and               • Plan International
         Communication                             • Reproductive and Child Health Alliance (RACHA)
SNF      Specialized Nutritious Food               • Save the Children International (SCI)
SNUT     Staple Adjusted Nutritious Diet           • The Inland Fisheries Research and Development
UNICEF   United Nations Children’s Fund              Institute (IFReDI)
WFP      World Food Programme                      • WorldFish
WRA      Women of Reproductive Age
                                                   PHOTOS:
                                                   •   Cover: WFP/Paul Macleod
                                                   •   Above: WFP/Ratanak Leng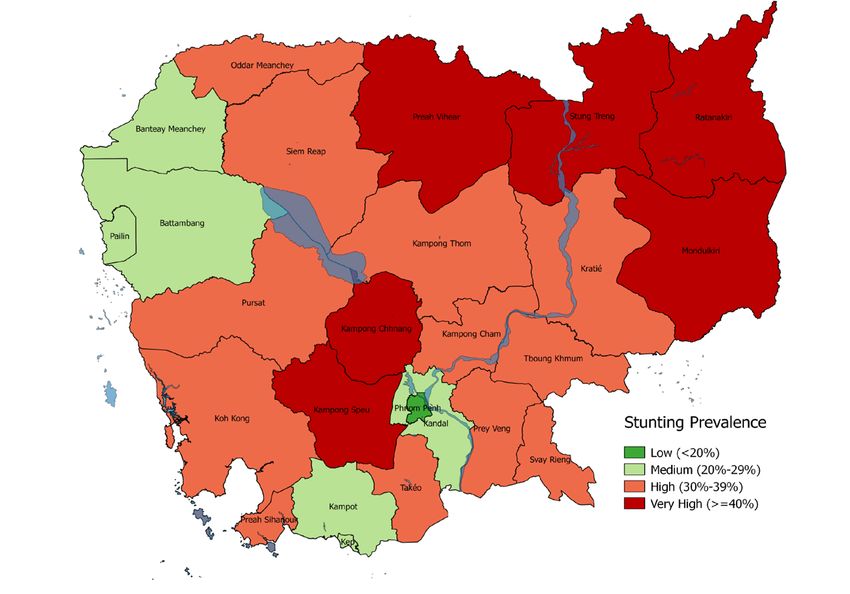
Fill the Nutrient Gap (FNG) is a situation analysis and Fill the Nutrient Gap Key
decision-making tool developed by the World Food Steps
Programme (WFP) with inputs from the University of
California, Davis; the International Food Policy Research 1) Define Focus: Identify target groups
Institute (IFPRI); Epicentre; the United Nations Children’s and geographical and/or seasonal
Fund (UNICEF); Harvard University; and Mahidol University. elements from stakeholder consultation
and national nutrition data.
It identifies context-specific strategies for improving
nutritional intake of vulnerable populations, especially 2) Policy Analysis: Determine if there
during the first 1,000 days from conception to a child’s is an enabling environment for access
second birthday. FNG uses secondary data review and
to, and availability of, nutritious foods,
linear programming analysis to understand a country or
and identify relevant entry points and
region’s nutrition situation, compare the potential impact
of interventions, and identify programme and policy entry platforms for increased availability and
points to ensure consumption of an adequately nutritious access to nutrients.
diet.
3) Analysis of Nutrient Availability and
The FNG process in Cambodia was led by the Council Access: Analyse factors such as local
for Agricultural and Rural Development (CARD) and WFP preferences and practices, and estimate
from March 2017 (Fig. 1). The Ministry of Agriculture,
nutrient gaps for key target groups and
Forestry and Fisheries (MAFF) collaborated with WFP to
context-appropriate interventions to fill
collect market price data for the Cost of the Diet (CotD)
study. Key national stakeholders were engaged to define nutrient gaps.
the scope of the analysis, provide and consolidate secondary 4) Recommendations for
data and provide input into the CotD modelling (Fig. 2).
Inter ve nt ions: Identify roles for
different sectors and stakeholders,
and public platforms for policy and
programmes.
National
CARD, MAFF, MoEYS, MoP, NMCHC
Government
WFP Cambodia Country Office, HQ, RBB
FNG Cambodia
Team
UN Agencies UNICEF, WHO, FAO
Other SCI, HKI, Plan International, World Fish, IFReDI, RACHA, GIZ,
Partners ACF, SNV
Figure 1: Stakeholders Involved in the FNG Process
Fill the Nutrient Gap Cambodia – Summary Report | 1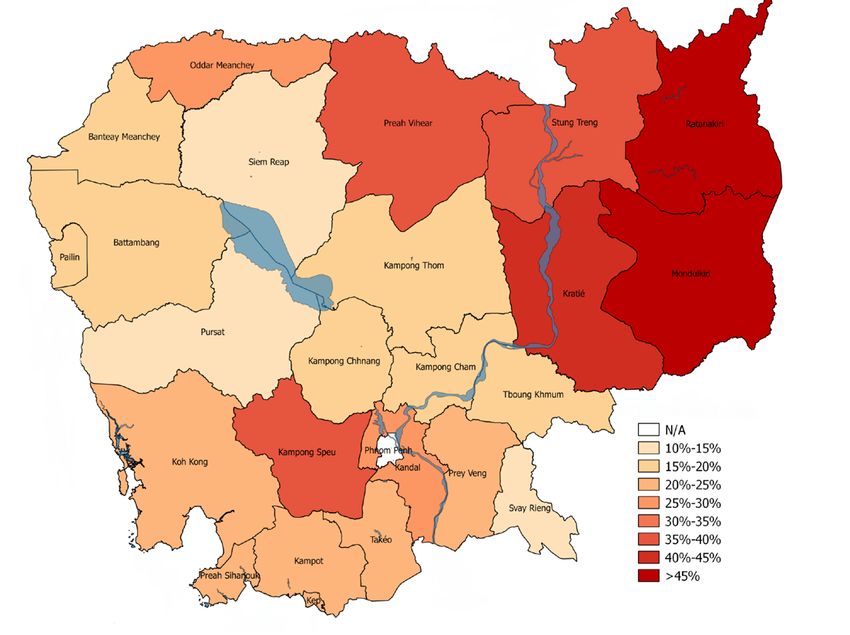
Stakeholder Engagement Process
1) DEFINE FOCUS 2-3) ANALYSIS 4) RECOMMENDATION
Small follow-up Technical working group
Multi-stakeholder
stakeholder meetings meeting
Consensus on key Data compilation and Stakeholder dissemination co-
target groups and analytical input hosted by GHS and WFP
level of analysis
Joint identification of
Drafting of report, Cost of
potential strategies
Figure 2: The FNG
1) Define Focus
The key target groups for analysis were identified by stakeholders, based on the current malnutrition
chararacteristic across Cambodia.
CHILDREN UNDER 5:
• Stunting: 32 percent in children under 5. Highest in poor households and in mountain/
plateau provinces (Fig. 3 and 5).
• Wasting: 10 percent of children under 5 (Fig. 3).
• Anaemia: 56 percent among children under 5, causes likely include micronutrient
deficiencies, thalassemia and helminth infections (Fig.
3).
• Overall decline in undernutrition but progress is vulnerable to natural and economic
shocks (Fig. 3).
ADOLESCENT GIRLS (10-19 YEARS):
• 12 percent of women aged 15 to 19 are pregnant or have given birth.
• 28 percent of women aged 15-19 are thin.
PREGNANT AND LACTATING WOMEN (PLW):
• Thinness: 14 percent in women of reproductive age (WRA); strong link between maternal
thinness and undernutrition in children.
• Overweight/Obesity: Currently at 18 percent but increases as women age (Fig. 4). Must
beware of rising double burden.
• Anaemia: 45 percent of all women, but higher in PLW.
35
70 31
62
30
60 55 56 28
50 25 24
50 43
Prevalence (%)
39 40
Prevalence (%)
20
40 17
32
28 28 15
30 24
11
20
17 10 8
7
11 10
8
10 5 3
0 0
2000 2005 2010 2014 15-19 years 20-29 years 30-39 years 40-49 years
Anaemia Stunting Underweight Wasting Undernutrition (BMI 25)
Figure 3: National prevalence of stunting, wasting, underweight Figure 4: National prevalence of undernutrition and
and anaemia in children under 5 (National Institute of overnutrition among women 15-49 by age (National
Statistics, 2015). Institute of Statistics, 2015)
2|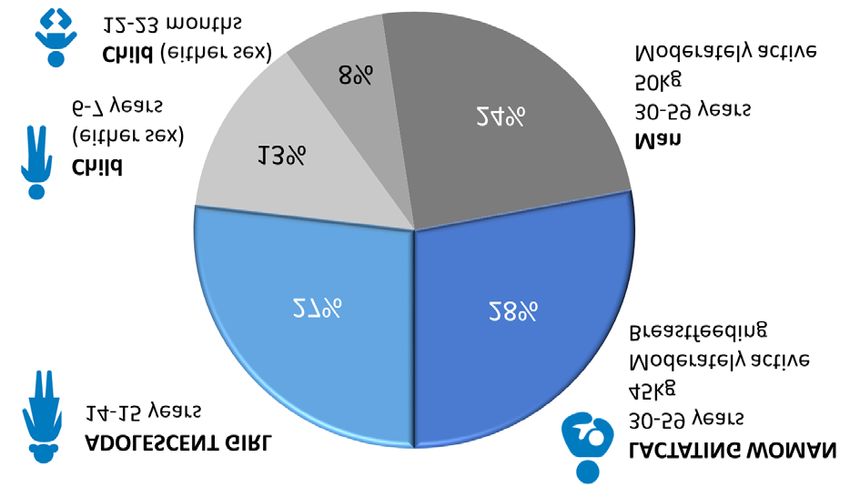
2) Policy Analysis
An enabling policy environment can provide entry »» Emergency food assistance in response to
points for nutrition interventions across different shocks.
sectors. In Cambodia, relevant existing policies and
»» Pilot projects providing cash to improve
programmes include:
nutrition during the first 1,000 days, i.e. among
NATIONAL POLICY AND LEGAL pregnant and lactating women and children
FRAMEWORK: under 2.
• CARD: National Strategy for Food Security and STRATEGIC PARTNERSHIPS AND
Nutrition 2014 - 2018 (NSFSN): PROGRAMMES TO INCREASE AVAILABILITY
»» Scaling Up Nutrition (SUN) member since AND ACCESS TO NUTRITIOUS FOODS:
2014: CARD serves as focal point. • Num Trey (two different products): A locally
»» Targets food availability/access, utilization produced ready-to-use therapeutic food from
and stability; aligned with social protection. legumes and dried fish to treat Moderate and
Severe Acute Malnutrition, and a healthy snack
»» High level political commitment; requires
soon to be available on the market.
adequate funding.
• NOURISH fish powder: A nutritious powder
• Ministry of Health (MOH): National Nutrition
made from small fish that can be added to other
Programme 2009 – 2015:
foods to improve the nutrient content.
»» Targets micronutrient deficiencies in infants
• Home Grown School Meals:
and young children/WRA; focuses on multi-
sectoral collaboration. » » The National School Meals programme is
being led by WFP with plans for handover to
»» Fast Track Road Map for Improving Nutrition
government in 2021.
2014-2020
• Fortification: »» In 2016/2017, the programme was
implemented in 84 schools and reached
»» Mandatory salt iodisation since 2003,
17,200 pre-primary and primary school
although poor compliance.
students.
»» Mandatory fish and soy sauce fortification
• Nutrition sensitive agriculture and aquaculture:
since 2015, although poor compliance.
» » Improving nutrition through fisheries
• Social protection:
and aquaculture is a major initiative pursued
»» National Social Protection Policy Framework
by the Fisheries Administration and partners
2016-2025 (NSPPF)
such as World Fish.
»» A number of organizations such as the
NOURISH project aim to improve agricultural
practices in order to improve access and
availability of nutritious foods.
»» Home gardening and poultry rearing
programmes are implemented by many NGOs
such as Helen Keller International and Plan
International.
Figure 5: Stunting prevalence by region
(National Institute of Statistics, 2015).
Fill the Nutrient Gap Cambodia – Summary Report | 33) Analysis of Nutrient Availability and
Access
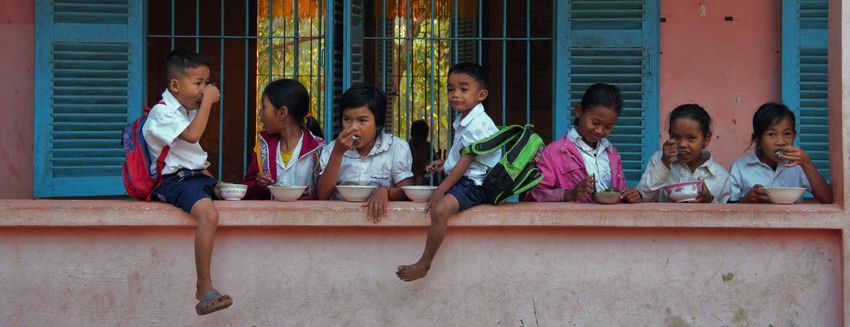
Food availability is not a barrier to consuming a NUTRIENT INTAKE
nutritious diet for the majority of Cambodians.
• Household diets are rice-based with some
Most agricultural households produce their rice
needs, but rely on markets and foraging to access fish and vegetables, but there is little
micronutrient rich foods. These households are consumption of other food groups (Fig. 7).
vulnerable to shocks (floods, drought, deforestation) Undernourishment is low at 14 percent
that impact their income, production and access to suggesting that diet quality and diversity is
forests, limiting their access to micronutrient-rich more of an issue than food quantity.
food.
• Cambodia has the highest prevalence of
exclusive breastfeeding at 6 months in
AVAILABILITY
Southeast Asia (65 percent), but other
• 270 foods on average were found in markets
infant feeding practices need improvement.
during the CotD survey across 19 regions.
Practices are worse in urban areas due to
• Rice dominates national production, economic constraints, beliefs and breastmilk
illustrating the limited crop diversity in the substitute advertising.
country.
• Only 32 percent of breastfed children 6-23
• Specialized nutritious foods are widely months eat a minimum acceptable diet (Fig.8).
available in Phnom Penh, but not in rural Many children are fed unhealthy packaged
markets. Num Trey and NOURISH fish powder snack foods in urban and rural areas.
hope to be available through markets in the
• Women’s dietary diversity is low and most do
future.
not change their diet during pregnancy and
breastfeeding, when needs are high.
ACCESS
• The coverage of Vitamin A and Iron Folic Acid
• Nearly 80 percent of the lowest wealth quintile supplementation for vulnerable groups could
work in agriculture. These households are the be improved, as could the provision.
most vulnerable to shocks and food insecurity. (Table 1&2)
• The majority of agricultural households (82
percent) produce their own rice and purchase LOCAL PREFERENCES AND PRACTICES
all other food from markets: fruit (72 percent),
vegetables (66 percent), root crops (58 • Economic challenges: Mothers return to work
percent), beans and pulses (71 percent), fish and leave children with caregivers.
(75 percent) and meat/animal products (82 • Cost and time constraints: Prevent mothers
percent). and caregivers cooking enriched rice
• Market access throughout the country is good, porridge. Some buy from vendors but often it
but economic access to a nutritious diet varies is of poor quality.
(Fig. 6). In regions where stunting is high but • Key influencers: Grandmothers, husbands
non-affordability of a nutritious diet (Fig. 6) and health workers.
is low, other factors such as maternal health • Key barriers: Women’s lack of time,
practices, water and sanitation and dietary insufficient knowledge on complementary
practices may be key drivers. feeding, beliefs on “eating down” for easy
delivery.
4|Fish: 173g
Figure 7: Average percentage of total food intake by food group
Figure 6: Percentage of non-affordability of the Staple-Adjusted in Cambodia. Grams are per capita consumption per day
Nutritious diet by region (Cost of the Diet Analysis, 2017) (Inland Fisheries Research and Development Institute, 2012)
Modelling Dietary Improvement
Minimum Meal Minimum Minimum
The secondary data on availability and access, Frequency Dietary Diversity Acceptable Diet
as well as actual nutrient intake and influencing
cultural factors, informed affordability modelling and 26%
intervention recommendations. Results from the 60%
40% 32%
68%
linear programming analysis were used to examine if 74%
optimized diets with locally available foods could meet
nutrient needs for target groups.
Figure 8: Percentage of breastfed children 6-23 months
CotD analysis was conducted using primary data on eating a Minimum Acceptable Diet in Cambodia
market prices collected in 5 markets in 19 regions (National Institute of Statistics, 2015)
(95 total), as well as secondary data on household
composition and expenditure from the 2016 WFP/
UNICEF/FAO Resilience Survey. CotD software Children 6-59 months
calculates the lowest cost, locally available diet that Vitamin A 70% (coverage)
meets nutrient needs when adjusted to incorporate
local staple food. This is known as the Staple Adjusted Deworming 59%
Nutritious Diet (SNUT). The staple foods, in all
provinces, were daily portions of rice and fish and
Pregnant and Lactating Women
three servings per week of morning glory. Intervention
modelling was undertaken in the Battambang/Pailin 96% took any
(Tonle Sap), Kampot/Kep (Coastal), Prey Veng (Plain) Iron Folic Acid 76% > recieved 90 doses
49% post-partum
and Ratanak Kiri/Mondul Kiri (Mountain/Plateau)
regions. Deworming 72%
The model household used for CotD was based on the Tables 1 & 2: The national coverage of micronutrient and
average household size in Cambodia and included a deworming distribution in Cambodia for children 6-59 months
and PLWs (National Institute of Statistics, 2015)
child 12-23 months, a child 6-7 years, an adolescent
girl 14-15 years, a lactating adult woman, and an adult
man.
Fill the Nutrient Gap Cambodia – Summary Report | 5RESULTS
• The average daily cost of the SNUT diet was
KHR 14,792 (USD 3.62), ranging from KHR
12,081 (USD 2.96) in Pursat, to KHR 24,750
(USD 6.06) in Ratanak Kiri/Mondul Kiri.
• The lactating woman and adolescent girl
were the most expensive in order to meet
nutritional needs. This is due to increased
nutrient needs during these lifecycle periods
(Fig. 9).
• On average, 21 percent cannot afford the Figure 9: Percentage cost of the SNUT diet by household
member (Cost of the Diet Analysis, 2017)
least expensive adequate nutritious diet,
ranging from 12 percent in Pursat and Siem
Reap to 66 percent in Ratanak Kiri/Mondul Kiri
The most effective interventions for each
(Fig. 6). target group were as follows:
• Blood, offal, green leafy vegetables, pulses
and fish were identified as inexpensive and • Children 6-23 months: Vouchers or in-kind
available foods, that are rich in nutrients. provision of Num Trey or NOURISH fish
• For the non-breastfed child under 2, the cost powder were most effective, reducing the daily
of the SNUT diet was 44 percent higher than cost of the SNUT diet by 47 percent and 51
for a breastfed child. percent respectively in the 4 modelled regions
(Fig. 10).
• High consumption of unhealthy snack foods
could increase the cost for the child by 38 • Adolescent girls: A fresh food voucher of fish
percent. and morning glory is the most effective, reducing
the cost of the SNUT diet by 8 percent (Fig. 11).
• Pregnancy during adolescence increased the
cost of the SNUT diet by 10 percent, and • PLW: Voucher or in-kind provision of NOURISH
lactation by 15 percent. fish powder was most effective reducing the
cost of the SNUT diet by 16 percent. An iron/
To improve the affordability of the SNUT diet, folic acid tablet reduced the cost of the SNUT
various interventions were modelled. These diet by 11percent (Fig. 12).
included vouchers for locally available nutritious • Household: Fortified rice somewhat reduced
fresh foods, market available fortified staples,
the cost of the SNUT diet for the household.
specialized nutritious foods (SNFs), micronutrient
HKI’s homestead gardening and fish pond
supplements, home gardening interventions, and
intervention had the greatest impact in
Home Grown School Feeding for the school aged
reducing the cost of the SNUT diet for the
child. Monthly cash transfers to the household
of USD 6.00 and USD 10.80, based on ongoing household by 14 percent and 12 percent
programmes, were also modelled. The modelled respectively (Fig. 13).
diets are theoretical and would need to be
accompanied by complementary behaviour
change interventions.The implementation costs
were not included in the calculation,a next step
would be to conduct a costing exercise.
6|COST OF THE DIET MODELLING
Interventions Modelled
Average cost of SNUT diet for key target groups
in Battambang/Pailin, Kampot/Kep, Prey Veng and Locally available nutritious
Ratanak Kiri/Modul Kiri regions of Cambodia with foods (vouchers)
different interventions (Fig. 10 child 6-23 months;
Fortification (market)
Fig .11 adolescent girl; Fig. 12 PLW)
Specialized nutritious
Provision of Num Trey and NOURISH fish powder
foods (in-kind/ voucher)
through a voucher/in-kind was the most effective
at reducing the cost of the SNUT diet in all Cash transfers
regions. However, their market price point may
need to be reviewed. Home gardening
An IFA supplement and fresh food voucher provided
in-kind were equally effective in reducing the cost of
the SNUT diet of the adolescent girls in all regions.
NOURISH fish powder provided in-kind was the
most effective for the PLW.
Packages of household level interventions and
potential effect on economic access to nutrients
for vulnerable groups
Individual interventions were combined to form
a package of targeted interventions, shown in
Figure 13. This package was also combined with a
home gardening intervention and the introduction
of fortified rice. The combination of these
interventions can improve non-affordability by 18
to 35 percentage points.
Cash Transfers of USD 10.80 and USD 6.00 could
also greatly improve affordability of a nutritious
diet, as shown in Table 2. It is assumed that all the
money given would be spent on food and that all
households that cannot afford a nutritious diet
would receive the cash transfer. A cash transfer
in combination with the intervention packages
could be reduce non-affordability by 19 to 42
percentage points.
Fill the Nutrient Gap Cambodia – Summary Report | 7(Market price x3 times per day)
Figure 10: Cost of SNUT diet for the breastfed child 6-23 months with different interventions
Fresh Food Voucher (FFV)
Figure 11: Cost of SNUT diet for an adolescent girl with different interventions
(Market price x3 times per day)
Figure 12: Cost of SNUT diet for a PLW with different interventions
8|Figure 13: Household non-affordability of SNUT diet with a combination of targeted and household interventions: Num Trey
for breastfed child 6-23 months; Home Grown School Feeding lunch with fortified rice for school aged child; NOURISH fish
powder for PLW; Fresh food vouchers for adolescent girl; Home gardening and fortified rice for household.
Percentage of Households
Cash Cash Transfer
Region that cannot afford a
Transfer $6 $10.80
Nutritious Diet
Battambang/Pailin 20% 16% 14%
Kampot/Kep 22% 20% 18%
Prey Veng 25% 20% 17%
Ratanak Kiri/Mondul Kiri 66% 63% 60%
Table 3: Household affordability of SNUT with a cash transfer of USD 6 or USD 10.80.
Fill the Nutrient Gap Cambodia – Summary Report | 9Conclusions
1. Child malnutrition varies geographically 4. The quality and diversity of households’
and is impacted by socioeconomic diet is a concern. This is influenced by
factors, mothers’ nutritional status and limited crop diversification, dietary
shocks. preferences and economic access.
• Undernutrition in infants and young children • Undernourishment in Cambodia is low, which
remains high despite decreases over the past 20 suggests that the quality and diversity of the
years and disproportionately affects the poorest diet is of more concern than meeting energy
households. Children with thin mothers are more requirements.
likely to be stunted or wasted. • Despite high food availability in local markets, rice
• Anaemia in women and children is a severe public dominates the diet with some consumption of
health problem, but the causes are multi-factoral, fish and vegetables. For a more nutritious diet,
including genetic, which cannot be treated. rice consumption would need to decrease, whilst
• The small reduction in stunting and wasting from vegetable and legume consumption would need
2005-2010 is thought to be due to the global to increase.
financial crisis and flooding. • Households report that the cost of nutritious
foods is a key barrier to their consumption,
2. The double burden of malnutrition however on average only 21 percent of the
is increasing and exacerbated by rapid population could not afford the SNUT diet.
urbanization, and excessive consumption
of rice and snack food consumption in 5. Malnutrition indicators do not seem
children. to be related to economic access to a
• Although the double burden in Cambodia is low
nutritious diet. Stunting prevalence
compared to other countries in South East Asia,
is high in areas of low AND high non-
the percentage of overweight and obese women affordability.
has tripled from 2000 to 2014. • In the Mountain/Plateau regions stunting and
• Cambodia is experiencing rapid urbanisation, non-affordability of the SNUT diet are high, driven
which has been associated with an increase in by high food prices as found during the CotD
overweight and obesity in other countries. market survey.
• The cultural significance of rice could lead to • However, in other regions, stunting is high but
overconsumption and excessive energy intake. non-affordability of the SNUT diet is low, which
This, coupled with the increase in unhealthy suggests that other factors (such as maternal
packaged snack food consumption, particularly in health practices, water and sanitation and dietary
children, could exacerbate rising overweight and practices) are key drivers.
obesity. 6. Women’s diets, particularly during
3. Despite economic development, pregnancy and breastfeeding, are poor
household access to sufficient and and contribute to malnutrition in their
nutritious food remains a challenge, children.
particularly for poor rural households • The cost of a nutritious (SNUT) diet was most
engaged in agriculture. expensive for the adolescent girl and lactating
• Poor households engaged in agriculture are the woman due to increased micronutrient needs
most food insecure and rely on markets and during these life cycle periods.
foraging to source foods other than rice. • Region specific studies suggest that women’s
• Although the majority of these households can dietary diversity (MDD-W) is poor, with low
access a market in less than 30 minutes, changes consumption of micronutrient-rich foods such as
to their income, food prices and forest coverage beans, nuts, dairy, eggs and vitamin A rich fruits/
could lead to greater food insecurity and the vegetables.
adoption of coping strategies. • Data suggests women’s diets do not change
during pregnancy or breastfeeding, driven
by local customs based on the desire for an
easy delivery and to prevent post-delivery
complications.
10 |7. Breastfeeding practices are almost 10. The food system provides a range of
universal. However, sustaining the gains promising entry points across multiple
will be challenging. Specific attention is sectors, both public and private, to
needed in improving practices in urban improve access to nutrients for vulnerable
areas. groups.
• Although Cambodia is a regional leader in • The health system, social protection, school
exclusive breastfeeding, the rate of breastfeeding feeding, agricultural diversification, as well as the
within one hour of birth, exclusive breastfeeding garment industry are examples of platforms to be
at 4-5 months and continued breastfeeding at 2 leveraged.
years should be improved. • The enabling environment offers opportunities,
• Breastfeeding practices are particularly poor in including the regulation of the marketing of snack
urban areas as many women return to work after foods and breastmilk substitutes; development
3 months, see ‘chubby’ babies as a status symbol of quality seals for nutritious foods; compliance
and are influenced by extensive breast-milk monitoring of fortification programmes; and
substitute advertising and promotion. national and decentralized multi-sectoral
approaches.
8. Complementary feeding practices are
suboptimal and an important barrier to • Market availability of affordable, safe, nutritious
nutrient intake in children 6-23 months. and convenience foods, together with demand
creation for healthy diets and lifestyles are critical
• Trends in stunting and anaemia suggest
aspects to be addressed.
inadequate nutrient intake among children 6-12
months, when complementary foods are first
introduced.
• Most children are fed watery rice porridge
(borbor) and few mothers enrich this with
nutrient-dense foods, such as fish, meat and
vegetables. Consequently only 32 percent of
breastfed children 6-23 months are fed Minimum
Acceptable Diets (MAD) due to low dietary
diversity.
• The cost of nutritious foods, time restrictions and
women returning to work are cited as the main
barriers to appropriate complementary feeding.
9. Context specific integrated packages
of interventions have the greatest
potential to improve the affordability of a
nutritious diet.
• CotD modelling shows that specialized nutritious
foods are the most effective interventions to
reduce the cost of meeting nutrient needs for
children 12-23 months and PLW.
• A fresh food voucher and iron/folic acid
supplementation are the most effective
interventions to reduce the cost of meeting
nutrient needs for an adolescent girl.
• A combination of the most effective fresh food
interventions and a cash transfer are the most
effective package to improve the affordability
of a nutritious diet for the household. However,
programming cost and delivery platforms still
need to be taken into consideration.
Fill the Nutrient Gap Cambodia – Summary Report | 114) Stakeholders’ Recommendations
Recommendations were formulated during stakeholder discussions and informed by the secondary
data analysis and CotD modelling. They include programme and policy measures to address access,
availability and demand for nutrients and nutritious foods. The recommended actions have the
potential to increase consumption of nutrient-dense foods, especially by vulnerable target groups.
Fresh foods, agriculture and aquaculture
• Homestead food production– scale up food production at the home to improve consumption of
micronutrient dense food and increase income (which can lead to better dietary diversity of the
household). Vulnerable/food insecure households to be prioritized, as well as households including
pregnant women or children under 2. Specific delivery platforms identified for this strategy include
linking homestead food production to education platforms, NGO community based programmes,
school education programmes, as well as community fisheries.
• Diversification of commercial production- specific entry points to make food production systems
for small scale farmers more nutrition-sensitive include: community level access through markets;
agriculture cooperatives; smallholder farmer organizations; community fisheries and forestry
initiatives; linkages between producers and the food processing industry; market/private sector.
Working with local food sellers/entrepreneurs to improve access to affordable nutritious food-
cooked foods, fresh foods and healthy snacks.
• Education, linking agriculture to nutrition (including skills training)- key entry points for this include:
women farmer organizations, agriculture extension workers, NGO programmes, school platforms,
including Home Grown School Feeding programmes and academia.
Processed foods, including fortification
• Prevention of micronutrient deficiencies through market and home processing– partnering with
the private sector to ensure the availability of safe, nutritious products on the market, tailored
to the needs of young children, as well as older children and adolescents. Improving cold chain
and refrigeration access at the household level can also help to improve access to safe nutritious
foods.
• Substitution of unhealthy snack food– in order to reduce unhealthy snack food consumption
the following steps were recommended: government taxation and regulation of snack foods; tax
exemptions to incentivise the private sector to increase the availability of healthy snacks; and
innovative partnerships to increase the supply and demand of healthy diets.
• Regulation of food enterprises at all levels targeting women and children– in order to ensure
the availability of high quality safe nutritious foods it is recommend that there is strengthened
regulation; quality control/ monitoring (with adequate funding to support routine inspection) and
labelling/ certification of quality requirements.
Public Health and Social Behaviour Change Communication (SBCC)
The following potential platforms were identified for SBCC messaging:
• School education curriculum– the reform of the school curriculum is an entry point for improving
knowledge and awareness on nutrition and nutrition-related issues.
• Community based platforms– it is recommended that government, development partners and
local organizations collaborate to empower local councils to stimulate behaviour change in their
communities over time.
12 |• Mass Media and Social Media– social media, radio and television are all important platforms to
communicate nutrition and nutrition-related messages to a mass audience.
It is essential that there is alignment in the messaging provided through different platforms, which
requires strong co-ordination. Better understanding of the food enviroment is required to ensure
that the messaging is well-tailored.
Social Protection
• Review National Social Protection Policy through a nutrition lens– there are a number of ways
the policy can be made more nutrition sensitive such as considering nutrition in targeting and
transfer value and making assistance conditional on health/nutrition-related behaviours.
• Legislative and Formative (educational) context– ensuring that the food environment promotes
nutritionally appropriate spending choices. For example, ensuring the regulation and supply
chain measures are in place to make safe nutritious foods affordable and available. Demand
creation strategies also need to be put in place to encourage recipients to make optimal
spending choices.
• Link Social Protection to emergency response– to help rebuild vulnerable communities and
protect nutritional well-being and development gains.
Fill the Nutrient Gap Cambodia – Summary Report | 13Printed: March 2018. Nutrition Division (OSN) World Food Programme Via Cesare Giulio Viola 68/70 00148 Rome, Italy T +39 06 65131 wfp.org
You can also read