FINAL DECISION Endeavour Energy distribution determination 2015 16 to 2018 19 Overview - April 2015
←
→
Page content transcription
If your browser does not render page correctly, please read the page content below

FINAL DECISION
    Endeavour Energy distribution
           determination
         2015−16 to 2018−19

                                  Overview
                                       April 2015

0    Final decision | Endeavour Energy distribution determination 2015–19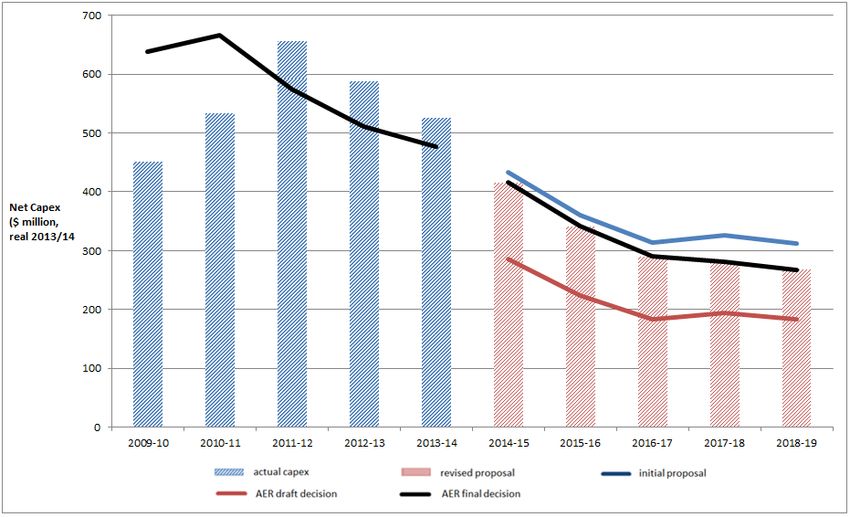
© Commonwealth of Australia 2015
This work is copyright. In addition to any use permitted under the Copyright Act 1968,
all material contained within this work is provided under a Creative Commons
Attributions 3.0 Australia licence, with the exception of:
the Commonwealth Coat of Arms
the ACCC and AER logos
any illustration, diagram, photograph or graphic over which the Australian
Competition and Consumer Commission does not hold copyright, but which may be
part of or contained within this publication. The details of the relevant licence
conditions are available on the Creative Commons website, as is the full legal code
for the CC BY 3.0 AU licence.
Requests and inquiries concerning reproduction and rights should be addressed to the:
Director, Corporate Communications
Australian Competition and Consumer Commission
GPO Box 4141, Canberra ACT 2601
or publishing.unit@accc.gov.au.
Inquiries about this publication should be addressed to:
Australian Energy Regulator
GPO Box 520
Melbourne Vic 3001
Tel: (03) 9290 1444
Fax: (03) 9290 1457
Email: AERInquiry@aer.gov.au
AER reference: 52294
1 Final decision | Endeavour Energy distribution determination 2015–19Note This overview forms part of the AER's final decision on Endeavour Energy’s distribution determination for 2015–19. It should be read with other parts of the final decision. The final decision includes the following documents: Overview Attachment 1 – annual revenue requirement Attachment 2 – regulatory asset base Attachment 3 – rate of return Attachment 4 – value of imputation credits Attachment 5 – regulatory depreciation Attachment 6 – capital expenditure Attachment 7 – operating expenditure Attachment 8 – corporate income tax Attachment 9 – efficiency benefit sharing scheme Attachment 10 – capital expenditure sharing scheme Attachment 11 – service target performance incentive scheme Attachment 12 – demand management incentive scheme Attachment 13 – classification of services Attachment 14 – control mechanisms Attachment 15 – pass through events Attachment 16 – alternative control services Attachment 17 – negotiated services framework and criteria Attachment 18 – connection policy Attachment 19 – pricing methodology 2 Final decision | Endeavour Energy distribution determination 2015–19
Contents

Note .................................................................................................................. 2

Contents .......................................................................................................... 3

Shortened forms ............................................................................................. 5

1     Our final decision ..................................................................................... 7

      1.1 Decision .............................................................................................. 8

      1.2 Contribution to the achievement of the NEO ................................ 10

            1.2.1        Rate of return ............................................................................... 12

            1.2.2        Operating Expenditure ................................................................. 13

      1.3 Key issues raised in revised proposal ........................................... 14

            1.3.1        Safety and reliability ..................................................................... 14

            1.3.2        Use of benchmarking ................................................................... 15

            1.3.3        Consumer engagement ................................................................ 16

            1.3.4        Financeability ............................................................................... 17

      1.4 Assessment of options under the NEO ......................................... 18

      1.5 Structure of the overview ................................................................ 19

2     Key elements of the building blocks..................................................... 20

      2.1 The building block approach .......................................................... 21

      2.2 Regulatory asset base ..................................................................... 22

      2.3 Rate of return (return on capital) .................................................... 24

            Our approach.............................................................................................. 26

            Return on debt ............................................................................................ 26

            Return on equity ......................................................................................... 28

      2.4 Value of imputation credits (gamma) ............................................. 30

      2.5 Regulatory depreciation (return of capital) ................................... 31

3       Overview | Endeavour Energy Final decision 2015–19
2.6 Capital expenditure.......................................................................... 32
2.7 Operating expenditure..................................................................... 34
2.8 Corporate income tax ...................................................................... 36
3 Service classification, control mechanisms, and incentive schemes38
3.1 Service classification and control mechanisms ........................... 38
3.2 Alternative control services ............................................................ 39
3.3 Incentive schemes ........................................................................... 40
3.3.1 Efficiency benefit sharing scheme ................................................ 41
3.3.2 Capital expenditure sharing scheme ............................................ 41
3.3.3 Service target performance incentive scheme .............................. 42
3.3.4 Demand management incentive scheme...................................... 43
4 Regulatory framework ............................................................................ 44
4.1 Understanding the NEO .................................................................. 46
4.2 The 2012 framework changes ......................................................... 47
4.2.1 Interrelationships .......................................................................... 48
5 Process.................................................................................................... 50
5.1 Better Regulation program ............................................................. 50
5.2 Our engagement during the decision making process ................ 50
6 Next steps ............................................................................................... 52
Appendix A – Constituent decisions ........................................................... 53
Appendix B – List of submissions .............................................................. 56
4 Overview | Endeavour Energy Final decision 2015–19Shortened forms
Shortened form Extended form
AEMC Australian Energy Market Commission
AEMO Australian Energy Market Operator
AER Australian Energy Regulator
augex augmentation expenditure
capex capital expenditure
CCP Consumer Challenge Panel
CESS capital expenditure sharing scheme
CPI consumer price index
DRP debt risk premium
DMIA demand management innovation allowance
DMIS demand management incentive scheme
distributor distribution network service provider
DUoS distribution use of system
EBSS efficiency benefit sharing scheme
ERP equity risk premium
Expenditure Forecast Assessment Guideline for electricity
Expenditure Assessment Guideline
distribution
F&A framework and approach
MRP market risk premium
NEL national electricity law
NEM national electricity market
NEO national electricity objective
NER national electricity rules
NSP network service provider
opex operating expenditure
PPI partial performance indicators
PTRM post-tax revenue model
RAB regulatory asset base
RBA Reserve Bank of Australia
repex replacement expenditure
RFM roll forward model
5 Overview | Endeavour Energy Final decision 2015–19Shortened form Extended form RIN regulatory information notice RPP revenue and pricing principles SAIDI system average interruption duration index SAIFI system average interruption frequency index SLCAPM Sharpe-Lintner capital asset pricing model STPIS service target performance incentive scheme WACC weighted average cost of capital 6 Overview | Endeavour Energy Final decision 2015–19
1 Our final decision
The Australian Energy Regulator (AER) is responsible for the economic regulation of
electricity transmission and distribution systems in all states and territories except
Western Australian and the Northern Territory. Endeavour Energy is one of three
distribution network service providers (distributors) in NSW and is responsible for
providing electricity distribution services in Sydney's Greater West, the Blue
Mountains, Southern Highlands, Illawarra and South Coast of NSW. We regulate the
revenues Endeavour Energy and the other distributors can recover from their
customers.

The National Electricity Law (NEL) and National Electricity Rules (NER) provide the
regulatory framework under which we operate. Most relevantly, they set out how we
must assess a regulatory proposal and make our decision.

The National Electricity Objective (NEO) sits at the centre of the NEL and NER. The
NEO is to promote efficient investment in, and efficient operation and use of, electricity
services for the long term interests of consumers of electricity with respect to—

         price, quality, safety, reliability and security of supply of electricity; and
                                                                                             1
         the reliability, safety and security of the national electricity system.

Under the NER, Endeavour Energy must submit a regulatory proposal to us for
approval.2 The central component of a regulatory proposal is the amount of revenue
Endeavour Energy proposes to recover from consumers over the 2015-19 regulatory
control period.3 We must assess Endeavour Energy's proposal, using the NER's
detailed rules. The NER addresses a range of constituent components of a revenue
proposal. We must decide whether to accept Endeavour Energy's proposal. If we do
not accept that Endeavour Energy's proposal complies with the NER's requirements,
we must substitute an alternative amount of revenue that we are satisfied does comply.
We must undertake this assessment and make this decision in a manner that will or is
likely to contribute to the achievement of the NEO and, where appropriate, contribute
to the greatest degree.

We regulate Endeavour Energy's revenue, not its costs. Endeavour Energy must
decide how best to use this revenue in providing distribution services and fulfilling its
obligations. This provides incentives for distributors, such as Endeavour Energy, to
operate their businesses efficiently and, in the long run, at least cost to consumers. It

1
    NEL, s. 7.
2
    NER, cl. 6.8.2.
3
    NER, cll. 6.3.1 and 6.8.2. As we explained in our draft decision, the regulatory control period is 2015-19. However,
    the NER requires us to determine a notional annual revenue requirement for each year of the 2014-19 period. We
    must then true this us with the placeholder 2014-15 annual revenue requirement we determined in the placeholder
    decision we made in 2014. As a result, this decision often refers to the 2014-19 period, rather than the 2015-19
    regulatory control period.

7      Overview | Endeavour Energy Final decision 2015–19
also provides incentives for distributors to innovate and invest in response to changes
in consumer needs and productive opportunities.4 This is consistent with economic
efficiency principles. It also means that the person who is best able to manage a risk,
generally carries that risk.
Endeavour Energy submitted its regulatory proposal in May 2014. In November 2014
we made a draft decision and, in January 2015, Endeavour Energy submitted a revised
proposal. We also received submissions from various stakeholders on Endeavour
Energy's initial and revised proposal as well as our draft decision.
This overview, together with its attachments, constitutes our final decision on
Endeavour Energy's revised proposal. The overview provides a summary of our
decision, including all the constituent components that make up our final decision. It
sets out the issues we covered, the conclusions we made, and how those conclusions
were reached. We also explain why we are satisfied our decision contributes to the
achievement of the NEO to the greatest degree and why we do not consider that
Endeavour Energy's revised proposal contributes to the achievement of the NEO to a
satisfactory degree. In our attachments we set out detailed analysis of the constituent
components that make up Endeavour Energy's revised proposal and our decision on
each of them. There is a full list of the constituent components of this decision in
appendix A.
1.1 Decision
Our final decision is that Endeavour Energy can recover $3182.8 million ($ nominal)
from consumers over the 2015–19 regulatory control period. Figure 1 below illustrates
our overall decision.
4
Hansard, SA House of Assembly, 9 February 2005 p. 1452
8 Overview | Endeavour Energy Final decision 2015–19Figure 1 Endeavour Energy's past total revenue, proposed total revenue
and AER total revenue allowance ($ million, 2013–14)
1200
1000
800
Total
600
revenue
$m (real
2013-14) 400
200
0
Actual (incl. meters) Allowed (incl. meters) Proposed (smoothed)
AER draft (smoothed) Revised proposed (smoothed) AER final (smoothed)
Source: AER analysis.
Distribution charges represent approximately 39 per cent, on average, of the annual
electricity bill for Endeavour Energy customers.5 If the lower distribution charges
flowing from our decision are passed through to customers, we would expect the
average annual electricity bill for residential and small business customers to reduce in
the 2015–19 regulatory control period. However, other factors also affect a customer’s
electricity bill, such as the wholesale price of electricity.
Table 1 shows the estimated impact of our final decision on the average residential
and small business customers' annual electricity bills in Endeavour Energy's network
area over the 2014–19 period, compared with what was proposed.
Table 1 AER's estimated impact of the final decision on the average
residential and small business customers' electricity bills in Endeavour
Energy's network for the 2014–19 period ($ nominal)
2013–14 2014–15 2015–16 2016–17 2017–18 2018–19
Endeavour Energy revised proposal
Residential annual billa 2026 1978 2075 2091 2108 2126
Annual change –48 (–2.3%) 96 (4.9%) 17 (0.8%) 17 (0.8%) 17 (0.8%)
5
Endeavour Energy, Regulatory proposal, June 2014, p. 1.
9 Overview | Endeavour Energy Final decision 2015–19Small business annual billb 2909 2841 2979 3003 3027 3052
Annual change –68 (–2.3%) 138 (4.9%) 24 (0.8%) 24 (0.8%) 25 (0.8%)
AER final decision
Residential annual billa 2026 1978 1873 1861 1852 1836
Annual change –48 (–2.3%) –106 (–5.3%) –12 (–0.6%) –10 (–0.5%) –15 (–0.8%)
Small business annual billb 2909 2841 2689 2672 2659 2636
Annual change –68 (–2.3%) –152 (–5.3%) –17 (–0.6%) –14 (–0.5%) –22 (–0.8%)
Source: AER analysis; AER, Energy Made Easy; IPART, Final report: Review of regulated retail prices for electricity -
from 1 July 2013 to 30 June 2016, June 2013, p. 5.
(a) Based on annual charge for typical consumption of 6500KWh per year during the period 1 July 2013 to 30
June 2014. The charges reflect regulated price only. Sample postcode: 2500.
(b) Based on the annual charge sourced from Energy Made Easy for a typical consumption of 10000 kWh per
year during the period 1 July 2013 to 30 June 2014. The charges reflect regulated price only. Sample
postcode: 2500.
1.2 Contribution to the achievement of the NEO
We are satisfied that the total revenue approved in our final decision contributes to the
achievement of the NEO to the greatest degree. This is because our total revenue
reflects the efficient, sustainable costs of providing network services in Endeavour
Energy's operating environment and the key drivers of efficient costs facing Endeavour
Energy. Our decision will promote the efficient investment in, and efficient operation
and use of, electricity services for the long term interests of consumers, as required by
the NEO. We set out our reasons below and in our attachments.
The key drivers of costs facing a network service provider are:6
its accumulated network investment (reflected in the size of its Regulatory Asset
Base, or RAB)
its expected growth in network investment (reflected in its capital expenditure
(capex) program net of capital returned to the shareholders through depreciation)
its financing costs (interest on borrowings and a return on equity to shareholders)
and
its operating expenditure (opex) program (the cost of operating and maintaining its
network)
its taxation cost (taxable income at the corporate tax rate adjusted for the value of
imputation credits).
6
How these key cost drivers impact total revenue is further explained in section 2 of this Overview.
10 Overview | Endeavour Energy Final decision 2015–19From one regulatory period to the next, the pressures on each of these drivers may
change. For example, in periods of high demand growth, a network service provider
would expect to need a larger capex program. Similarly, during periods of high interest
rates, a network service provider would expect to pay more in financing costs.
The most important factors we see impacting on Endeavour Energy's costs in the
2015–19 regulatory control period include:
an improved investment environment compared to our 2009 decision, which
translates to lower financing costs necessary to attract efficient investment.
lower than expected demand growth in the previous regulatory period, which has
led to falling levels of network utilisation across Endeavour Energy's network.
forecast demand, which is expected to remain reasonably flat over the 2015–19
regulatory control period. This means that Endeavour Energy is under less
pressure to expand its network than in the previous regulatory control period to
meet the needs of additional customers or any increased demand from existing
customers.
These factors are reflected throughout our final decision and impact the different
constituent components of our decision to varying degrees. At the total revenue level,
they provide a consistent picture: Endeavour Energy, operating prudently and
efficiently, could provide distribution services with materially less revenue than it has
proposed for the 2015–19 regulatory control period. Further, the average annual
revenue Endeavour Energy requires in the 2015–19 regulatory control period is
materially less than the revenue it recovered from customers in the previous regulatory
control period.
In our final decision we consider that Endeavour Energy's proposal does not reflect the
factors impacting on its cost drivers to a satisfactory extent. As a consequence, we
conclude that Endeavour Energy has proposed to recover more revenue from its
customers than is necessary for the safe and reliable operation of its network. It follows
that we consider that Endeavour Energy's revised proposal does not contribute to the
achievement of the NEO to a satisfactory degree.
Two constituent components of our decision drive most of the difference between
Endeavour Energy's proposed revenue and our final decision: rate of return and opex.
We discuss these further below. Figure 2 illustrates the key differences (in terms of
constituent components, or building blocks, making up total revenue) between our
decision and Endeavour Energy's revised proposal.
11 Overview | Endeavour Energy Final decision 2015–19Figure 2 AER's final decision and Endeavour Energy's revised proposed
annual building block costs ($ million 2013–14)
1200
1000
+6.4 -20.1
800 -125.3
-51.4 -30.1 -2.3
$millions
600
real 2013-14
400
200
0
Revised Return on Opex Regulatory Revenue Corporate Metering Final
proposed capital depreciation adjustments tax and ANS decision
average average
2014-19 2014-19
Source: AER analysis.
1.2.1 Rate of return
The rate of return provides a service provider with revenue to service the interest on its
loans and to give a return on equity to shareholders. The allowed rate of return is a key
determinant of allowed revenue.
The rate of return must be commensurate with the efficient financing costs of a
benchmark efficient entity with a similar degree of risk as that which applies to the
distributor in respect of the provision of distribution services.7 The NER refers to this
requirement as the allowed rate of return objective.
Our final decision is for a rate of return of 6.74 per cent (for 2014–15) compared to
8.85 per cent put forward by Endeavour Energy in its revised proposal.8 The rate of
return for 2015–16 will be 6.68 per cent. For the rest of the regulatory control period,
we will update the rate of return annually.
We set out our approach to determining the rate of return in the Rate of Return
Guideline (Guideline) we published in December 2013.9 This Guideline is not binding.
7
NER, cl. 6.5.2(b)
8
The rate of return that Endeavour Energy included in its proposal is an indicative value. Its proposal includes
provision for the AER to adjust this value based on updated information that was not available when Endeavour
Energy submitted its revised proposal.
9
AER, Rate of Return Guideline, December 2013: http://www.aer.gov.au/node/18859
12 Overview | Endeavour Energy Final decision 2015–19However, a distributor must provide reasons to justify any departure from the
Guideline. Endeavour Energy has proposed we depart from the Guideline. We
disagree.
Prevailing market conditions for debt and equity heavily influence the rate of return. In
our draft decision we pointed out that financial conditions have improved markedly
since our 2009 final decision, resulting in a lower rate of return. Since our draft
decision, interest rates have fallen further and financial market conditions have
continued to ease. This means that the cost of debt and the returns required to attract
equity are lower than when we made our draft decision. We consider these factors
should be reflected in the final rate of return.
On a more technical level, there are two key differences between our final decision and
Endeavour Energy's revised proposal in relation to rate of return:
whether to use a forwards or backwards looking approach in transitioning between
approaches to setting our estimate of the return on debt
whether to give weight to other indicators of the return on equity that Endeavour
Energy considers to be informative but which we do not consider to be robust and
which other regulators do not use.
The Guideline (and indeed, this decision) marks a departure from our previous
approach to estimating the return on debt and the return on equity. For the return on
debt, we have used a gradual, forward looking transition to do so. We set out this
transition in the Guideline. Our approach to setting the return on debt received broad
support across many stakeholders, including some service providers.10 The evidence
Endeavour Energy provided does not convince us that we should depart from the
approach in our Guideline, for this final decision.11 For the return on equity, the expert
evidence before us indicates that on balance employing our approach is expected to
lead to a rate of return that achieves the allowed rate of return objective.
1.2.2 Operating Expenditure
Opex is required to operate and maintain the distributor's network. Like rate of return, it
is a key driver of total revenue.
Our final decision is for a forecast opex amount of $1.22 billion ($2013–14) compared
to $1.47 billion ($2013–14) put forward by Endeavour Energy in its revised proposal.
This reflects a 16.9 per cent reduction.
Whether we should use historical costs as the starting point for forecasting its future
costs is a key issue in determining a distributor's opex forecast. In contrast to Ausgrid
and Essential Energy, we consider that we are able to rely on Endeavour Energy's
10
For example, TasNetworks, Regulatory Proposal, June 2014
11
See Attachment 3 - Rate of Return
13 Overview | Endeavour Energy Final decision 2015–19revealed expenditure as the starting point for determining our estimate of Endeavour
Energy's efficient total forecast opex. This is explained further in attachment 7.
Under the NER, a distributor's proposal must include the total forecast operating
expenditure which the distributor considers is required in order to achieve each of the
following (opex) objectives:
meet or manage expected demand
comply with certain obligations and service standards
maintain the safety of the distribution system.12
For Endeavour Energy, the key issue driving the difference between our final decision
and Endeavour Energy's revised forecast opex is our decision not to include a step
change for increased vegetation management costs.
Endeavour Energy's proposed increase in opex relates to compliance with its existing
regulatory obligations. We are satisfied Endeavour Energy's revealed opex is sufficient
for it to meet all of its existing regulatory obligations including for vegetation
management. We did not consider there was sufficient evidence to support a material
increase above Endeavour Energy's revealed expenditure.
1.3 Key issues raised in revised proposal
In its revised proposal, Endeavour Energy raised some overarching concerns it had
with our draft determination, including:
safety implications of our draft decision
use of benchmarking in setting revenue allowances
consumer engagement
financeability.
We have considered Endeavour Energy's views on these issues in detail in the
relevant attachments. However, we consider these issues are sufficiently important
that we also address them briefly here.
1.3.1 Safety and reliability
Endeavour Energy argued that our draft decision would not provide sufficient revenue
for the company to operate its system safely and reliably. We have considered
Endeavour Energy's and other stakeholders' submissions. This final decision approves
a revenue allowance that will fund the efficient costs that Endeavour Energy acting as
a prudent operator would require to run the system safely and reliably. To the extent
that Endeavour Energy incurs costs that are above efficient levels they should be
borne by Endeavour Energy's shareholders and not its consumers.
12
NER, cll 6.5.6(a)
14 Overview | Endeavour Energy Final decision 2015–19We have considered safety, reliability and security in a number of ways:
our consultant has reviewed Endeavour Energy's risk and governance practices
we have considered operating environment factors, such as network conditions and
other regulatory obligations, that may impact safety, reliability and security
we have considered the reliability and security of the network when considering
individual aspects of the proposal, such as step changes and expenditure on
bushfire mitigation projects
our benchmarking analysis accounts for safety, reliability and security, so that our
substitute opex allowance represents the efficient costs that a prudent operator
would require to run the system at the existing level of safety and reliability we have
allowed all the capex that Endeavour Energy sought that is associated with safety,
reliability and security issues
the Service Target Performance Incentive Scheme (STPIS) provides incentives to
distributors to efficiently maintain and improve service performance..
After making these inquiries, we conclude that Endeavour Energy's distribution
services should be provided at substantially lower cost while still maintaining safety
and complying with reliability obligations.
1.3.2 Use of benchmarking
Endeavour Energy rejected the way we applied benchmarking in the draft decision.
Endeavour Energy suggested that our benchmarking data was untested and
unreliable, and should not play a role in the final determinations.
We have considered Endeavour Energy's submissions and the submissions made by
other stakeholders about our benchmarking models and data. We have confidence in
the data that we used in our benchmarking models as it was developed in conjunction
with industry it has been subject to extensive review and testing. We note that
benchmarking is a well-developed technique used extensively by regulators in many
other jurisdictions. Supported by the views of our benchmarking expert, we consider
our models are the best available for measuring the efficiency of the service providers.
Our benchmarking model was carefully chosen after considering the results of previous
work, the models used by regulators in overseas jurisdictions and the main cost drivers
of electricity distribution businesses. We have adopted a benchmark comparison point
which has a lower efficiency score than the frontier service provider. The benchmark
comparison point for our final decision is AusNet Services.
This approach is consistent with our Expenditure Forecast Assessment Guideline,
which established a materiality threshold for making adjustments to base opex.
While we consider that Endeavour Energy's revealed opex still includes inefficiencies,
we have determined that they are not materially inefficient for the purposes of
developing an alternative forecast that we are satisfied reasonably reflects the opex
criteria. On this basis our final decision is to rely on Endeavour Energy's revealed opex
as a starting point for forecasting its future opex.
15 Overview | Endeavour Energy Final decision 2015–191.3.3 Consumer engagement
Endeavour Energy considers we discounted evidence relating to consumer and
stakeholder preferences.13 In support of its revised proposal, Networks NSW on behalf
of Ausgrid, Endeavour Energy and Essential Energy commissioned further work by
Ipsos into consumer preferences and submitted a report on the preliminary findings of
this research.14 Based on the findings of the research, Endeavour Energy concluded
that:
“…customers are unwilling to sacrifice service offerings (particularly in
terms of number and duration of unplanned blackouts and service
restoration times) for a large reduction in quarterly network charge.”
We considered the report provided by Endeavour Energy and the supporting material
provided in response to our information requests. The findings of the research were
based on the assumption that our draft decision would require the NSW distributors to
reduce safety, service and reliability levels. We do not agree with this assumption and
as such give little weight to the research's findings in our final decision. In our view,
each of the NSW distributors can maintain their levels of efficiency and provide safety,
service and reliability at lower cost to consumers.
We commissioned Oakley Greenwood to peer review the willingness to pay research
conducted by Ipsos. Oakley Greenwood also commented on the key assumption
underpinning the research, that being that Endeavour Energy's assertion that ‘the cuts
proposed by the AER will reduce reliability’. Oakley Greenwood pointed out in its report
that this assumption ‘may have limited the scope as compared to what might have
been a fuller treatment of consumers’ preferences’.15 In other words, research findings
are sensitive to the assumptions used.
In commenting on the conclusions that can be drawn from the Ipsos research, Oakley
Greenwood identified that many customers appear to have misperceived the level of
service they were currently receiving.16 Oakley Greenwood concluded that:
"…the statement that ‘the majority [of customers] are not willing to trade
reliability, safety and service for lower charges’ is an oversimplification of
17
the survey results.”
We find Oakley Greenwood's conclusions compelling. While willingness to pay
research is useful in certain circumstances, it is highly sensitive to the assumptions
13
Endeavour Energy, Revised Regulatory Proposal, January 2015, p. 10
14
Endeavour Energy, Revised Regulatory Proposal, January 2015, Attachment 2.11.
15
Oakley Greenwood, Peer review of the willingness to pay research submitted by NSW distribution business, April
2015, p. 4
16
Oakley Greenwood, Peer review of the willingness to pay research submitted by NSW distribution business, April
2015, p. 11
17
Endeavour Energy, Revised Regulatory Proposal, January 2015, p. 10.
16 Overview | Endeavour Energy Final decision 2015–19used and consumer understanding of those assumptions. The willingness to pay
research commissioned by Networks NSW does provide useful insights. However, the
willingness of customers to make trade-offs is likely to be more complex than the
binary conclusions reached by the NSW distribution businesses.18
We consider that the primary purpose of consumer engagement is for consumers to
have a meaningful opportunity to engage in Endeavour Energy's processes. In
particular, we consider that consumers should be provided with the opportunity to help
shape Endeavour Energy's proposal and the services it offers. Our view is that
Endeavour Energy has not provided consumers with sufficient opportunity to influence
its processes.
1.3.4 Financeability
In its revised proposal, Endeavour Energy indicated that its financial viability would be
threatened as a result of our draft decision. In support of this, Endeavour Energy
submitted a range of material including:
an expert's report from David Newbery submitting that sizeable opex reductions in
a short period of time would negatively impact the ongoing financeability of the
DNSPs and their viability as economic entities19
a confidential credit profile report by Standard and Poors (S&P)20
A report by UBS including confidential content relevant to financeability21
Neither the NEL nor the NER include an explicit obligation requiring us to consider the
impact of our determination on the viability of the service provider in its actual
circumstances. Our task is to determine the revenue that a service provider can
recover from its customers with reference to an efficient and prudent level of
expenditure. The service provider’s actual ownership circumstances and the financial
structure of its shareholders are not factors that we are required to consider in fulfilling
our task under the NEL or the NER.
We are satisfied that a revenue allowance that meets the requirements of the rules will
provide for Endeavour Energy, acting as a prudent operator with efficient costs, using a
realistic expectation of demand and cost inputs, with the revenue it requires to operate
viably. However, to the extent that a service provider departs from such expenditure
levels, it may be at greater financial risk. Since Endeavour Energy raised this issue as
a concern, we have considered it and the material put forward in support of its
concerns. Endeavour Energy has not been clear about what it means by the term
financial viability. In our analysis we have considered whether Endeavour Energy
18
Oakley Greenwood, Peer review of the willingness to pay research submitted by NSW distribution business, April
2015, p. 12
19
David Newbery, Cambridge Economic Policy Associates: Expert Report, January 2015.
20
S&P, Confidential credit assessment: Endeavour Energy—Stand-alone credit profile, January 2015.
21
UBS, Financeability— Debt issue and capital structure (Confidential version), January 2015
17 Overview | Endeavour Energy Final decision 2015–19would be at material risk of insolvency. We understand this to be consistent with
Endeavour Energy's interpretation of threats to its financial viability. We undertook
analysis using our PTRM to model Endeavour Energy’s cash flows under a number of
different scenarios. We then engaged RSM Bird Cameron to review and provide
comment on our analysis. We are satisfied that Endeavour Energy would not be at
material risk of insolvency because:
Endeavour Energy is subject to a stable regulatory environment that is favourable
for capital raising22
we are not persuaded that the assumptions Endeavour Energy provided to S&P
were reasonable. The conclusions in the stand-alone credit profile prepared by
S&P derive from the assumptions provided by Endeavour Energy.
we are satisfied that our PTRM cash flow analysis and RSM Bird Cameron's review
and comment on our analysis supports this conclusion.
RSM Bird Cameron’s report is attached to this decision. We discuss this report in
greater detail in attachment 20.
1.4 Assessment of options under the NEO
The NER recognises that there may be several decisions that contribute to the
achievement of the NEO. Our role is to make a decision that we are satisfied
contributes to the achievement of the NEO to the greatest degree.23
For at least two reasons, we consider that there will almost always be several
decisions that contribute to the achievement of the NEO. First, the NER requires us to
make forecasts, which are predictions about unknown future circumstances. As a
result, there will likely always be more than one plausible forecast. Second, there is
substantial debate amongst stakeholders about the costs we must forecast, with both
sides often supported by expert opinion. As a result, for several components of our
decision there may be several plausible answers or several point estimates within a
range. This has the potential to create a multitude of potential overall decisions. In this
decision we have approached this from a practical perspective, accepting that it is not
possible to consider every possible permutation specifically. Where there are several
plausible answers, we have selected what we are satisfied is the best outcome, under
the NEL and NER.
In many cases, our approach results in an outcome towards the end of the range of
options materially favourable to Endeavour Energy (for example, our choice of equity
beta). While it can be difficult to quantify the exact revenue impact of these individual
22
For example, RARE infrastructure submitted that "[t]here are many characteristics of the Australian Regulatory
framework that makes its energy network potentially attractive investments" RARE Infrastructure, Letter to the
AER, 13 February 2015.
23
NEL, s. 16(1)(d)
18 Overview | Endeavour Energy Final decision 2015–19decisions, we have identified where we have done so in our attachments. Some of
these decisions include:
selecting at the top of the range for the equity beta
setting the return on debt by reference to data for a BBB broad band credit rating,
when the benchmark is BBB+
the cash flow timing assumptions in the post-tax revenue model
the point at which we have set the benchmark for opex
the allowances we have made for operating environment factors in our
benchmarking analysis
We set out detailed our reasons in the attachments. They demonstrate that the
constituent components of our decision comply with the NER's requirements. At an
overall level our decision reflects the key reasons set out above, which indicate that
Endeavour Energy should recover less revenue than it has proposed or recovered in
recent years. Our decision reflects these at both the constituent component and overall
revenue levels.
Given our approach, we are satisfied that our decision will or is likely to contribute to
the achievement of the NEO to the greatest degree.
1.5 Structure of the overview
The remainder of this overview discusses the overarching issues in this decision,
including those above, in more detail. It is structured as follows:
Section 2 sets out the key constituent components making up our final decision
Section 3 sets out our decision on the classification of services, control
mechanisms and incentive schemes
Section 4 explains our views on the regulatory framework
Section 5 outlines the process we undertook in reaching our final decision
19 Overview | Endeavour Energy Final decision 2015–192 Key elements of the building blocks
The constituent components of our decision include the building blocks we use to
determine the revenue Endeavour Energy may recover from its customers.24
In setting our allowed revenue for Endeavour Energy of $3182.8 million ($ nominal) for
the 2015–19 regulatory control period we:
apply relevant tests under the NER, the assessment methods and tools developed
as part of our Better Regulation guidelines25 (see section 5.1). We also consider
information provided by Endeavour Energy, the Consumer Challenge Panel (CCP),
consultants and stakeholder submissions
consider our overall revenue against section 16 of the NEL, including the
constituent decisions and the interrelationships we discussed in sections 1 and 4.
Figure 3 and Table 2 show our final decision on Endeavour Energy's revenues and the
contribution of each building block.
Figure 3 AER's final decision and Endeavour Energy's proposed annual
building block ($ million, 2013–14)
1200
1000
800
Metering and ANS
$millions Corporate tax
600
real 2013-14
Revenue adjustments
400 Regulatory depreciation
Opex
200
Return on capital
0
Allowed Proposed Draft Revised Final
average average decision proposed decision
2009-14 2014-19 average average average
2014-19 2014-19 2014-19
Source: AER analysis.
24
NER cl.6.3.
25
http://www.aer.gov.au/Better-regulation
20 Overview | Endeavour Energy Final decision 2015–19Table 2 AER's final decision on Endeavour Energy's revenues ($ million,
nominal)
2014–15 2015–16 2016–17 2017–18 2018–19 Total
Return on capital 376.4 397.1 415.7 430.4 444.8 2064.4
Regulatory depreciation 69.3 78.9 89.7 93.8 100.0 431.7
Operating expenditure 244.3 254.1 264.4 275.3 287.3 1325.4
Revenue adjustmentsa 81.8 13.2 27.4 -24.4 0.7 98.7
Corporate tax allowance 36.2 34.7 38.7 38.3 39.5 187.4
Meters, ANS costsb 50.5b n/a n/a n/a n/a 50.5
Annual revenue requirement
(unsmoothed) 858.6 778.0 835.9 813.4 872.2 4158.2
Annual expected revenue
(smoothed) 949.5 804.0 798.5 792.9 787.5 4132.3
X factorc n/ad 17.29% 3.00% 3.00% 3.00% n/a
Source: AER analysis.
(a) Revenue adjustments include efficiency benefit sharing scheme carry-overs and forecast DMIA.
(b) These are the efficient total costs of metering and ancillary network services as determined by the AER. In
the draft decision we included only the net costs of ACS (that is, the total ACS costs less revenues of $9.6
million recovered through separate charges for 2014–15). For the final decision we included the total ACS
costs consistent with Endeavour Energy's revised proposal.
(c) The X factor from 2016–17 to 2018–19 will be revised to reflect the annual return on debt update. Under the
CPI–X framework, the X factor measures the real rate of change in annual expected revenue from one year
to the next. A negative X factor represents a real increase in revenue. Conversely, a positive X factor
represents a real decrease in revenue.
(d) In our transitional decision, we determined the placeholder revenue for 2014–15. In this final decision to
update the 2014–15 revenue for our assessment of efficient costs we determined X factors for the final four
years of the 2014–19 period. This is to adjust Endeavour Energy's total revenue requirement for the
2015–19 regulatory control period for the difference between the placeholder revenue and our decision on
Endeavour Energy's efficient costs for 2014–15.
2.1 The building block approach
We have employed the building block approach to determine Endeavour Energy's
annual revenue requirement. The building block costs, illustrated in Figure 4, include:26
a return on the Regulatory Asset Base (RAB) (return on capital)
depreciation of the RAB (return of capital)
forecast opex
26
NER cl. 6A.5.4
21 Overview | Endeavour Energy Final decision 2015–19 increments or decrements resulting from incentive schemes such as the efficiency
benefit sharing scheme (EBSS)
the estimated cost of corporate income tax.
Our assessment of capex directly affects the size of the RAB and therefore, the
revenue generated from the return on capital and return of capital building blocks.
Figure 4 The building block approach for determining total revenue
Return on capital (forecast RAB × cost
of capital)
Capital costs
Regulatory depreciation (depreciation
net of indexation applied to RAB)
Operating expenditure (opex)
Total
revenue
Efficiency benefit sharing scheme
(EBSS) (increment or decrement)
Corporate income tax (net of value
of imputation credits)
The following section summarises our decision by building block and provides our high
level reasons and analysis. The attachments provide a more detailed explanation of
our analysis and findings.
2.2 Regulatory asset base
The RAB is the value of Endeavour Energy's assets that are used to provide
distribution network services. It is the value on which Endeavour Energy earns a return
on capital, and a depreciation allowance (return of capital) on assets in its RAB.
We are required to assess Endeavour Energy's proposed opening value for the RAB
for each year of the 2015–19 regulatory control period.27
Our final decision is to accept Endeavour Energy's revised proposed opening RAB as
at 1 July 2014 of $5581.3 million ($ nominal). We forecast a closing RAB at 30 June
2019 of $6859.9 million.
27
NER, cll. 6.5.1 and S6.2.
22 Overview | Endeavour Energy Final decision 2015–19The forecast depreciation approach will be used to establish Endeavour Energy's RAB
at the commencement of the following regulatory control period on 1 July 2019.
Table 3 sets out our final decision on the roll forward of Endeavour Energy's RAB
during the 2009–14 regulatory control period.
Table 3 AER's final decision on Endeavour Energy's RAB for the 2009–14
regulatory control period ($ million, nominal)
2009–10 2010–11 2011–12 2012–13 2013–14
Opening RAB 3690.0 3940.3 4342.1 4910.3 5346.0
Capital expenditurea 423.1 509.4 647.9 581.7 542.4
Inflation indexation on opening RAB 67.2 112.1 147.2 86.6 131.0
Less: straight-line depreciation 239.9 219.7 226.8 232.6 231.5
Closing RAB 3940.3 4342.1 4910.3 5346.0 5787.8
Difference between estimated and actual
–116.6
capex (1 July 2008 to 30 June 2009)
Return on difference for 2008–09 capex –71.2
Closing RAB as at 30 June 2014 5600.1
Meters moved to alternative control
–18.8
services
Opening RAB as at 1 July 2014 5581.3
Source: AER analysis.
(a) Net of disposals and capital contributions, and adjusted for CPI.
Table 4 sets out our final decision on the roll forward of Endeavour Energy's forecast
RAB for the 2014–19 period.
Table 4 AER's final decision on Endeavour Energy's RAB for the 2014–19
period ($ million, nominal)
2014–15 2015–16 2016–17 2017–18 2018–19
Opening RAB 5581.3 5944.3 6223.7 6444.0 6658.5
Capital expenditurea 432.3 358.3 310.0 308.2 301.5
Inflation indexation on opening RAB 132.8 141.5 148.1 153.4 158.5
Less: Straight-line depreciation 202.1 220.4 237.8 247.2 258.5
Closing RAB 5944.3 6223.7 6444.1 6658.5 6859.9
Source: AER analysis.
(a) Net of forecast disposals and capital contributions.
23 Overview | Endeavour Energy Final decision 2015–19Our assessment involved:
Rolling forward the opening RAB at 1 July 2009 to determine the closing RAB as at
30 June 2014
Using our final decision on forecasts of depreciation, capex, disposals and inflation
for the 2014–19 period to roll forward Endeavour Energy's forecast RAB for each
year of that period.
Endeavour Energy's revised proposal adopted all our draft decision adjustments to roll
forward the opening RAB from 1 July 2009 to 1 July 2014. The only change Endeavour
Energy made to the draft decision was updating 2013–14 estimated capex with actuals
consistent with the annual reporting information for that year. We accept Endeavour
Energy's revised opening RAB as at 1 July 2014 in our final decision.
As part of this final decision we also forecast the closing RAB value at 30 June 2019
for Endeavour Energy. We forecast Endeavour Energy's closing RAB to be
$6859.9 million ($ nominal). This is lower than forecast by Endeavour Energy and
reflects our adjustments to:
forecast depreciation (attachment 5)
forecast inflation rate(attachment 3).
Details of our final decision on the value of the RAB are set out in attachment 2.
2.3 Rate of return (return on capital)
The return on capital provides a service provider with revenue to service the interest on
its loans and to give a return on equity to shareholders. This building block is
calculated as a product of the rate of return and the value of the RAB.28
The NER sets out that the rate of return must be commensurate with the efficient
financing costs of a benchmark efficient entity with a similar degree of risk as that
which applies to the distributor in respect of the provision of distribution services.29 The
NER refers to this requirement as the allowed rate of return objective.
We have determined an allowed rate of return for 2014–15 of 6.74 per cent (nominal
vanilla30). We have not accepted Endeavour Energy's proposed 8.85 per cent return.31
In accordance with the Guideline, we will update the rate of return annually, consistent
with Endeavour Energy's revised proposal and our approach to the return on debt.32
28
NER, cl. 6.5.2(a).
29
NER, cl. 6.5.2(b)
30
The nominal vanilla rate of return formula combines a post-tax return on equity and pre-tax return on debt, for
consistency with other building blocks.
31
The rate of return that Endeavour Energy included in its proposal is an indicative value. Its proposal includes
provision for the AER to adjust this value based on updated information that was not available when Endeavour
Energy submitted its revised proposal.
32
NER, cl. 6.5.2(i)(2).
24 Overview | Endeavour Energy Final decision 2015–19Accordingly, the rate of return for 2015–16 will be 6.68 per cent. Table 5 sets out the
parameters we have used to determine the rate of return.
Table 5 AER's final decision on Endeavour Energy's rate of return
(nominal)
Endeavour
AER AER
AER Energy’s AER final AER final
transitional final
decision revised decision decision
decision decision
proposal
2009–14 2015–16 2016–19
2014–15 2014–15
Nominal risk
free rate (return 5.82% 4.30% 4.77% 2.55% 2.55% 2.55%
on equity)(a)
Equity risk
premium 6.00% 4.55% 5.38% 4.55% 4.55% 4.55%
MRP 6.00% 6.50% 6.56 6.50% 6.50% 6.50%
Equity beta 1.0 0.7 0.82 0.7 0.7 0.7
Nominal post–
tax return on 11.82% 8.90% 10.15% 7.1% 7.1% 7.1%
equity
Nominal pre–
tax return on Updated
8.82% 7.50% 7.98% 6.51% 6.40%
debt annually(b)
Gearing 60% 60% 60% 60% 60% 60%
Nominal vanilla Updated
WACC 10.02% 8.06% 8.85% 6.74%(c) 6.68%
annually(b)
Forecast
inflation 2.47% 2.50% 2.50% 2.38% 2.38% 2.38%
Source: AER analysis; Endeavour Energy, Revised regulatory proposal, 20 January 2015; AER, Endeavour Energy
Transitional Distribution Determination 2014–15, April 2014; AER, Statement on updates to NSW distribution
determinations following Australian Competition Tribunal decision, November 2009.
(a) Endeavour Energy's risk free rate estimate was calculated using a long-run historical averaging period of
1883 to 2013. AER final decision risk free rate estimate is based on a 20 business day averaging period from 9
February to 6 March 2015.
(b) The allowed return on debt is to be updated annually and the nominal vanilla WACC will be updated
annually to reflect the allowed return on debt. The allowed return on debt for 2015–16 has already been estimated.
Return on debt allowances for subsequent years will be estimated based on the formula set out in the Return on Debt
Appendix to this attachment.
(c) This rate of return estimate will be used to update the revenues we previously determined for the 2014–15
(transitional) regulatory year.
25 Overview | Endeavour Energy Final decision 2015–19Our approach
All NER requirements relating to the rate of return are subject to the overall rate of
return achieving the allowed rate of return objective,33 which applies to the overall rate
of return. The NER recognises that there may be several plausible answers that could
achieve the allowed rate of return objective.34 We agree with stakeholders that
predictability of outcomes in rate of return issues could materially benefit the long term
interest of consumers.35
We developed our approach prior to the submission of this regulatory proposal. As
required by the rate of return framework, in December 2013, we published the
Guideline.36 The Guideline was designed through extensive consultation and included
effective and inclusive consumer participation.37
Return on debt
Previously, we used an on-the-day approach to determine the return on debt.38 This is
the approach that several Australian regulators continue to use. However, for this
decision, we have determined a return on debt estimate that gradually transitions from
an on-the-day approach to a trailing average approach.39 This is consistent with the
views most stakeholders expressed during the Guideline development process. We
note that Endeavour Energy, supported by some other distributors, did not agree on
the transition to the trailing average approach.
Endeavour Energy proposed that we use a backwards looking approach to move from
the on-the-day approach to the trailing average approach. This involved using data
from the last ten years to set the return on debt for the 2015-19 regulatory control
period. We disagree. Instead we have determined a gradual, forward looking transition
to a trailing average.40
33
NER, cl. 6.5.2(b).
34
AEMC, Rule determination: National electricity amendment (Economic regulation of network service providers)
Rule 2012: National gas amendment (Price and revenue regulation of gas services) Rule 2012, 29 November
2012, p. 67 (AEMC, Final rule change determination, November 2012); AEMC, Final rule change determination,
November 2012, p. iv, AEMC, Final rule change determination, November 2012, p. 38; The High Court of NZ
stated: 'In determining WACC, precision is therefore an elusive and perhaps non-existent quality. Setting WACC is,
we suggest, more of an art than a science. The use of WACC, in conjunction with RAB values, to set prices and
revenue in price-quality regulation gives significance to WACC estimates that may not exist outside this context.'
Wellington International Airport Ltd & Others v Commerce Commission [2013] NZHC 3289, para. 1189.
35
ENA, Response to the Draft Rate of Return Guideline of the AER, 11 October 2013, p. 1; AER, Better regulation:
Explanatory statement rate of return Guideline, Appendices, December 2013, Appendix I, Table I.4, pp.185–186.
36
NER, cl. 6.5.2(m).
37
http://www.aer.gov.au/node/18859
38
This involved determining the return on debt by reference to the return on BBB+ rated bonds over a 10-40
business day averaging period that occurred as close as practicable to the start of the regulatory control period.
39
In broad terms, this means that, over the longer term, the return on debt for any year will represent the average
return on debt over the previous ten years.
40
For 2015-16, this involves 100 per cent of the return on debt reflecting the return on BBB+ rated bonds over a 10-
40 business day averaging period that occurred as close as practicable to the start of the 2015-16 regulatory year.
26 Overview | Endeavour Energy Final decision 2015–19You can also read