Financial Analysis: Sleep Number Corporation - Minnesota ...
←
→
Page content transcription
If your browser does not render page correctly, please read the page content below
Minnesota State University Moorhead
                                                                                                                                                   Red
Dissertations, Theses, and Projects                                                                                                   Graduate Studies

Spring 5-17-2019

Financial Analysis: Sleep Number Corporation
Trevor Brandner
trevor.brandner@go.mnstate.edu

Follow this and additional works at: https://red.mnstate.edu/thesis
     Part of the Accounting Commons

Recommended Citation
Brandner, Trevor, "Financial Analysis: Sleep Number Corporation" (2019). Dissertations, Theses, and Projects. 214.
https://red.mnstate.edu/thesis/214

This Project (696 or 796 registration) is brought to you for free and open access by the Graduate Studies at Red. It has been accepted for inclusion in
Dissertations, Theses, and Projects by an authorized administrator of Red. For more information, please contact kramer@mnstate.edu.
Sleep Number Corporation (SNBR) MSUM Paseka School of Business 03/29/2019
Sleep Number Corporation
SNBR / NASDAQ
Initiating Coverage:
Investment Rating: HOLD
PRICE: USD 47.00 S&P 500: 2,834.40 DIJA: 25,928.68 RUSSELL 2000: 1,539.74
Sleep Number was formerly known as Select Comfort Corporation changing its name in
2017 to Sleep Number Corporation and changed its ticker symbol to SNBR.
As of March 4, 2019, Sleep Number operates 580 stores in all 50 states.
Sleep Number ranted #1 in J.D Power’s 2018 Mattress Satisfaction Report.
Sleep Number entered into a multi-year partnership with NFL as the Official Sleep +
Wellness Partner.
In 2017, Sleep Number introduced the Sleep Number 360 smart bed and bases Corporation
with SleepIQ technology to replace the current line-up.
Valuation 2018 A 2019 E 2020 E
EPS 1.87 1.97 1.70
P/E 24.48 25.22 32.91
P/CFPS 12.92 11.96 13.94
P/BVPS 12.26 N/A 470.94
EV/EBITDA 10.57 11.83 13.80
Market and Trading Information
Equity Market Cap (USD): 1.435 Billion 52-Week Range (USD): 26.22 – 49.20
Enterprise Value (USD): 1.63 Billion 12-Month Stock Return: 33.71%
Shares Outstanding (M): 30.86 Dividend / Capital Gain Yields 0%/33.71%
Estimated Float (M): 29.68 12-Month Russell 2000 Return: 3.12%
3-mo Avg. Daily Volume (K): 643.82 Beta: 1.14
Company Quick View:
Location: 1001 Third Avenue South, Minneapolis, MN 55404
Industry: Sleep Number Corporation, SIC: 2515, NAICS 33791
Description: The Sleep Number Corporation markets mattress and bedroom accessory sales
throughout the United States and its international consumer base. The Sleep Number Corporation
creates, distributes, and maintains mattresses, mattress frames, bases, and bedroom accessories. FlexFit, a
subsidiary of Sleep Number, also offers adjustable bases along with sheets, pillows, and box springs. Sleep Number
uses multiple channels of communication in order to increase revenue including retail, phone, and wholesale
marketing.
Key Products & Services: Sleep Number Mattress, SleepIQ Technology, Sleep Number 360 Mattress product line.
Website: http://www.sleepnumber.com
Analyst: Trevor A. Brandner
P a g e 1 | 21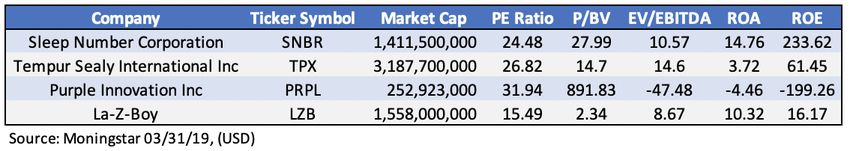
Sleep Number Corporation (SNBR)        MSUM Paseka School of Business                     03/29/2019

STOCK PRICE PERFORMANCE

5-year Stock Price Performance: Marketwatch.com

        Sleep Number Corporation (SNBR) closed on the NASDAQ at USD 47.00 per share on
March 29th, 2019. Since the beginning of 2019 Sleep Number has been trending upward
primarily due to its fourth-quarter earnings report coming in above analysts’ expectation.
Currently the total year to date return (YTD) for Sleep Number’s stock is 48.12 percent, slightly
above its competitor Tempur-Sealy (TPX) which is 39.30 percent YTD. Sleep Number
significantly outperforms against competitor Tempur-Sealy when looking at the five-year total
stock price return of 159.96 percent for SNBR versus 2.62 percent for TPX. However, for both
companies the 52-week stock price ranges between similar percentages, SNBR ranges between
26.22 – 49.20 and TPX ranges between 38.90 – 59.73. The benchmark for small-cap companies
is the Russell 2000 index which has a YTD of only 14.64 percent and a five-year average of 7.10
percent. According to the data, Sleep Number YTD has been outperforming both its main
competitor Tempur-Sealy and the Russell 2000. One major reason for Sleep Numbers rising
stock price has been due to an increase in the company’s earnings estimates and rating upgrade
from several analysts.

INVESTMENT DECISION SUMMARY
        Sleep Number is an international and multi-billion-dollar company providing luxury
goods in a highly competitive industry. Using a corporate valuation model that discounts free
cash flows at the average cost of funding (WACC), I have forecasted an intrinsic value of USD
45.16 per share for Sleep Number on March 29, 2019. With current economic conditions, Sleep
Number has room to grow sales; however, SNBR’s high cost of sales, low cash, and recent take
on debt raises some concerns that the company needs to address. After analyzing and forecasting
Sleep Number, I conclude that Sleep Number’s intrinsic price per share is similar to the market
price and therefore I issue a Hold recommendation for the stock.

                                                                                    P a g e 2 | 21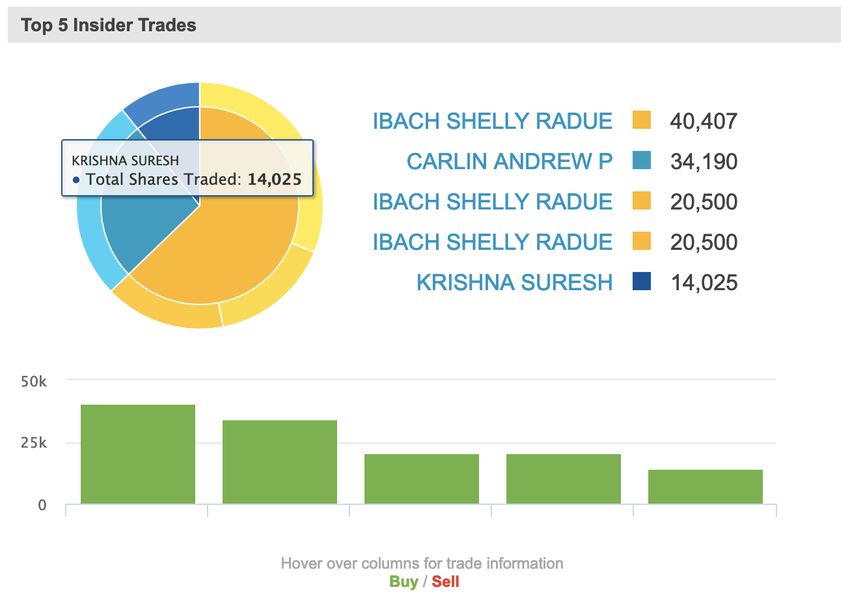
Sleep Number Corporation (SNBR)    MSUM Paseka School of Business                         03/29/2019

COMPANY DESCRIPTION
        Sleep Number was founded in 1987 by Bob and JoAnn Walker in Minneapolis,
Minnesota after Mr. Walker left Comfortair Corporation of South Carolina. In January 2013
Select Comfort (Sleep Number) acquired major competitor Comfortair Corporation. Upon
becoming Sleep Number, the Walkers originally named their company Select Comfort before
changing the name in November 2017. In 1998 Sleep number became a publicly traded company
being listed on the NASDAQ with ticker symbol SNBR. In addition to Sleep Number’s
headquarters and 569 stand-alone stores, the company also has its own manufacturing and
distribution facilities in South Carolina and Utah that produce its mattresses and bedding
accessories. The company’s store structure has since changed drastically from its first kiosk in
the Roseville, MN mall to Sleep Number operating 569 Sleep Number retail stores in all 50
states, with its headquarters located in Minneapolis, Minnesota.

        With the types of products Sleep Number manufactures and retails, Sleep Number has
been classified under the Consumer Cyclical: Retail – Furniture & Home Furnishing sector on
the NASDAQ Exchange. In addition to mattresses, Sleep Number also designs, markets and
manufactures service beds, foundations, and bedding accessories such as mattress pads, pillows,
sheets and box springs under their FlexFit and Sleep Number brands. The company manufactures
and retails eight different Sleep Number beds across all sizes. Aside from the company’s Sleep
Number model, Select Number also manufactures a specialties series, which includes
recreational vehicle mattresses, Waterbed Replacement Series, The Grand King and The
Expanded Olympic Queen.

        Unlike traditional mattress companies, Sleep Number targets their customers directly,
resulting in direct sales of 99% of total sales. Select Comfort products are sold either through
their owned Sleep Number stores located throughout all 50 states or selected wholesale partners.
Select Comfort’s partnerships range from QVC Shopping network as well as partnerships in
Canada, Australia and a few hospitality operations. Sleep Number prices its products at a level
that indicates that their target clients are mid to high-end customers.

        Sleep Number’s manufacturing and distribution process consists of in-house
manufacturing and a direct sales model. Sleep Number manufactures in the company’s two U.S.
based production facilities located in Irmo, South Carolina and Salt Lake City, Utah. At both
South Carolina and Utah’s manufacturing facilities, employees quilt and sew the fabric covers
for the Sleep Number beds, and the final assembly and packaging of all mattresses and bases.
Aside from the two manufacturing facilities, Sleep Number also operates a facility in Greenville,
South Carolina solely for producing their Comfortair mattress brand which is slowly being
phased out. Once a customer purchases a product from Sleep Number, the company offers a
Comfort Service home delivery and setup through selected markets. As far as warranty and

                                                                                    P a g e 3 | 21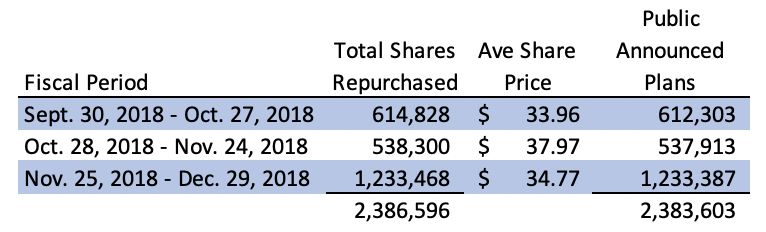
Sleep Number Corporation (SNBR)     MSUM Paseka School of Business                         03/29/2019

service issues, Sleep Number maintains an in-house customer service department ranging from a
call service to direct service technicians.
        Sleep Number has a strategy that takes an approach to keep the company competitive
against both its brick-and-mortar and digital competitors. The company’s numerous stores
throughout the country allow Sleep Number to bring their products and technology to life for
customers to see, touch, and experience. Another strategy Sleep Number is trying to take
advantage of is furthering its partnerships with several organizations to expand its customer base.
Over the past several years, Sleep Number has gone through several short-term and long-term
milestones ranging from hiring a new executive team in 2014 (CMO, CFO, CHCO) to a
completely new senior team in 2016 (New Ops and Lean Officer). In order to stay up-to-date and
competitive, the company rolled out a product innovation strategy in 2013. Over the years this
resulted in Sleep Number investing in BAM Labs (SleepIQ) in 2013, acquiring the company in
2015, and implementing the technology to the Sleep Number 360 Smart Beds.

        As Sleep Number is experiencing disruptions in the mattress industry, the company is
taking several steps to position itself to remain an aggressive competitor. Sleep Number has
several competitors ranging from brick and mortar to a vastly growing online market that the
company competes against for its Sleep Number mattress line. A few brick and mortar
competitors of Sleep Number are Mattress Firm, Tempur-Pedic, Serta, Sealy, and Denver. As the
digital era takes over, Sleep Number has to compete against several mattress companies by bed
in a box online services such as Cocoon (Sealy), Casper, Turf and Needle and Purple. Since
Sleep Number’s primary strategy is mattresses, the company has an estimated 8% of the mattress
market share.

MANAGEMENT AND CORPORATE GOVERNANCE
The key top executives of Sleep Number Corporation are as follows:
            Kevin K. Brown – Senior VP & Chief Marketing Officer
               o Compensation USD 1.51M & Education: BBA in Finance, Univ. of Texas
               o Past Experience: Senior VP, Marketing for Jo-Ann Stores in and partner of
                   Accenture.
            Shelly Radue Ibach – President, Chief Executive Office & Director
               o Compensation USD 3.02M & Education: B.S. in Retailing, Univ. of
                   Wisconsin
               o Past Experience: Former Senior VP and General Merchandise Manager of
                   Macy’s home division.
            Suresh Krishna – Chief Operations & Supply Chain Officer & Senior VP
               o Compensation N/A & Education: MBA, Northwestern Univ.
               o Past Experience: VP and Business Unit Head of EU, Middle East, and Africa
                   for Polaris.

                                                                                     P a g e 4 | 21
Sleep Number Corporation (SNBR)      MSUM Paseka School of Business                     03/29/2019

            David R. Callen – Senior VP & Chief Financial Officer
                o Compensation USD 751k & Education: B.A. in Accounting, Michigan State
                    Univ.
                o Past Experience: Principal Financial Officer, VP, Finance Treasurer for Ethan
                    Allen Interiors, Incorporated.
            Andrew P. Carlin – Executive VP, Chief Sales & Service Officer
                o Compensation UDS 818k & Education: BBA in Finance, Univ. of Wisconsin
                o Past Experience: Regional VP of Gander Mountain’s Western stores and
                    Senior VP of Operation.
            Mark A. Kimball – Senior VP & Secretary, Chief Legal & Risk Officer
                o Compensation USD 925k & Education: N/A
                o Past Experience: Partner at law firm Oppenheimer Wolff & Donnelly LLP
                    practicing in the area of corporate finance.
            Ernest Park – Senior VP & Chief Information Officer
                o Compensation USD 608k & Education: N/A
                o Past Experience: Senior VP and Chief Information Officer for Maytag Corp.
            Andrea L. Bloomquist – Senior VP & Chief Product Officer
                o Compensation USD 818k & Education: B.A, St Olaf College
                o Past Experience: Leadership positions in product merchandising at Macy’s,
                    Marshall Field’s, and Target Corporation.
            Patricia Dirks – Senior VP & Chief Human Capital Officer
                o Compensation USD 1.23M & Education: B.S in Elementary Ed, Iowa State
                    Univ.
                o Past Experience: Senior VP of Organizational Effectiveness for Target
                    Corporation.
        *Source: Mergent Online & SNBR 2018 Proxy Statement & Annual Report

        To incentivize Sleep Number’s management team, the Board of Directors have
established a long-term equity incentive program. The program includes a mix of stock options
and performance share awards with performance targets and payout amounts depending on the
company’s achievement goals and share performance. The Board of Directors also established an
annual cash short term incentive program that links annual cash awards to yearly achievements
in key financial, strategic, and operational segments. In conjunction with a short-term program,
the board created a long-term program that offers compensation through cash/options that is tied
to Sleep Number’s growth in revenue, net profit, and return on invested capital. Both programs
set by the Board of Directors are designed to motivate the management team to become
competitive in comparison with Sleep Numbers industry/specialty peers.
      The Board of Sleep Number, overseen by Chairman Mr. Valette, maintains three separate
committees: an Audit Committee (Chair of Board Mr. Gulis Jr.), a Management Development
and Compensation Committee (Chair Ms. Lauderback), and a Corporate Governance and
Nominating Committee (Chair Mr. Peel). As each committee establishes a set of guidelines, the

                                                                                  P a g e 5 | 21
Sleep Number Corporation (SNBR) MSUM Paseka School of Business 03/29/2019
Management Development and Compensation Committee establishes procedures for setting
annual and long-term performance goals. Sleep Number Corporation’s Board of Directors and its
Committees act as independent directors defined by the Securities and Exchange Commission
are as follows below. All directors and executive officers as a group own 4.3% (1,660,076) of
Sleep Number’s Common Stock.
Management Corporate
Development & Governance &
Audit Compensation Nominating
Director Committee Committee Committee
Daniel I. Algre X
Stephen L. Gulis, Jr. Chair X
Michael J. Harrison X X
Brenda J. Lauderback X Chair
Barbara R. Matas X
Kathleen L. Nedorostek X X
Vicki A. O'Meara X
Michael A. Peel X Chair
Jean-Michel Valette*
*SNBR Non-Exec. Chairman of the Board
Source: SNBR 2018 Proxy Statement & Annual Report
Sleep Number Corporations ISS Governance Quality Score
February 1st, 2019
Total Score 3
Audit 1
Board of Governors 1
Shareholder Rights 5
Compensation 5
P a g e 6 | 21Sleep Number Corporation (SNBR) MSUM Paseka School of Business 03/29/2019
*Corporate governance scores are provided by Institutional Shareholder Services (ISS). Scores
indicate decile rank relative to index or region. A decile score of 1 indicates lower governance
risk, while a 10 indicated higher governance risk.
Source: Yahoo Finance
SHAREHOLDER ANALYSIS
According to the NASDAQ, as of March 22, 2019 Sleep Number had 217 shareholders
consisting of 34,632,156 shared held and is listed on the NASDAQ as SNBR. All holders of
SNBR are institutional holders, consisting of 113.47% of all holdings.
Source: Nasdaq.com
The top five major institutional holders on Sleep Number are: Blackrock Inc, Disciplined
Growth Investors Inc/MN, Vanguard Group Inc, Vulcan Value Partners LLC, and Dimensional
Fund Advisors LP.
P a g e 7 | 21Sleep Number Corporation (SNBR) MSUM Paseka School of Business 03/29/2019
Source: Nasdaq.com
According to NASDAQ, the top five insider trades for Sleep Number are Shelly Radue
Ibach (President), Andrew P. Carlin (Executive Vice President), and Suresh Krishna (Chief
Operating Officer).
Source: Nasdaq.com
Over the course of 2018, Sleep Number completed three share repurchase programs
during the company’s fiscal 2018 fourth quarter.
P a g e 8 | 21Sleep Number Corporation (SNBR) MSUM Paseka School of Business 03/29/2019
Sleep Number 2018 Share Repurchase Program
Source: Sleep Number 2019 10k
INDUSTRY ANALYSIS
Sleep Number Corporation operates in the consumer durables industry under the
NASDAQ exchange with SIC code 2510 and NAICS 321/327. According to the industry
classification, Sleep Number Corp. is classified as a mature company due to its operating history,
comparable competitors and more assets in place than opportunities to grow. Even though the
mattress industry is stable, start-ups have found a niche with millennials desire for mail-order
beds that has been rapidly growing.
“Sleep Number delivers proven quality sleep through effortless, adjustable comfort, and
biometric sleep tracking” (Sleep Number 2018 10k, page 3). Sleep number designs,
manufactures, markets, retails, and services their Sleep Number products domestically and
internationally. Sleep Number targets consumers that desire high-quality individualized mattress
products and services through their direct-to-consumer strategy. To complement their strategy,
Sleep Number is available through the company’s Sleep Number stores, online company store
website, and via phone.
While Sleep Number’s product line is small, the company’s potential customer base for
growth is enormous. However, with recent mail order mattress start-ups changing the way the
industry functions, Sleep Number has had to adapt the way the company targets consumers.
According to the International Sleep Products Associations (ISPA), the industry has grown
approximately 4% annually over the last 20 years. Sleep Number is of the understanding that the
industry growth is primarily the result of population growth, increase in number of homes
consumers own, and increase in size of homes (SNBR 2018 10k, page 7). Sleep Number has
seen a trend in mattress sales shift to both larger and higher-quality beds, which tend to result in
a higher expense. The International Sleep Product Association has estimated that the shipments
of mattresses were approximately USD 8.2 billion in 2018 compared to USD 8.4 billion in 2017.
However, industry trade publication “Furniture/Today” ranks Sleep Number as the second
largest U.S. mattress retailer with 8% market share of the industry revenue and fifth largest
mattress manufacturer (SNBR 2018 10k, page 7).
P a g e 9 | 21Sleep Number Corporation (SNBR) MSUM Paseka School of Business 03/29/2019
Even though the retail bedding industry is classified as a mature industry, mattress
companies often find the industry fragmented and highly competitive. Sleep Number stands out
by being able to compete with national and local specialty stores with the company’s controlled
distribution channel. Manufacturing companies compete on price, quality, brand recognition,
product availability, and product performance. As traditional mattresses are replaced by start-ups
memory foam usage, national companies have incorporated the use of innerspring, memory foam
and “hybrid” mattresses into their product lines to create a nationally recognized brand name. As
“bed-in-a-box” start-ups have come about, the industry has seen roughly 200 direct-to-consumer
companies, competing primarily on convenience and delivery speed enter in to the market.
INVESTMENT RISK
The success of Sleep Number Corporation depends significantly upon discretionary
consumer spending, which is highly influenced by a number of economic factors, consumer
confidence, housing market, employment and income levels, interest rates, inflation, taxation,
and consumer spending trends as SNBR’s beds are classified as a luxary. Changing trends in the
economic factors affects Sleep Number’s sales, profitability, cash flows, and financial condition.
One of the ways Sleep Number combats against economic risk is their high dependency on the
company’s marketing and advertising departments to generate consumer awareness for products.
As consumers are increasingly using digital platforms to shop, Sleep Number’s growth and
profitability depends highly on the effectiveness and efficiency of the company’s online store.
A majority of Sleep Number’s sales occur through the company’s “Company-Controlled
distribution channels” which is made up of Sleep Number retail stores and website. Sleep
Number describes the Company-Controlled distribution channels as the largest opportunity for
growth in sales and improvement in profitability. As most of Sleep Number’s retail stores are
mall-based, the company depends heavily on the popularity of shopping centers and anchor
stores to generate customer traffic. Sleep Number states that any decrease in mall traffic could
adversely affect sales, profitability, cash flows, and financial condition.
As Sleep Number’s mattresses are highly different from traditional innerspring and foam
mattresses with electronics and an air control system, Sleep Number relies heavily on the
mattress to achieve a high level of quality. Using electronics and an air control system, Sleep
Number mattresses have the opportunity to be susceptible to failure that traditional mattresses
are not, resulting in a need to maintain high quality standards or risk losing sales.
Even though Sleep Number has manufacturing facilities in the United States, the
company’s air chambers and other components are manufactured outside of the States resulting
in being subjected to risks associated with sourcing in foreign countries. Sleep Number has
stated the risks associated with foreign sourcing are: existing or potential duties/tariffs, political
instability, disruptions in transportation due to acts of terrorism/shipping factors, foreign
currency fluctuations, and economic uncertainties such as inflation (Sleep Number 2019 10-k).
P a g e 10 | 21Sleep Number Corporation (SNBR) MSUM Paseka School of Business 03/29/2019
PEER ANALYSIS
The competitor companies in the same sector of Sleep Number Corps. (SNBR) are
Tempur Sealy International Inc. (TPX), Purple Innovation Inc. (PRPL), and La-Z-Boy
Incorporated. Sleep Number, La-Z-Boy Incorporated, and Purple Innovation Inc. all have the
same SIC code 5712 and NAICS code 442110 (furniture stores), while Tempur Sealy
International Inc. SIC code is 2392 (House Furnishing) and NAICS code is 314120 (Curtain and
Linen Mills). Both Tempur Sealy and Purple Innovation’s main product line consists primarily of
mattress sales, while La-Z-Boy’s consists of household furniture. However, the difference
between SNBR, TPX, and PRPL are the company’s mattresses and selling styles. Sleep
Number’s mattresses are made containing an air chamber design, while Purple Innovation uses
memory foam and their patinated design gel selling their products by internet order, as Tempur
Sealy focuses on both traditional and memory foam mattresses being sold in local furniture
retailers and online.
Tempur Sealy International Inc. located in Lexington, Kentucky, contains several
subsidiary mattress companies that all develop, manufacture, market, and distribute mattresses.
Tempur Sealy is split into two segments consisting of North America and International divisions.
Tempur Sealy offers mattresses and accessories under all the company’s brands consisting of
Tempur, Tempur-Pedic, Sealy, Stearns & Foster and Cocoon. All but Tempur Sealy’s Cocoon
brand are sold in traditional furniture stores for the reason to compete with online mattress
startup companies. The company also operates 25 Tempur-Pedic retail stores, the primary
competition for Sleep Number Inc.’s mattresses.
Purple Innovation Inc. located in Alpine, Utah, debuted on the stock market when the
company reverse merged with a publicly traded investment Global Partner Acquisition Corp. in
2017 for USD 1.1 Billion. Purple Innovation both designs and manufactures mattresses, pillows
and cushions. Purple Innovation was one of the first direct-to-consumer mattress startup
companies that shook up how mattress markets in 2010 by delivery through mail.
La-Z-Boy Incorporated was founded in 1927 and is located in Monroe, Michigan. The
company however was formally known as La-Z-Boy Chair Company until changing to its
current name in 1996. Unlike Sleep Number Inc, Tempur Sealy, and Purple Innovation, La-Z-
Boy manufactures, markets, imports, exports and distributes retail upholstery furniture to North
America and internationally rather than mattresses. La-Z-Boy markets and sells its products
directly to a La-Z-Boy Furniture Galleries stores, Comfort Studio stores, Custom Comfort Center
stores, and independent furniture retailers. The company operates a network of 535 Comfort
Studio locations and 350 La-Z-Boy Furniture Galleries.
P a g e 11 | 21Sleep Number Corporation (SNBR) MSUM Paseka School of Business 03/29/2019
HISTORICAL FINANCIAL ANALYSIS
One of Sleep Number’s major competitors is Tempur-Sealy. A major difference between
Sleep Number and Tempur-Sealy is how both companies handle debt; Sleep Number has
historically avoided taking on long-term debt while Tempur-Sealy uses debt to finance growth
and operations. This can be seen in both SNBR and TPX’s leverage ratios. The biggest
difference between Sleep Number and Tempur-Sealy is the debt-to-equity ratio. Sleep Number
has a -5.29 for 2018 this could arise from SNBR taking on a large sum of short-term debt. Sleep
Number’s stock repurchase program that caused 2018 retained earnings to become negative,
while ranging between 4.26 and .80 from 2017 to 2014. Even though Tempur-Sealy does not
have a steady debt-to-equity ratio, TPX never fluctuates more than 1.32 for five years.
Even though Sleep Number does not take on long-term debt, SNBR has a higher ability
to cover the interest on all debt at 15.64 times. Since taking on debt, previous years’ numbers are
in the hundreds due to practically no debt. Tempur-Sealy has average 10.87 for all five years for
the interest coverage ratio. One of the major areas that shows Sleep Number is starting to move
to taking on more debt to finance operations is the debt-to-asset ratio. Since 2014, Sleep
Number’s debt-to-asset ratio has been steadily on the rise until 2018 when it rose from 0.81 to
1.23, the year SNBR borrowed from its revolving credit. From 2016 to 2018, Sleep Number
went through a stock repurchase program, repurchasing 20,006,000 shares causing retained
earnings to have a negative balance at year-end 2018. Tempur-Sealy, however, has had the
opposite effect where TPX’s debt-to-asset ratio has been declining since 2014.
Financial Risk (Leverage) Ratios 12/31/18 12/30/17 12/31/16 12/31/15 12/31/14
SNBR Total debt-to-equity ratio -5.29 4.26 1.82 1.24 0.80
TPX Total debt-to-equity ratio 0.64 0.85 1.24 1.34 2.52
SNBR Interest coverage ratio (accounting-
15.64 94.27 94.51 469.35 1919.74
based)
TPX Interest coverage ratio (accounting-based) 10.42 9.31 13.20 10.47 10.93
SNBR Total debt-to-assets ratio 1.23 0.81 0.65 0.55 0.44
P a g e 12 | 21Sleep Number Corporation (SNBR) MSUM Paseka School of Business 03/29/2019
TPX Total debt-to-assets ratio 0.39 0.46 0.55 0.57 0.72
Sleep Number’s productivity ratios offer an insight to how the company is growing,
collecting receivables, replacing inventory, and amount of revenue generated. In the mattress
industry, there are several competitors and because industry growth is very low, in order for one
company to grow faster than the industry average, another company’s growth will fall. Looking
at Sleep Number and Tempur-Sealy’s growth in sales throughout the trailing five years, Sleep
Number has ranged from a low of 4.92% to a high of 20.47% where Tempur-Sealy shrunk in all
years except 2015. This could derive from economic factors as when the economy picks up
consumer spending tends to focus around higher premium purchases.
In handling collecting on receivables, Sleep Number turned over its receivables 61.77
times on average in 2018, which is near the average of 60.74 for all five years. This means an
average collection period of 16.92 days during 2018. In comparison to Sleep Number, Tempur-
Sealy only turned over its receivables 8.41 times a year or around 2 times per quarter for 2018.
With Sleep Number being a more premium product with a limited selection, the inventory on
hand tends to be less significant than Tempur-Sealy. However, both companies are in line with
each other for how often inventory is turned over averaging 17.66 SNBR and 14.60 TPX. A
major difference between the companies is operating working capital; Tempur-Sealy has
averaged 16.92 for all five years in being able to cover its liabilities with assets where Sleep
Number has run double-digit negatives. This could be a result of several issues ranging from its
vendors extending credit terms, annual lease terms, or the amount of capital Sleep Number has in
daily operations.
Productivity Ratios 12/31/18 12/30/17 12/31/16 12/31/15 12/31/14
SNBR Growth in sales 6.03% 10.16% 8.04% 4.92% 20.47%
TPX Growth in sales -1.87% -11.92% -0.76% 5.40% #DIV/0!
SNBR Receivables turnover 61.77 74.80 66.55 41.85 58.74
TPX Receivables turnover 8.41 8.86 9.06 8.31 7.75
SNBR Inventory turnover 18.04 17.14 17.48 14.02 21.61
TPX Inventory turnover 12.16 15.38 15.89 15.82 13.77
SNBR Operating working capital turnover -11.08 -11.16 -15.07 -24.71 -35.21
TPX Operating working capital turnover 14.73 30.64 15.93 11.35 11.94
Over the years, Sleep Number has been diminishing cash in to its operations and growth.
Looking at Sleep Number’s current ratio over the past five years shows that the company is
P a g e 13 | 21Sleep Number Corporation (SNBR) MSUM Paseka School of Business 03/29/2019
decreasing at an average -.22 percent per year in cash reserves, this could be a result from Sleep
Number’s stock repurchase plan. However, looking at Tempur-Sealy’s current ratio, the
company maintains a cash ratio above one, indicating a high ability to pay short-term debt. In
comparison with current ratio, both Sleep Number and Tempur-Sealy rank lower than one on the
quick ratio. Tempur-Sealy averages 0.86 over the five years while Sleep Number has
significantly decreased from 0.91 in 2014 to 0.14 in 2018, indicating potential short-term debt
obligation struggles. One area Sleep Number strives in is operating cycle, which has averaged
27.31 days to return cash from operations where Tempur-Sealy averages 68.45.
Liquidity Ratios 12/31/18 12/30/17 12/31/16 12/31/15 12/31/14
SNBR Current ratio 0.31 0.50 0.61 0.81 1.20
TPX Current ratio 1.20 1.05 1.23 1.13 1.34
SNBR Quick ratio 0.14 0.22 0.28 0.43 0.91
TPX Quick ratio 0.87 0.74 0.87 0.86 0.94
SNBR Cash ratio 0.00 0.01 0.05 0.12 0.65
TPX Cash ratio 0.07 0.09 0.12 0.22 0.12
SNBR Operating Cycle 26.14 26.18 26.37 34.77 23.11
TPX Operating Cycle 73.43 64.92 63.25 67.02 73.62
Looking at Sleep Number and Tempur-Sealy’s profitability/valuation ratios, Sleep
Number has higher profitability according to return on assets (ROA) and return on invested
capital (ROIC), while Tempur-Sealy ranks higher in gross profit margin and NOPAT margin.
During all five years, Sleep Number has ranged between 64.63% and 66.36% gross profit margin
while Tempur-Sealy ranged from 83.83% to 73.62%. Following gross profit margin, Tempur
Sealy also averaged a higher NOPAT margin than Sleep Number ranging in the 30% margin
while Sleep Number ranked in single digits. However, since 2017, Sleep Number gained a slight
advantage with return on assets and double in ROIC, signaling Sleep Number is more effective
with using stakeholder funds to generate income.
Profitability/Valuation Ratios 12/31/18 12/30/17 12/31/16 12/31/15 12/31/14
SNBR Gross profit margin 64.63% 66.36% 66.14% 64.96% 64.55%
TPX Gross profit margin 83.78% 83.83% 78.47% 73.62% 75.01%
SNBR NOPAT margin 5.34% 4.69% 3.83% 4.90% 5.83%
P a g e 14 | 21Sleep Number Corporation (SNBR) MSUM Paseka School of Business 03/29/2019
TPX NOPAT margin 32.79% 31.83% 31.10% 25.64% 36.85%
SNBR Return on Assets 19.66% 19.59% 16.94% 15.08% 22.02%
TPX Return on Assets 15.22% 18.05% 23.20% 24.62% 30.02%
SNBR ROIC 43.63% 29.82% 19.50% 36.97% 46.19%
TPX ROIC 17.54% 20.04% 27.34% 28.10% #DIV/0!
PROSPECTIVE FINANCIAL ANALYSIS
As Sleep Number recently unveiled a new product line and with international sales
growth in Canada, Puerto Rico, and The US Virgin Islands, Sleep Number estimates year-over-
year sales growth of 6 percent according to SNBR’s 2018 10-K. In accordance with Sleep
Number’s sales growth estimate, I have used 6 percent in predicting Sleep Numbers growth in
sales. Even though 6 percent is aggressive, the United States economy continues to perform well,
consumers have shown their spending habits to be aggressive. Introducing a new product line, I
have forecasted Sleep Number’s cost of sales to continue to rise into next year and topping out in
2020 before decreasing and stabilizing as the technology becomes more available. However, how
long the economy can sustain its current growing pattern is a primary risk factor for Sleep
Number as the company’s products are high end and consumers could switch to a cheaper
solution. In relation to long-term debt, I have estimated Sleep Number to stick to history and
forgo taking on any long-term debt. I forecast Sleep Number to continue to use short-term debt
as a method to finance operations as under the 10-k short-term debt consists of lease obligations.
Performing a sensitivity analysis for Sleep Number shows how sensitive Sleep Number is to
fluctuations in sales growth and beta.
*Green: Undervalued, Orange: Hold, Red: Overvalued
*N/A WACC is less than Sales Growth
P a g e 15 | 21Sleep Number Corporation (SNBR) MSUM Paseka School of Business 03/29/2019
Given the prediction for Sleep Numbers international growth and increase in sales, Sleep
Number’s estimated stock price for March 31, 2019 is USD 45.16. At the end of March 29, 2019,
the close price on the NASDAQ for Sleep Number is USD 47.00, a difference of USD 1.84. For
the upcoming two years, I have estimated Net Operating Profit after Tax to decrease before
stabilizing and rising due to an increase in cost of goods sold as Sleep Number’s 360 technology
becomes more available. The decrease in NOPAT from 2018 to 2019 will be a net change of
USD -15,937K (-19.5%) and from 2019 to 2020 USD -4,451K (-6.80%). Following the decrease
in NOPAT, overall Net Income for Sleep Number will decrease from USD 69,539K in 2018 to
USD 60,717K in 2019 and finally to USD 52,502K in 2020 before going back up to USD
70,464m in 2021. Historically, Sleep Number is accustomed to drastic fluctuations in Net
Income, so the estimation of a decrease is not alarming. Although Sleep Number does not state
the actual WACC, SNBR mentions in the 10-k that WACC as a “high-single digit weighted
average cost of capital”. In contrast to Sleep Number estimate of WACC in the single digits, I
have estimated a slightly higher WACC of 11.68%. In comparison to WACC, Sleep Number has
an ROIC value of 43.60% in 2018 with an estimated value of 36.30% in 2019 and 30.7% in
2020. Even though there is a decrease, ROIC remains larger than WACC indicating growth is
adding value.
VALUATION AND INVESTMENT DECISION
To derive a valuation price of USD 45.16, I used the corporate valuation model, which
discounts expected free cash flows at the WACC. Sleep Number released its most recent
financial statements on February 26, 2019 for 2018 annual filings.
When estimating a price per share for Sleep Number using relative valuation with
Tempur-Sealy, Sleep Number is undervalued and considered a buy in three categories, according
to the multiples Price to Sales, Price Earnings, EV/EBITDA. Over the course of 2018, Sleep
Number repurchased 2.3 million common shares at a cost of USD 33.60 per share or USD 279
million. Sleep Number has reported a negative shareholder’s equity of USD (109,550K) for
ending 2018 because of the share repurchase program and is approved to execute the remaining
USD 186 million authorized repurchase. Even though Sleep Number is considered a buy using
relative valuation, Tempur-Sealy and Sleep Number target and market different customers that
weakens relative valuation.
TPX SNBR Investment
PPS Valuation
Multiples Value Value Decision
Price/Sales 1.27 49.6169172 63.01 Undervalued Buy
Price/Earnings 34.32 1.87 64.18 Undervalued Buy
EV/EBITDA 14.89 154394.00 65.22 Undervalued Buy
Market/Book 15.87 N/A N/A N/A N/A
However, using fundamentals I estimate the stock price for Sleep Number at USD 45.16
per share on March 29, 2019 suggesting the intrinsic/perceived value is lower than the current
P a g e 16 | 21Sleep Number Corporation (SNBR) MSUM Paseka School of Business 03/29/2019
stock market price of USD 47 per share. I estimate the twelve-month target price at USD 51.12
per share. Deriving at an estimated price per share of USD 45.16 in comparison to the current
traded price of USD 47.00, I opine that Sleep Number is within comparable value given less than
a 10 percent difference of market value. The fundamental analysis suggests then a HOLD
recommendation for SNBR until market conditions become more favorable.
SOURCES OF INFORMATION
P a g e 17 | 21Sleep Number Corporation (SNBR) MSUM Paseka School of Business 03/29/2019
Anon, (2019). [online] Available at: https://www.nasdaq.com/symbol/snbr/ownership-summary
[Accessed 19 Apr. 2019].
(n.d.). Retrieved March 29, 2019, from http://pages.stern.nyu.edu/~adamodar/
(n.d.). Retrieved March 29, 2019, from https://www.ytdreturn.com/?symbol=snbr
Newsroom.sleepnumber.com. (2019). About Us | Sleep Number. [online] Available at:
http://newsroom.sleepnumber.com/phoenix.zhtml?c=254487&p=irol-prhomeprofile_pf
[Accessed 19 Apr. 2019].
SEC Filings. (n.d.). Retrieved April 19, 2019, from
http://ir.sleepnumber.com/phoenix.zhtml?c=97149&p=irol-
SECText&TEXT=aHR0cDovL2FwaS50ZW5rd2l6YXJkLmNvbS9maWxpbmcueG1sP2lwYWd
lPTEyNzM2NTk2JkRTRVE9MCZTRVE9MCZTUURFU0M9U0VDVElPTl9FTlRJUkUmc3Vi
c2lkPTU3#Item_1A__Risk_Factors
Sleep Number Corporation (SNBR) Stock Price, Quote, History & News. (2019, April 19).
Retrieved from https://finance.yahoo.com/quote/SNBR?p=SNBR&.tsrc=fin-srch
SNBR Sleep Number Corp Stock Analysis, Price & History | Morningstar. (n.d.). Retrieved from
https://www.morningstar.com/stocks/xnas/snbr/quote.html
P a g e 18 | 21Sleep Number Corporation (SNBR) MSUM Paseka School of Business 03/29/2019
12/31/18 12/31/19 12/31/20 12/31/21 12/31/22 12/31/23 12/31/24 12/31/25
Income Statement ($ Thousands)
Sales $ 1,531,575 $ 1,623,902 $ 1,721,795 $ 1,825,590 $ 1,935,641 $ 2,052,326 $ 2,176,046 $ 2,307,223
Costs of goods sold (COGS) 541,648 602,398 654,282 675,468 696,831 708,059 750,742 738,311
Sales, general and administrative expense (SGA) 835,533 866,336 918,561 973,934 1,032,646 1,094,896 1,160,899 1,230,881
Depreciation 61,966 67,334 71,393 75,697 80,260 85,098 90,228 95,667
Operating profit $ 92,428 $ 87,835 $ 77,559 $ 100,490 $ 125,905 $ 164,273 $ 174,176 $ 242,363
Interest expense 5,911 10,978 11,833 12,868 13,903 14,922 15,853 16,844
Interest income 4 0 732 1,573 2,642 3,963 5,655 7,464
Nonoperating income (Expense) 0 0 0 0 0 0 0 0
Earnings before taxes (EBT) $ 86,521 $ 76,857 $ 66,458 $ 89,195 $ 114,644 $ 153,314 $ 163,978 $ 232,984
Tax expense 16,982 16,140 13,956 18,731 24,075 32,196 34,435 48,927
Net income before extraordinary items $ 69,539 $ 60,717 $ 52,502 $ 70,464 $ 90,569 $ 121,118 $ 129,543 $ 184,057
After-tax extraordinary income (Expense) 0 0 0 0 0 0 0 0
Net income (NI) $ 69,539 $ 60,717 $ 52,502 $ 70,464 $ 90,569 $ 121,118 $ 129,543 $ 184,057
Dividends-- preferred $ 0 $ 0 $ 0 $ 0 $ 0 $ 0 $ 0 $ 0
Dividends-- common $ 0 $ 0 $ 0 $ 0 $ 0 $ 0 $ 0 $ 0
Additions to RE $ 69,539 $ 60,717 $ 52,502 $ 70,464 $ 90,569 $ 121,118 $ 129,543 $ 184,057
Balance Sheets ($ Thousands) 12/31/18 12/31/19 12/31/20 12/31/21 12/31/22 12/31/23 12/31/24 12/31/25
Assets
Cash $ 1,612 $ 2,907 $ 3,082 $ 3,268 $ 3,465 $ 3,674 $ 3,895 $ 4,130
Inventory 84,882 92,383 97,952 103,857 110,118 116,756 123,795 131,257
Accounts receivable 24,795 24,000 25,447 26,981 28,607 30,332 32,160 34,099
Other short-term operating assets 39,568 44,955 47,665 50,538 53,585 56,815 60,240 63,871
Short-term investments 0 56,278 120,977 203,213 304,859 435,000 574,176 762,697
Total current assets $ 150,857 $ 220,524 $ 295,123 $ 387,858 $ 500,634 $ 642,577 $ 794,266 $ 996,055
Net plant, property, & equipment (PPE) 205,631 226,293 239,935 254,399 269,735 285,995 303,235 321,515
Other long-term operating assets 113,650 120,998 128,292 136,026 144,226 152,920 162,138 171,912
Long-term investments 0 0 0 0 0 0 0 0
Total Assets $ 470,138 $ 567,815 $ 663,349 $ 778,282 $ 914,594 $ 1,081,492 $ 1,259,640 $ 1,489,482
Liabilities and Equity
Accounts payable (AP) $ 144,781 $ 149,374 $ 158,379 $ 167,926 $ 178,049 $ 188,783 $ 200,163 $ 212,229
Accruals 93,053 108,842 115,404 122,361 129,737 137,558 145,850 154,642
Other operating current liabilities 51,234 53,480 56,704 60,122 63,746 67,589 71,664 75,984
All short-term debt 199,600 215,142 233,972 252,777 271,311 288,240 306,256 319,609
Total current liabilities $ 488,668 $ 526,839 $ 564,458 $ 603,186 $ 642,844 $ 682,170 $ 723,933 $ 762,464
Long-term debt 0 0 0 0 0 0 0 0
Deferred taxes 4,822 1,230 1,304 1,382 1,466 1,554 1,648 1,747
Preferred stock 0 0 0 0 0 0 0 0
Other long-term liabilities 86,198 88,579 93,919 99,581 105,584 111,948 118,697 125,852
Total liabilities $ 579,688 $ 616,648 $ 659,681 $ 704,149 $ 749,893 $ 795,672 $ 844,278 $ 890,063
Par plus PIC Less treasury (and other adjustments) (612,729) (612,729) (612,729) (612,729) (612,729) (612,729) (612,729) (612,729)
Retained earnings (RE) 503,179 563,896 616,398 686,861 777,430 898,548 1,028,091 1,212,148
Total common equity $ (109,550) $ (48,833) $ 3,669 $ 74,132 $ 164,701 $ 285,819 $ 415,362
P a g$e 19599,419
| 21
Total liabilities and equity $ 470,138 $ 567,815 $ 663,349 $ 778,282 $ 914,594 $ 1,081,492 $ 1,259,640 $ 1,489,482Sleep Number Corporation (SNBR) MSUM Paseka School of Business 03/29/2019
Statement of Cash Flows 12/31/18 12/31/19 12/31/20 12/31/21 12/31/22 12/31/23 12/31/24 12/31/25
Operating Activities
Net income $ 69,539 $ 60,717 $ 52,502 $ 70,464 $ 90,569 $ 121,118 $ 129,543 $ 184,057
Depreciation 61,966 67,334 71,393 75,697 80,260 85,098 90,228 95,667
Change in deferred tax 7,447 (3,592) 74 79 83 88 94 99
Change in inventory (584) (7,501) (5,569) (5,905) (6,261) (6,638) (7,038) (7,463)
Change in accounts receivable (5,483) 795 (1,447) (1,534) (1,626) (1,725) (1,828) (1,939)
Change in other short-term operating assets 5,662 (5,387) (2,710) (2,873) (3,047) (3,230) (3,425) (3,631)
Change in accounts payable 15,587 4,593 9,005 9,547 10,123 10,733 11,380 12,066
Change in accruals (12,820) 15,789 6,561 6,957 7,376 7,821 8,292 8,792
Change in other current liabilities 4,412 2,246 3,224 3,418 3,624 3,843 4,074 4,320
Net cash from operating activities $ 145,726 $ 134,994 $ 133,033 $ 155,849 $ 181,101 $ 217,109 $ 231,319 $ 291,969
Investing Activities
Investment in PPE $ (58,951) $ (87,996) $ (85,034) $ (90,160) $ (95,596) $ (101,358) $ (107,468) $ (113,947)
Investment in other long-term oper. ass. (5,578) (7,348) (7,294) (7,734) (8,200) (8,694) (9,218) (9,774)
Net cash from investing activities $ (64,529) $ (95,344) $ (92,328) $ (97,894) $ (103,796) $ (110,053) $ (116,687) $ (123,721)
Financing Activities
Change in short-term investments $ 0 $ (56,278) $ (64,698) $ (82,237) $ (101,646) $ (130,141) $ (139,176) $ (188,521)
Change in long-term investments 0 0 0 0 0 0 0 0
Change in short-term debt 175,100 15,542 18,829 18,806 18,534 16,929 18,016 13,352
Change in long-term debt 0 0 0 0 0 0 0 0
Preferred dividends 0 0 0 0 0 0 0 0
Change in preferred stock 0 0 0 0 0 0 0 0
Change in other long-term liabilities 9,909 2,381 5,340 5,662 6,003 6,365 6,749 7,155
Change in common stock (Par + PIC) (268,245) 0 0 0 0 0 0 0
Common dividends 0 0 0 0 0 0 0 0
Net cash from financing activities $ (83,236) $ (38,355) $ (40,529) $ (57,769) $ (77,109) $ (106,847) $ (114,411) $ (168,013)
Net cash flow $ (2,039) $ 1,295 $ 175 $ 186 $ 197 $ 209 $ 221 $ 235
Starting cash 3,651 1,612 2,907 3,082 3,268 3,465 3,674 3,895
Ending cash $ 1,612 $ 2,907 $ 3,082 $ 3,268 $ 3,465 $ 3,674 $ 3,895 $ 4,130
P a g e 20 | 21Sleep Number Corporation (SNBR) MSUM Paseka School of Business 03/29/2019
P a g e 21 | 21You can also read