Financing the UK Power Sector: Is the Money Available? - British Institute of Energy ...
←
→
Page content transcription
If your browser does not render page correctly, please read the page content below
Financing the UK Power Sector:
Is the Money Available?
William Blytha,b*, Rory McCarthyb, Robert Grossb
a
Oxford Energy Associates, Wheatley Road, Forest Hill, Oxford OX33 1EH, UK
b
Imperial College, South Kensington, London SW7 2AZ
*
Corresponding author. Tel. +44 (0) 1865 873 007. Email william.blyth@oxfordenergy.com
Categories / Keywords
Energy Finance and Investment
Electricity and nuclear
Renewables
Abstract
The power generation sector faces a major new round of investment to replace retiring plant and
meet carbon reduction and renewable energy targets. Achieving low-cost power generation
depends in part on the availability of low-cost finance. The traditional channel for this has been
through bonds and shares of large utility companies. However, utilities’ balance sheets are suffering
from a combination of high corporate debt, reduced electricity demand, and suppressed wholesale
prices. We find that the link between the finance sector and the electricity sector is not ‘broken’, but
the flow of money to the sector is threatened by the current weakness of the utilities’ business
model. This paper compares different published estimates of the scale of investment required in the
UK with historical investment rates. It uses literature review and interviews with practitioners to
summarise contemporary views of current industry conditions and trends in the UK. Potential policy
interventions that might be needed to bridge the gap are explored. These include ways to scale-up
traditional utility and project finance routes. The potential for alternative new routes of channelling
institutional investor funds directly into physical energy assets is reviewed.
1. Introduction
The electricity sector faces a level of capital investment in the coming two decades that is far higher
than the previous two decades (Ofgem, 2010b). This is driven by greater than average retirement
rates of existing plant, partly due to ageing of the generation fleet, accelerated by the retirement of
coal plant as a result of the EU Industrial Emissions Directive to control local pollutants
(Environment_Agency), and planned retirement of most of the UK’s nuclear plant.
1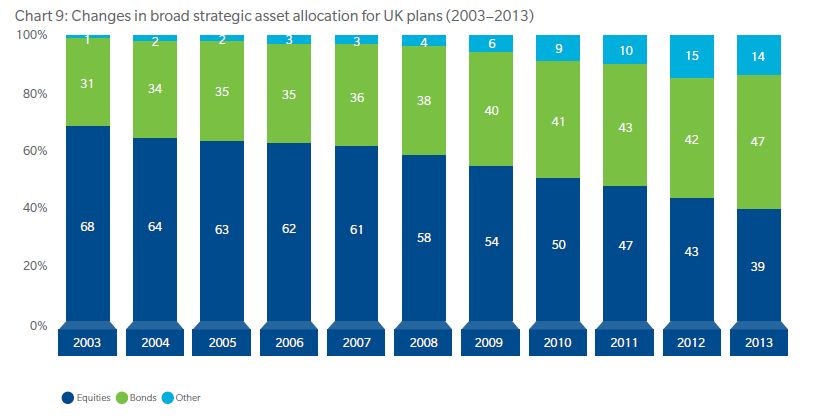
The most important factor that determines whether or not these investments are achievable is the
  underlying business case, i.e. the fundamentals of the electricity market, and the details of any
  subsidy regimes. Whilst this forms an essential backdrop, this is not the primary focus of this paper.
  Instead, we focus here on an important secondary and enabling factor, namely whether or not there
  are constraints to capital flows into the sector that could jeopardise these investments. We aim to
  clarify uncertainties over whether finance is available in sufficiently large volumes on sufficiently
  attractive terms to make the scale of investment required feasible.

  The analysis in this report is based on literature review combined with interviews with a range of
  different practitioners in the UK finance and electricity sectors. Many of the observations and
  conclusions drawn in this report therefore reflect a synthesis of contemporary views of various
  participants (see Appendix A).

  2. Scale of the Investment Challenge

       2.1. Review of Published Estimates
  Over the past several years, various organisations have published figures for the amount of capital
  required to finance future investments in the UK power sector, summarised in Table 1.

                Study    Scenario                Investment (£bn)                              Emissions
                Year                                                                           Intensity
                                                                                               gCO2/kWh
                                                    2020            2025            2030       2020   2025   2030
                                                 Ann.   Total   Ann     Total   Annual Total
OFGEM           2009    Green Transit’n GT         7.8    78      8.1    117                    304    196
                        Green Stimulus GS          7.3    73      7.7    111                    228    167
                        Dash for Energy DE         4.3    43      5.1      74                   364    315
                        Slow Growth SG             3.3    33      4.2      60                   379    328
Ernst &Young    2009    Central                                  11.3    164                           134
DECC            2012    Central                    9.9     77     7.7      98      8.0   140    206    186    129
National Grid   2013    Gone Green GG             11.1     77    14.4    173      15.1   257    200     75     50
                        Slow Progression SP        5.9     42     6.9      83      8.2   139    251    153    118
Committee on    2013    Ambitious Nuc AN                                          13.5   229                   49
Climate                 Ambitious RE AR                                           17.2   292                   48
Change                  Ambitious CCS ACCS                                        13.2   224                   55
                        Ambitious EE AEE                                          11.7   199                   52
London          2012    Hitting the target HtT                                    18.8   330
School       of         Gas is key GK                                             10.3   180
Economics               Austerity reigns AR                                        7.4   130
The     Crown 2012      Slow Progression 1        3.1    24
Estate                  Tech. Acceleration 2      4.5    35
(OffshWind              Supply Chain Eff. 3       4.5    35
only, excludes          Rapid Growth 4
                                                  6.1    48
transmission)
                                                                 a
   Table 1 Comparison of investment requirements between studies
  a
   Notes to Table 1. Figures in bold in the table correspond to where the study explicitly states an
  investment figure. Non-bold figures have been calculated by taking capacity addition figures and
  multiplying by a common capital cost.

   Source: (Ofgem, 2010a, Ernst & Young, 2009, DECC, 2012, National Grid, 2013, CCC, 2013, LSE, 2012,
                                                                                         PWC, 2012)

  UK Energy Research Centre                                2                                     Working Paper
A key difference between scenarios is the level of ambition in terms of carbon emissions. Since low-
carbon technologies are more capital intensive, the more ambitious scenarios in terms of emissions
intensities have a higher CAPEX requirement as can be seen from Table 1.
2.2. How Big is the Investment Gap?
Investment in power generation is quite cyclical. By contrast with much of the 2000s, the period
2009-2012 saw a significant increase in the rate of new additions to an average of 4 GW per year,
comprising 2.3 GW of gas, 1.3 GW of wind (0.6 GW onshore, 0.8GW offshore), and 0.5 GW of solar.
Figure 1 shows the implied new plant capacity additions for the future scenarios. At 4 GW per
annum, the total build rate of the past four years is higher than the OFGEM 2020 scenarios, and is
not far behind the National Grid ‘Gone Green’ scenario, albeit with a significantly smaller share of
renewables (1.9GW vs. 3.7GW for the NG scenario).
Total CAPEX estimates in Figure 1 Comparing historical and projected build rates (MW) and CAPEX
(£m)Figure 1 are similar to others in the literature, quoted at £5 billion (SSE, 2011) and £5.7 billion
per annum (PWC, 2012). At £4.8bn, average CAPEX over the past four years is below OFGEM Green
Transition and Green Stimulus investment requirements for 2020 (£7.6bn and £7.1bn respectively),
but somewhat ahead of the more pessimistic Slow Growth and Dash for Energy scenarios (£4.1bn
and £3.1bn respectively).
2012 was a strong year, with wind investment reaching 1.9 GW (0.7 GW onshore, 1.2 GW offshore).
This compares to around 2 GW of wind required annually, as an average across the different future
scenarios. Total investment exceeded £7bn, with £5bn for renewables, close to the OFGEM 2020
scenarios. Therefore, over recent years, and for 2012 in particular, investment rates compare quite
favourably with the expected investment requirements up to 2020. The period post-2020 looks
more challenging, largely because of the increasing need to replace retiring plant.
In summary, the investment trends of recent years look more than sufficient to meet the near-term
less environmentally ambitious scenarios. The more ambitious and more long-term scenarios,
especially those of the CCC for the 4th Carbon Budget would require scaling up by around £2.5 –
7.5bn compared to the average CAPEX over the past four years.
UK Energy Research Centre 3 Working PaperHistorical 2020 2025 2030
Historical 2020 2025 2030
Figure 1 Comparing historical and projected build rates (MW) and CAPEX (£m)
UK Energy Research Centre 4 Working Paper3. Investment Channels
3.1. Utility investment
Of the 16.5 GW of new capacity added to the UK system between 2006-2012, approximately 85%
(14 GW) has been built by the major utility companies (BNEF, 2012). The ability of utilities to
maintain or expand these investment rates depends on the overall health of their balance sheets.
CAPEX is financed directly from cash available to the business either from accumulated retained
earnings or from access to sufficient credit. For the top 25 European utilities as a whole, the earnings
margin is set to remain well below pre-recession levels.
The CAPEX plans for the ‘big 6’ electricity companies operating in the UK shown in Figure 2. These
are the total CAPEX for the company as a whole, not just for the UK. These figures show that CAPEX
plans are set to be reasonably steady on average to 2015, but this average is skewed by the large
expected increase in CAPEX for EDF as a result of the additional safety-related expenditure to their
fleet following Fukushima (EDF, 2012). Taking this out implies that for the other 5 companies, total
planned CAPEX is set to drop relative to 2012 levels by 12% in 2013, 24% in 2014, and 30% in 2015.
14
12
EDF
10 EON
RWE Group
CAPEX £ billions
8 Iberdrola
SSE
6
Centrica
4 RWE Innogy (renewables)
Average
2
Average - excl EDF
0
2005 2007 2009 2011 2013 2015
Figure 2 Total CAPEX plans for the ‘big 6’
Source: (Eon, 2013, Reuters, 2013a, RWE, 2013, SSE, 2013, Centrica, 2013, Iberdrola, 2013b,
Iberdrola, 2013a, EDF, 2013, Boxell, 2012, Thomson Reuters Datastream, 2013a)
Source: (DECC, 2011a, Investment Management Association, 2012)
Poor profitability is exacerbated by the utilities’ need to reduce debt, which increased 10 fold from
2000 to 2010 for the European utilities as a whole (CCC, 2012). Since 2009 however, they have
embarked upon major cost reduction programmes and disposal of assets to reduce their debt levels
(Ofgem, 2010b) which have also affected corporate spending priorities.
This is driven by utilities’ need to maintain credit ratings. Credit ratings provide information to
creditors about the health of companies’ balance sheets, including the risk of default on corporate
UK Energy Research Centre 5 Working Paperloans, and creditors will charge more for loans to companies with riskier credit ratings (Brealey et al.,
2006). The pattern of decreasing ratings is confirmed by the shifting of ratings distributions for the
EMEA top 25 utilities, mostly energy (electricity and gas), shown in Figure 3.
Figure 3 - EMEA Top 25 utilities long term ratings distributions. Source: (Standard & Poor's, 2013)
3.2. Project-financed Investment
Project finance is secured against the assets of a particular project rather than the asset base of a
wider company. Since the Enron and other financial mismanagement scandals, the ability of large
companies to ring-fence the liabilities associated with off-balance-sheet investments in this way has
largely disappeared (PWC, 2012). Nevertheless, project finance has been an important source of
finance for smaller developers. Project finance stagnated between 2008-2010 in the financial crisis
(Standard & Poor’s, 2013, Della Croce et al., 2011a), but late 2012 saw a re-emergence of capital
issuances for recycling project finance debt, followed by a number of other sizable infrastructure
projects early in 2013 (Standard & Poor’s, 2013).
3.2.1. Role in UK Onshore Wind
Project finance has been widely used by project developers in the UK for onshore wind (Mazars,
2012). Bank loans were a key contributor to financing these projects and helping to grow the UKs
cumulative onshore wind capacity. During the 2000s, pre-crisis, bank credit was cheap because of
low central bank base rates. Banks were keen to extend credit to projects that could earn a margin
over low-yielding national gilts and treasuries. With a track record of reasonably profitable projects,
reliable income payment structures, renewable energy subsidies, and technical risk, the wind sector
was able to attract a high share of debt (from below 60% to above 80% (Mazars, 2012). Since the
financial crisis however, lenders appear to be imposing a general cap. In 2012, maximum gearing
ratios dropped from above 80% to below 75% (Mazars, 2012), reflecting lenders increasing risk
aversion.
Lenders have also altered pricing of debt. Project spreads (i.e. the risk premiums charged on loans)
became very low in the run up to the financial crisis as credit-providers competed to lend to
projects. Since then, despite a drop in base rates and inter-bank borrowing rates, the cost of debt for
project financing wind projects has not dropped much, with lenders taking a wider spread (Figure 4).
UK Energy Research Centre 6 Working PaperTraditionally refinancing schemes have been on a 15 year basis or longer, but these have been
reducing to as little as 7 years (Mazars, 2012).
7%
Project spread
6%
5%
Swap fee
4%
3% Term swap
2%
6M Euribor
1%
0%
ECB rate
Jan 05 Jan 06 Jan 07 Jan 08 Jan 09 Jan 10 Jan 11 Jan 12 Jan 13
Figure 4 Cost of debt for European onshore wind
Source: (BNEF, 2013)
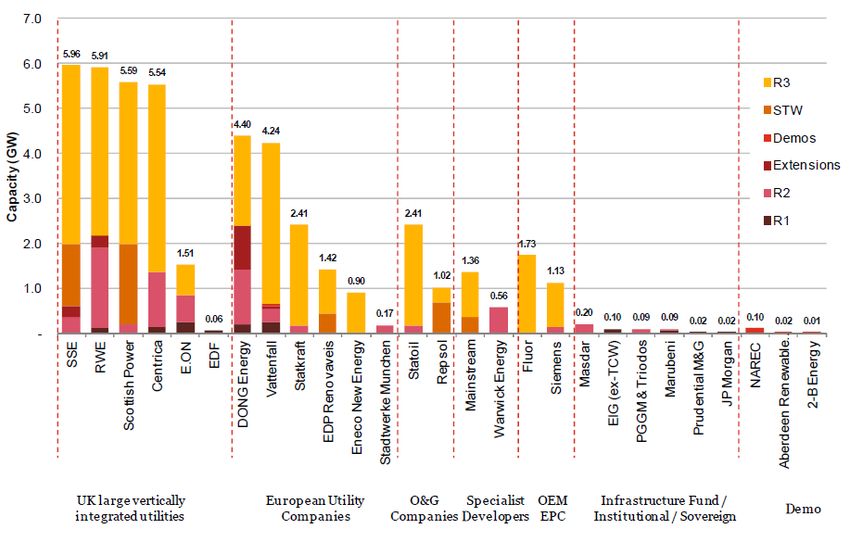
3.2.3. Financing UK Offshore Wind
The challenging physical environment and the larger turbine sizes significantly increases technical
risks both during construction and operation phases. In addition, the sheer size of offshore wind
farm developments usually requires the involvement of large companies. In practice this has meant
that offshore wind consortia has included large utilities, energy companies and technology
providers, who can cover the equity position and provide the technical expertise required (Figure 5).
Much of the equity is owned by consortia of utility companies (on-balance sheet), whilst debt is
often provided on a project-finance type arrangement with consortia of banks (Nelson and Pierpont,
2013), with loans often covered by guarantees from public institutions. The maximum debt leverage
has been limited to between 15 - 40% (PWC, 2012).
UK Energy Research Centre 7 Working PaperFigure 5 Equity ownership: shares of UK offshore wind by capacity
Source: (PWC, 2012)
Scaling up depends on two issues. Firstly, if the current round of early projects shows operational
risks to be low, this will encourage the emergence of a secondary market allowing project
developers to refinance by selling-on the projects once construction is complete. This would enable
construction capital to be recycled more quickly back into new projects, helping to accelerate overall
investment rates.
Secondly, more debt is needed at the pre-construction stage. This looks difficult because
constructing offshore wind plants is challenging, involving extreme weather conditions, marine
logistics, a fledgling supply chain which has been prone to delays (Greenacre et al., 2010) and
involving complex multi-contracting structures, so they do not achieve investment grade status
(Fitch Ratings, 2012). Some commentators have suggested that project bonds could however start to
play a role by 2017 and beyond (PWC, 2012).
4. Sources of Finance
The total size of global financial markets amounted to over $200 trillion in 2010 ((Roxburgh et al.,
2011) with over $100 trillion potentially available for corporate finance in the form of bank loans
(discussed in Section 4.1) and institutional investments (discussed in Section 4.2).
4.1. Bank finance
Loans (mostly from commercial banks) make up almost half of the pool of finance available for
corporate financing. This includes various lending instruments for mortgages, businesses and
consumer credit (Bank of England, 2013). Global debt doubled in the past decade from €78 trillion in
UK Energy Research Centre 8 Working Paper2000 to $158 trillion in 2010 mostly attributable to governments and financial institutions, and 31%
of this is in the form of loans held by banks, credit agencies and other financial institutions
(Roxburgh et al., 2011).
Leading up to the financial crisis, according to figures from the Bank of England, a massive increase
in debt lending from banks was noted in the UK (RBS Group, 2013) (Figure 6.).
Figure 6 – UK net corporate loans and bond issuance £ billion (2003-2012)
Source: (RBS Group, 2013) with data from BOE & Group Economics
Following the financial collapse, this trend reversed (PWC, 2012, IHS CERA, 2013) (Bank of England,
2013). Banks’ constrained balance sheets, together with increasing pressure to de-leverage from
Basel III regulations made the provision of low cost long term finance more difficult (PWC, 2012, IHS
CERA, 2013, Roxburgh et al., 2011, Kapan and Minoiu, 2013). Research by (RBS Group, 2013) showed
that bond issuance also stalled in 2010.
Economy-wide, there are signs that access to credit is easing, with bank borrowing and bond
issuance both being viewed more positively in a survey of CFOs (Deloitte, 2013). For the energy
sector however, it is still proving difficult to obtain attractive bank loans with the long maturities
required for low-carbon generation projects due to on-going liquidity and capital constraints, see
(Kaminker and Stewart, 2012).
At a global and European level, bank loans for renewable energy projects have been dominated by
multilateral and development banks, particularly after the financial crisis when regulations have
been stricter on commercial banks (UNEP, 2012). Global lending from these institutions for clean
energy projects was $79 billion in 2012. For renewable energy, development bank finance in 2012
was $51 billion (UNEP, 2013). In Europe, $20 billion was made available from Germany’s KfW, and
$4.3 billion came from the European Investment Bank in 2012 (UNEP, 2013).
In the UK by contrast, public bank involvement has been limited, with most bank debt for onshore
wind being sourced from commercial banks. Offshore wind in the UK has attracted funds from KfW.
The EIB have only two generation projects listed in the UK, both currently under appraisal (an
offshore wind farm and the Drax coal to biomass conversion) (EIB, 2013).
UK Energy Research Centre 9 Working Paper4.2. Institutional investors
Institutional investors are specialised financial institutions that manage savings collectively on behalf
of other investors such as pensions, insurance and private wealth funds (BIS, 2007) (Nelson and
Pierpont, 2013) (Kaminker and Stewart, 2012) (see Figure 7).
Figure 7 - Global fund management industry, assets under management (USD $ trillion)
Source: (Della Croce et al., 2011a) adapted from Climate Change 2011, (Deutsche Bank 2011)
The structure of institutional investors typically means that their liabilities range from short-term to
very long-term (e.g. pension funds). Most financial institutions aim to hold a range of assets which
broadly match their liabilities. Since there is a limited range of financial assets with such long
lifetimes, it has been posited that institutional investor money could be well-matched to long-lived
physical assets including energy infrastructure (Kaminker and Stewart, 2012), (PWC, 2012, CEPA,
2011, Holmes et al., 2012). Three main routes are proposed (ibid), and discussed in the following
sections:
Invest via bonds and shares of energy companies involved in the projects,
Invest directly in the projects
Invest via pooled investment vehicles and infrastructure funds
4.2.1. Investing through bonds & shares
As dominant players in traded equities and bond markets, institutional investors are already
indirectly supplying the majority of finance into the electricity sector. Figure 8 shows the allocation
plans of UK managed assets. Although the composition of allocation has changed, around 80% is
designated for equities and bonds (Investment Management Association, 2012), reflecting
institutional investor’s preference for liquid assets.
UK Energy Research Centre 10 Working PaperFigure 8 - Allocation of UK managed assets (2007 – 2011)
Source: (Investment Management Association, 2012)
Bonds
From the financial market perspective, institutional investors are required to limit exposure to risky
investments. This leads to an important dynamic in the relationship between energy markets and
financial markets. Acceptable levels of risk in the energy market are effectively constrained by the
level of acceptable risk in the regulated sectors of the financial market. If risks rise to the extent that
utilities lose their A ratings, they may lose their investment-grade status. This not only puts them at
a disadvantage in terms of having to borrow at higher interest rates, but the volumes of money
available at these higher risk ratings may simply not be large enough to sustain the utility financing
model.
Nevertheless, economy wide, bond issuances have recently increased on the back of decreased bank
lending, and record low sovereign bond yields, as investors seek more attractive alternatives
(Deutsche Bank, 2013). Bond issuances from four of the ‘big 6’ integrated energy utilities has been
fairly active since the financial crisis (Thomson Reuters Datastream, 2013b) (RWE, EDF, Centrica, SSE)
(Miller, 2011).
An increase in bond issuances could in principle expand utility balance sheets. However, if utilities
are simply changing the composition of their debt by moving towards bonds instead of bank loans,
overall potential investment for the energy sector will not expand. The net increase of finance relies
on the ability of utilities to expand their balance sheets without increasing credit risks, which is
determined by electricity market conditions.
Shares
Unless companies are in high growth sectors, issuance of new equity is seen in financial markets as
dilutive of company value, even if they are linked to investment in assets that should increase the
value of the company (Financier, 2013). Equity issuance is possible in conditions where share prices
are increasing, and there is investor confidence in market growth. However, these conditions are far
from being met in the European utility sector (Figure 9). Utilities have therefore been reluctant to
issue equity for the construction of new low carbon generation assets (SSE, 2011). For this to
change, investors will have to believe in feasible returns from the more challenging energy projects,
and companies will need to perform better, which would be eased by an improved economic
landscape.
UK Energy Research Centre 11 Working Paper80
70
60 Centrica
Share price (£)
50 E ON
40 RWE
Iberdrola
30
EDF
20
SSE
10
0
1998
2001
2004
2007
2009
2012
2015
Figure 9 - UK integrated utility share prices from 1998 - 2013 (£)
Source: (Thomson Reuters Datastream, 2013a)
4.2.2. Direct investment, private equity & infrastructure funds
The great majority of institutional investment is allocated to liquid assets such as bonds & shares.
Over recent years, a small but growing fraction of allocation is being made in alternative (illiquid)
investment vehicles (Capgemini and RBC Wealth Management, 2013, Mercer, 2013) (Figure 10),
though market practitioners typically expect that funds allocated to these alternatives would not
exceed 10-15% of assets under management (ibid).
Figure 10 - Changes in asset allocation for UK pension plans (2003 – 2010)
Source: (Mercer, 2013)
UK Energy Research Centre 12 Working PaperThe main channels for financial flows into the energy sector are outlined in the following table.
Direct A benefit of direct investment is cutting out the use of a fund manager, resulting in
investment higher returns and more control over the asset (Inderst, 2009). Building direct
investment teams changes organisation culture, as well as the risk and return
profiles of projects (Nelson and Pierpont, 2013). The drawback to having a dedicated
team are the high expenses involved. Currently, there is a gap between the
institutional community’s interest and their actual investment due to this lack of
capability (LCFG, 2012). Experience to date has often focussed on property
investment (Inderst, 2009). Sovereign wealth funds may have different risk appetite
and regulatory constraints, and have shown some entry to offshore wind (Section
3.2.3), although typically as much as 85% of funds are allocated to liquid and / or
fixed income assets (IMF, 2013).
Infrastructure Infrastructure funds enable institutional investors to pool finance whereby a
funds manager with suitable expertise can lower risk and ensure sufficient returns. They
are traditionally used to fund large infrastructure projects such as roads, hospitals
and housing, but have gained some ground in funding low carbon renewable
projects (Mazars, 2012, PWC, 2012).
They still play a relatively small role in the energy context. In 2007 $35.9 billion was
raised globally with a small fraction for European energy projects, contrasted with
£73 billion issued in bonds by European energy utilities alone in the same year
(Caldecott, 2010). However Asian markets seem to be growing rapidly, with shares
to energy and to Europe taking a significant share of global totals (see Figure 11).
Figure 11 - Breakdown of infrastructure deals by region and industry Q1 2013 (%)
Source: (Prequin, 2013a)
(Taylor-DeJongh, 2009) note a target return from private infrastructure fund from
18-20% reducing after the crisis to 13-15%. This demonstrates that such sources are
not necessarily low-cost. Regulatory limits may arise from the Volker Rule and the
Alternative Investment Fund Manager Directive (AIFM) (Della Croce et al., 2011b).
Private equity These are investment vehicles used to pool investor capital (Forbes, 2013). Some
and hedge investors lack the scale of finance required to invest in a particular asset such as
funds energy generation, so the pooling mechanism can be effective, whereby a fund
manager with expertise in the industry can be responsible for investment. Private
equity funds alone make up an estimated $3 trillion (Forbes, 2013), so they are a
potentially sizable resource.
Table 2 – Main routes for investment funds to flow into electricity sector assets
UK Energy Research Centre 13 Working PaperGlobal investment through these routes into long-term fixed assets is estimated at $2.4 trillion
(World Economic Forum 2011). This large total is however greatly fragmented into smaller sectoral
and geographical allocations. Investment into European clean energy infrastructure is a small share
of this total, as shown in Figure 12. The chart shows that the average annual amounts invested over
the four years 2009-2012 from these sources was almost €2bn (€0.5bn for direct investment, €1.1bn
for infrastructure funds and €0.3bn for hedge funds and private equity). Figures are not available for
the UK, but could represent perhaps 10% or more of these European totals (i.e. around £200m)
given the relative size of UK and European renewable markets.
€4,500
€m 3,984
€4,000 Other
€3,500 Renewable PE Fund
Hedge Fund
€3,000
General PE Fund
€2,500
General Infra Fund
€2,000 1,899
Energy Infra Fund
€1,500 Direct Long Term Investor
1,111 1,155
€1,000
Dedicated Renewable
812
Infrastructure Fund 691
540
450
€500 274 345
€0
2004 2005 2006 2007 2008 2009 2010 2011 2012 2013
Figure 12. Direct Institutional Investment in EU low-carbon infrastructure €m. Source: (Hg Capital)
The OECD (Kaminker and Stewart, 2012) has estimated the institutional investor’s global capital
value of $71 trillion. The WEF (World Economic Forum, 2011) identifies a subset of these investors
who could potentially invest in long-term assets, and arrive at an estimate of around $27tn assets
held by these groups. Of this, they estimate that $15tn is required to be invested in structurally
short-term assets, and a further $5.5tn tends to be in short term assets because of investment
processes. This leaves around $6tn that could potentially be available for investment in long-term
assets.
This represents an increase of 2.5 times the level currently made to investing in all categories of
long-term assets globally (WEF 2011). If the share of finance to European energy infrastructure were
to scale up by the same amount, then the volumes could increase from the level of around €2bn to
perhaps €5bn for Europe as a whole. Perhaps around 10% of this might be available for the UK, but it
seems unlikely that investment volumes for the UK electricity sector would exceed £1bn per annum
at the most. This makes a signficant contribution, closing perhaps up to a quarter of the investment
gap identified in Section 2, but is not sufficient on its own to solve the financing problem.
These rough estimates are backed up by other estimates in the literature. (Ernst & Young, 2010)
estimate a contribution of around £1bn per year for UK low carbon energy investment in total over
this decade. (Nelson and Pierpont, 2013) are somewhat more optimistic, suggesting that such funds
could provide up to a maximum of a quarter of required project equity, and up to a maximum of half
of debt requirements. However, they point out that significantly more attractive risk return profiles
would be needed to achieve these levels of investment (ibid).
UK Energy Research Centre 14 Working Paper5. Ways to boost investment
5.1. Overhaul Utility Model
The ability of utilities to expand their balance sheet is strongly linked to the fundamentals of the
electricity market, and the prospects for profitability and growth. Given the prevailing political focus
on cost reduction, policy options for improving the outlook of sector appear limited. In this light,
simply improving market conditions by allowing for greater returns on investment looks politically
infeasible. Two alternatives are briefly outlined.
So far in the UK, utility companies have tended to invest in a portfolio of technologies. While this can
reduce overall risk for the companies themselves, it does not reduce risk for the investors, who are
able to pool risk by choosing a portfolio of shares across different companies (Brealey et al., 2006).
An alternative is for a number of investors to group together to form a large investment arm, with
the expertise and finance required to undertake the risks involved to specialise in low carbon energy
investment (Murray, 2013). One option is to set up a dedicated utility which specialises in low
carbon projects. This would combine the advantages of the utility model (large companies with
balance sheet scale matched to the scale of the investment required, and with access to low-cost
capital through bond and share markets) with the advantages of specialisation, whereby the
company can maximise learning and technology cost reduction through accumulation of project
experience (Hagel and Brown, 2005).
(Helm, 2009) argues that during the two decades after privatisation when there was considerable
excess generation capacity, the liberalised market was well suited to driving efficiency into the
generation business to reduce costs, but that now the sector faces a need to renew its capital stock,
it may be time to return to a regulated asset base (RAB) model in order to allow access to low-cost
capital sources that would come with the increased certainty of returns this would bring.
Under RAB regulation, returns to investments in energy infrastructure would effectively be a
contractual arrangement with the regulator, providing a much greater degree of security regarding
future repayments through bills (ibid). It would still be necessary to convince consumers of the need
to pay potentially higher prices, so that regulatory risk would not be entirely removed. However,
experience in other areas of the energy sector, such as the gas network industry in Europe indicates
that institutional investors are more prepared to enter these kinds of RAB assets.
5.2. Ramp up Project Finance through refinancing
Once the construction phase is complete and a generation plant has operated for a period of time to
show it is functioning as expected, the technical risks for the project are significantly reduced, and
projects are often refinanced to get better terms for the debt. Early stage refinancing has been an
important feature for onshore wind. It allows project developers to recycle their capital into new
projects.
A similar model is beginning to appear for offshore wind projects. For the Walney projects, the OPW
joint venture who own 24.8% of the project, secured financing from DONG, and are looking to
refinance their position under a 15 year PPA (Hervé-Mignucci, 2012).
UK Energy Research Centre 15 Working PaperThe use of bridge financing is another method of accelerating finance for construction. Project
development consortia with suitable combined experience undertake the initial construction phase
using equity financing. After a short term of 12 months operation, sponsor equity investment can be
refinanced, freeing up funds for further construction projects for the investors (PWC, 2012).
This process suggests a potential new business model for utilities (Financier, 2013) as project
developers, rather than long-term owners of generation assets. This would allow their balance sheet
capital to be spread over a larger number of projects. Such a model would require a sufficiently large
pool of investors prepared to act as long-term owners of generation assets for the utilities to sell to.
This in turn would require significant improvement in the risk-return profile of the UK electricity
market (ibid).
5.3. Increased Role of Public Institutions
The UK has introduced the Government Guarantee Scheme and the treasury have proposed the
Private Finance 2 (PF2) initiative, to boost project finance (Standard & Poor’s, 2013). The UK
Guarantee scheme has been set up by the treasury to provide up to £40 billion of government
guarantees for projects deemed nationally significant in the governments National Infrastructure
Plan (HM Treasury, 2012). Guarantees are more complex than debt, with the government effectively
acting as an underwriter to the project (Standard & Poor’s, 2013). Due to the complexity, banks may
consider it more difficult to refinance projects with guarantees than straightforward debt (PWC,
2009). Nevertheless, out of the 23 pre-qualified projects that have applied, 12 are in the energy
sector. Notable examples include the conversion of major coal plants to biomass, and guarantees for
Hinkley Point C nuclear power station (IUK, 2013) (HM Treasury, 2012).
Some commentators argue that the PF2 scheme would lead to a high cost of capital, and would be
expensive and unrealistic to scale up (Leach, 2010). Others argue that this scheme has been
successful in the past for important infrastructure and is being used now for large infrastructure
projects such as train stock worth £1 billion for London’s Crossrail.
The Green Investment Bank (GIB) was set up by the UK Government in October 2012, with £3.8
billion in capital and borrowing power (Knott, 2013). This capital could grow to £18 billion within
three years if co-financing support from the private sector can be secured. They are a for-profit bank
with the aim of accelerating UK towards a green economy.
Although some commentators point out the small scale of the bank compared to the size of the total
investment required, they are an the hope is that they catalyse funding the construction phases of
projects before refinancing (SSE, 2011), although at present as a fledgling institution, they do not
appear to have the appetite for such risks, and are focussing attention on boosting secondary
markets for refinancing of existing projects (Financier, 2013).
The European Investment Bank (EIB) is one of the largest investors in clean energy projects in
Europe, providing €47 billion of funds during the period from 2007 to 2012 (IHS CERA, 2013), with
€4.5 billion in 2012 alone for energy projects in the EU (EIB, 2012). To date, the role of the EIB in UK
has been limited (Section Error! Reference source not found.). Nevertheless, the quantity of finance
UK Energy Research Centre 16 Working Papercommitted from the EIB shows from an EU level the important role public bodies can provide in
securing finance from the wider investment community for low carbon energy projects.
5.4. Green bonds
In 2012 the EIB set up the Project Bond Initiative (PBI) to attract institutional investors to important
infrastructure investments. The initiative will enable project companies to issue investment grade
bonds through an EIB risk sharing mechanism, and as part of the 2012-2013 pilot, up to €230 million
in guarantees will be provided (EIB, 2012). (Caldecott, 2010) poses a similar idea for green
infrastructure bonds as a method of refinancing project operational cash flows providing easily
tradable long term liquid assets with a lower cost of capital. The real prize would be for green bonds
to be issued to fund the risky construction phase of projects, where acquiring low cost debt finance
is a struggle, but if they are still seen as high risk they are unlikely to obtain investment grade
ratings, and therefore would not attract sufficient investment.
Figure 13 – Tier 1 Green bond issuance ($ billion)
Source: (UNEP, 2013) with data from BNEF
The period 2010 -2012 saw a considerable increase in green bond issuances, albeit from a very low
level (Figure 13). (Padraig and Boulle, 2013) arrive at a higher figure of $11.6 billion in issuance
globally in 2012 by counting total bond issuances for companies and projects which can be linked to
low carbon energy investments, but which are not necessarily labelled as green bonds.
The UK held only two issues in 2012 for small solar and wind energy projects. A barrier (Kaminker
and Stewart, 2012) is that these bonds will be at the lower end of the investment grade ratings,
which means they will require higher capital charges. (Veys, 2011) suggests that a typical minimum
issuance size for a standard institutional investment grade bond is around £300 million, so only large
projects, or pools of smaller projects would be able to access these sources.
Recently green bond issuances by the private sector have overtaken those of public institutions, but
so far have been made by large companies: EdF (€1.4bn), Toyota ($1.75bn) and Unilever (£250m)
(Economist, 2014). The EdF example is interesting as it shows the ability of the power company to
raise debt for new investments in the current market conditions. However, these examples do not
show that green bonds can yet stand separate from large corporate backing, so do not yet on their
own provide an alternative financing route to the utility model.
UK Energy Research Centre 17 Working Paper6. Conclusions and Policy Implications Very large volumes of finance are only available for relatively low-risk investments. The traditional utility model is designed to exploit this by providing an ‘investment grade’ vehicle that can be financed through low cost bonds and shares which meet the liquidity needs of large institutional investors. Questions have been raised about whether this model is still working, but recent evidence suggests that required investment levels up to 2020 are achievable if investment rates of recent years can be maintained. This is a major caveat, considering that current CAPEX plans across Europe for the ‘big 6’ utilities operating in the UK are due to be cut by as much as 30% over the two years to 2015. Investment post-2020 will need to step up more significantly. If the utility model is to survive, they need to be able to make a profit in the market. This suggests that the primary focus of policy should be getting the investment conditions right in the electricity sector, and keeping risks down. If the market remains unattractive to utilities, it is unlikely that other major investors would find it attractive. One alternative would be to facilitate creation of a new utility-scale company for investing in renewable energy generation, which could attract low-cost financing through bonds and shares, whilst benefitting from technological specialisation and expertise. Another alternative would be to completely re-regulate electricity generation on a fixed rate of return model which removes most of the risk for the investor. The regulated asset base model has proved attractive to institutional investors in the energy networks sector, and is likely to make finance readily available to the sector. The downside of reduced competitive pressures and innovation should not however be underestimated. Feed-in tariffs being introduced in the UK for low-carbon generation are a half-way house, providing fixed income, though not fixed returns because of uncertainty over construction and operating costs. It is yet to be seen whether these instruments will attract different business models that could structure new types of finance around these contracts. There are ways to encourage this diversity of financing sources into the sector. In the short-term, there is a role for public financial institutions such as the Green Investment Bank and the European Investment Bank to take direct stakes in projects to leverage other investors in and to stimulate secondary markets for projects post-construction which can help accelerate the recycling of pre- construction capital into new projects. Project bonds may start to play a more significant role, but evidence is mixed about whether they will really take off to any significant extent. In the longer term, ownership structures in the electricity sector are set to evolve. For example, whilst utilities own the majority of equity in offshore wind projects, they generally involve quite wide consortia. Direct stakes in energy projects by institutional investors are currently low, but could grow to a sizable level (though they seem unlikely to become dominant). Equipment manufacturers often take a stake in offshore wind, and could do so also for nuclear. The capacity mechanism could also attract more diverse ownership, and could start to engage the demand side more actively. Combined with the growth of embedded generation with very diverse ownership profiles, this may alter the characteristics of the market substantially over the next two decades, bringing with it a diversification of financing models for the sector. UK Energy Research Centre 18 Working Paper
Appendix A. Organisations Consulted During Research This research therefore benefited considerably from interviews with a range of practitioners in the finance sector. Since the individuals generally wished to remain anonymous, only organisation names are listed. In some places in the text, individual views have been referenced to personal communication. However, more generally throughout this text, these interviews have been synthesised to provide the basis for the views expressed in the report. The authors wish to express their gratitude to all those who gave their time to be involved in this study. Bank of America Merrill Lynch Barclays Bank Climate Change Capital Climate Policy Institute Ethix SRI Advisors Foresight Group Green Investment Bank Hg Capital IHS CERA Low Carbon Finance Group National Grid New Energy Finance Ofgem Pöyry Renewable Energy Generation Standard & Poor’s University of Leeds Z/Yen Acknowledgement The authors would like to acknowledge financial support from UKERC for this research. UK Energy Research Centre 1 Working Paper
References

BANK OF ENGLAND 2013. Trends in Lending. Bank of England (BOE).
BIS 2007. Institutional investors, global savings and asset allocation. Bank for Internation
       Settlements (BIS).
BNEF 2012. UK BIG 6 UTILITY INVESTMENT TRENDS. A report for Greenpeace UK on the generation
       investments of the Big 6 utilities ed.: Bloomberg New Energy Finance.
BNEF 2013. Personal communication on cost of debt for European onshore wind.
BOXELL, J. 2012. EDF confident on capital spending target. Financial Times, 16 February 2012.
BREALEY, R. A., MYERS, S. C. & ALLEN, F. 2006. Corporate Finance, New York, McGraw Hill.
CALDECOTT, B. 2010. Green Infrastructure Bonds: Accessing the scale of low cost capital required to
       tackle climate change. Climate Change Capital
CAPGEMINI & RBC WEALTH MANAGEMENT 2013. World Wealth Report 2013.
CCC 2010. The Fourth Carbon Budget – reducing emissions through the 2020s. London: Committee
       on Climate Change.
CCC 2012. Energy prices and bills – impacts of meeting carbon budgets. Committee on Climate
       Change.
CCC 2013. Next steps on Electricity Market Reform – securing the benefits of low-carbon investment

Committee on Climate Change.
CENTRICA 2013. Strategy Update.
CEPA 2011. NOTE ON IMPACTS OF THE CFD SUPPORT PACKAGE ON COSTS AND AVAILABILITY OF
       CAPITAL ON EXISTING DISCOUNTS IN POWER PURCHASE AGREEMENTS. Cambridge
       Economic Policy Associates Ltd (CEPA).
CLEAN ENERGY PIPELINE 2013. EUROPEAN OFFSHORE WIND PROJECT DEBT FINANCE UPDATE –
       JUNE 2013.
DECC 2011a. Historical electricity data: 1920 to 2011.
DECC 2011. National Policy Statement for Electricity Networks Infrastructure (EN-5).
DECC 2011b. Renewable Energy Roadmap. UK Department of Energy and Climate Change.
DECC 2012. UPDATED ENERGY AND EMISSIONS PROJECTIONS 2012.
DELLA CROCE, R. 2012. Trends in Large Pension Fund Investment in Infrastructure. OECD Working
       Papers on Finance, Insurance and Private Pensions,.
DELLA CROCE, R., KAMINKER, C. & STEWART, F. 2011a. The Role of Pension Funds in Financing Green
       Growth

Initiatives. Paris: OECD.
DELLA CROCE, R., SCHIEB, P.-A. & STEVENS, B. 2011b. PENSION FUNDS INVESTMENT IN
         INFRASTRUCTURE A SURVEY. INTERNATIONAL FUTURES PROGRAMME PROJECT ON
         STRATEGIC TRANSPORT INFRASTRUCTURE TO 2030. OECD.
DELOITTE 2013. The Deloitte CFO Survey: 2013 outlook: Cash, costs and the search for opportunity.
         2012 Q4 results.
DEUTSCHE BANK 2013. Corporate Bond Issuance in Europe Where do we stand and where are we
         heading? : Deutsche Bank DB Research.
DOWJONES 2013. Munich Re Buys 50% In UK Marchwood Power Ltd. DowJones Newswires, 21
         November.
ECONOMIST. 2014. Green Bonds: Spring is in the air. The Economist, p.75.
EDF 2012. 2012 REFERENCE DOCUMENT ANNUAL FINANCIAL REPORT.
EDF 2013. HALF-YEAR FINANCIAL REPORT

EIB 2012. Activity Report 2012. European Investment Bank.

UK Energy Research Centre                       2                                   Working Paper
EIB 2013. Projects to be Financed. European Investment Bank (EIB).
ENVIRONMENT_AGENCY. http://www.environment-agency.gov.uk/business/sectors/144494.aspx
[Online]. [Accessed December 2013].
EON 2013. Capital Market Story.
ERNST & YOUNG 2009. Securing the UK’s energy future – meeting the financing challenge
An update to the Ernst & Young ‘Costing the earth? The impact of climate change mitigation on UK
domestic customer energy bills’ study.
ERNST & YOUNG 2010. Capitalising the Green Investment Bank.
FINANCIER. July 17 2013. RE: Personal communication with anonymous financier. Type to BLYTH, W.
& MCCARTHY, R.
FITCH RATINGS. 2012. Construction Risks Challenge Funding for Offshore Wind [Online]. [Accessed 2
October 2013.
FORBES. 2013. Looking Inside Private Equity and Hedge Funds [Online]. Available:
http://www.forbes.com/sites/timothyspangler/2013/03/25/looking-inside-private-equity-
and-hedge-funds/.
GREENACRE, P., GROSS, R. & HEPTONSTALL, P. 2010. Great Expectations: The cost of offshore wind
in UK waters – understanding the past and projecting the future.
HAGEL, J. & BROWN, J. S. 2005. The Only Sustainable Edge: Why Business Strategy Depends On
Productive Friction And Dynamic Specialization, US, Harvard Business School Press.
HELM, D. 2009. Infrastructure Investment, the cost of capital, and regulation: an assessment. Oxford
Review of Economic Policy, Volume 25, pp.307–326.
HERVÉ-MIGNUCCI, M. 2012. San Giorgio Group Case Study: Walney Offshore Windfarms. Climate
Policy Inititative (CPI).
HM TREASURY 2012. Government uses fiscal credibility to unveil new infrastructure investment and
exports plan.
HOLMES, I., GAVENTA, J., MABEY, N. & TOMLINSON, S. 2012. Financing the Decarbonisation of
European Infrastructure 30 percent and beyond.
IBERDROLA. 2013a. IBERDROLA PROJECTS STABLE PROFITS AND DIVIDEND IN 2012-2014 [Online].
[Accessed 9 December 2013.
IBERDROLA 2013b. Outlook 2012/2014 renewables business.
IHS CERA 2013. The Energy Investment Imperative: Toward a Competitive and Consistent Policy
Framework Special Report.
IMF 2013. Sovereign Wealth Funds: Aspects of Governance Structures and Investment Management.
Washington DC.: International Monetary Fund.
INDERST, G. 2009. Pension Fund Investment in Infrastructure OECD Working Papers on Insurance
and Private Pensions. OECD Publishing.
INVESTMENT MANAGEMENT ASSOCIATION 2012. Asset Management in the UK 2011 - 2012 The
Annual IMA Survey.
IUK 2013. National Infrastructure Pipeline. In: TREASURY, H. (ed.).
https://www.gov.uk/government/publications/national-infrastructure-plan-2013.
KAMINKER, C. & STEWART, F. 2012. THE ROLE OF INSTITUTIONAL INVESTORS IN FINANCING CLEAN
ENERGY. OECD WORKING PAPERS ON FINANCE, INSURANCE AND PRIVATE PENSIONS. OECD.
KAPAN, T. & MINOIU, C. 2013. Balance Sheet Strength and Bank Lending During the Global Financial
Crisis International Monetary Fund (IMF).
KNOTT, P. 2013. Financing Renewable Energy: The UK Green Investment Bank plc. Rushlight
Sustainable Resources Briefing: Financing Methods and Issues for Renewable Energy & Clean
Infrastructure Projects London.
LCFG. 2012. Written evidence submitted by the Low Carbon Finance Group (LCFG) In response to the
draft Energy Bill [Online]. Energy and Climate Change Committee. Available:
http://www.publications.parliament.uk/pa/cm201213/cmselect/cmenergy/275/275we36.ht
m.
UK Energy Research Centre 3 Working PaperLEACH, G. 2010. Infrastructure - Mind the Gap! : Institute of Directors (IOD).
LSE 2012. ENERGY AND THE ECONOMY THE 2030 OUTLOOK FOR UK BUSINESSES. A London School of
Economics report commissioned by RWE npower.
MAZARS 2012. UK ONSHORE WIND INVESTMENT How long can the sector continue to buck the
trend?
MERCER 2013. ASSET ALLOCATION SURVEY EUROPEAN INSTITUTIONAL MARKETPLACE OVERVIEW
2013. Mercer.
MILLER, J. 2011. The evolution of infrastructure finance. Royal Bank of Scotland (RBS).
MURRAY, J. 2013. Climate Change Capital founder reveals plan for green energy mega corp [Online].
Business Green. Available: http://www.businessgreen.com/bg/news/2283703/climate-
change-capital-founder-reveals-plan-for-green-energy-mega-corp [Accessed 24 September
2013].
NATIONAL AUDIT OFFICE 2010. The Electricity Generating Landscape in Great Britain.
NATIONAL GRID 2013. UK Future Energy Scenarios UK gas and electricity transmission.
NELSON, D. & PIERPONT, B. 2013. The Challenge of Institutional Investment in Renewable Energy.
Climate Policy Initiative (CPI).
OFGEM 2010a. Project Discovery Energy Market Scenarios Update.
OFGEM 2010b. Project Discovery Options for delivering secure and sustainable energy supplies:
Consultation. Office of Gas and Electricity Markets.
PADRAIG, O. & BOULLE, B. 2013. Bonds and Climate Change Climate Bonds Initiative.
PICKARD, J., PLIMMER, G. & ODELL, M. 2012. Crossrail trains to receive state guarantee. Financial
Times (FT), 24 September 2012.
PREQUIN 2013a. The Preqin Quarterly Update: Infrastructure: Q2 2013.
PREQUIN 2013b. The Prequin Quarterly Update: Infrastructure Q1 2013.
PWC 2009. Meeting the infrastructure funding gap: government intervention.
PWC 2010. The New Basel III Framework: Navigating Changes in Bank Capital Management. A
publication of PWC’s Financial Services Institute (FSI).
PWC 2012. Offshore wind cost reduction pathways study Finance work stream.
RBS GROUP 2013. The UK Corporate Bond Wave.
REUTERS 2013a. Green makeover will be struggle for Germany's RWE.
REUTERS. 2013b. UPDATE 1-Macquarie-led investor group buys DONG gas plant in UK.
ROXBURGH, C., LUND, S. & PIOTROWSKI, J. 2011. Mapping capital markets update_2011. McKinsey
& Company.
RWE 2013. Fact Book Renewable Energy.
RYSER, J. 2013. How Germany’s renewables have hit wholesale power prices [Online]. Platts, McGraw
Hill Financial. Available: http://blogs.platts.com/2013/04/19/german-power/ [Accessed 01
October 2.
SSE 2011. An Energy White Paper A Package of Reforms to Encourage Investment in Electricity
Generation.
SSE 2013. SSE Financial Results Year Ended 31 March 2013.
STANDARD & POOR'S 2013. Industry Report Card: Tough Market Conditions Keep 25 Top European
Utilities Under Pressure. Global Credit Portal, Ratings Direct.
STANDARD & POOR’S 2013. Industry Report Card: New Finance Structures Set To Spur A Revival Of
Debt Issuance In The Project Finance Industry.
TAYLOR-DEJONGH 2009. Infrastructure Funds: Trends and Opportunities.
THOMSON REUTERS DATASTREAM 2013a. Energy company accounts data extraction.
THOMSON REUTERS DATASTREAM 2013b. UK Energy Utilties Historical Bond Issuances.
UNEP 2012. GLOBAL TRENDS IN RENEWABLE ENERGY INVESTMENT 2012. Frankfurt School - UNEP
Collaborating Centre for Climate & Sustainable Energy Finance.
UNEP 2013. GLOBAL TRENDS IN RENEWABLE ENERGY INVESTMENT 2013. Frankfurt School – UNEP
Collaborating Centre for Climate & Sustainable Energy Finance.
UK Energy Research Centre 4 Working PaperVEYS, A. 2011. The Sterling Bond Markets and Low Carbon or Green Bonds
E3G.
WORLD ECONOMIC FORUM 2011. The Future of Long Term Investing. In: CECILIA MOLINARI (ed.). A
WORLD ECONOMIC FORUM REPORT in collaboration with OLIVER WYMAN.
UK Energy Research Centre 5 Working PaperYou can also read