FINSCOPE CONSUMER SURVEY MADAGASCAR LAUNCH PRESENTATION - 2016 11 NOVEMBER 2016

Page created by Yvonne Salinas
 
CONTINUE READING
FINSCOPE CONSUMER SURVEY MADAGASCAR LAUNCH PRESENTATION - 2016 11 NOVEMBER 2016
FinScope Consumer Survey
       Madagascar
           2016

  Launch Presentation
      11 November 2016
FINSCOPE CONSUMER SURVEY MADAGASCAR LAUNCH PRESENTATION - 2016 11 NOVEMBER 2016
Contents

1. Overview
2. Understanding people’s lives
3. Financial inclusion overview
4. Banking and MFIs
5. Savings and investments
6. Borrowing and credit
7. Insurance and risk management
8. Remittances and mobile money
9. Financial Inclusion Priorities

                                    2
FINSCOPE CONSUMER SURVEY MADAGASCAR LAUNCH PRESENTATION - 2016 11 NOVEMBER 2016
Partnering for a common purpose

Making Access Possible (MAP) is a diagnostic and programmatic framework to support
expanding access to financial services. The MAP methodology and process has been
developed jointly by:

At country level, the core MAP partners, collaborate with other stakeholders such as
policymakers, regulators and donors to ensure an inclusive, holistic process. In
addition to the above MAP members, to formalise the MAP Madagascar process,
there is a technical committee comprising the following additional members:

                                                                                       3
FINSCOPE CONSUMER SURVEY MADAGASCAR LAUNCH PRESENTATION - 2016 11 NOVEMBER 2016
Acknowledgements

• General Secretary – Ministry of Economy and Planning
• Locale authorities (chiefs)
• INSTAT staff
• Malagasy
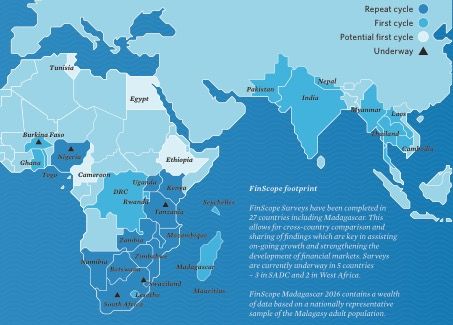
FINSCOPE CONSUMER SURVEY MADAGASCAR LAUNCH PRESENTATION - 2016 11 NOVEMBER 2016
FinScope Footprint
Objectives of FinScope Madagascar 2016

• To describe the levels of financial inclusion (i.e. levels of access to financial
 products and services – both formal and informal)
• To describe the landscape of access (i.e. the type of products and services used
 by financially included individuals)
• To identify the drivers of, and barriers to financial access
• To stimulate evidence-based dialogue that will ultimate lead to effective
 public and private sector interventions that will increase and deepen financial
 inclusion
• To create a benchmark/baseline for financial inclusion in Madagascar (2016) to
 which provide an assessment of changes and factors in the future (including
 possible impacts of future interventions to enhance access)

                                                                                      6
Research process

1            Design      2   Implementation   3          Results

         Agreements           Training of          Data management
                                              (data entry, cleaning and
          (SC, INSTAT)       enumerators             weighting)
    SC

         Questionnaire         Pilot and
            design           questionnaire           Data analysis
                               revision
    SC
                                              SC

    Sampling, maps           Fieldwork               Launch and
       and field
                               n=5,040              dissemination
     preparations

                                                                          7
Methodology - overview

  Respondent                   Sample and                 Quality control and
    profile                    methodology                 data validation
                     • Sample drawn by INSTAT;           • Quality control / field
• Universe: Adult
                       representative on national,         checks conducted by
  population in
                       urban/rural, and regional level     the INSTAT, UNCDF,
  Madagascar
                                                           CNFI and FinMark Trust
• Residents of       • Comprehensive LISTING in 504
                                                         • Data validation against
  Madagascar who       EAs – listing 111 469 eligible
                                                           census data, General
  are 18 years and     households
                                                           Population and
  older
                     • 5 040Face-to-face pen and           Housing Census in 1993
                       paper interviews ± 75 min.          and projections and
                                                           the National Survey for
                     • Fieldwork conducted by INSTAT       monitoring the MDG
                       (September 2015 – April 2016)       goals 2013
                                                         • Weighting of the data
                                                           conducted by INSTAT
                                                                                     8
Contents

1. Overview
2. Understanding people’s lives
3. Financial inclusion overview
4. Banking and MFIs
5. Savings and investments
6. Borrowing and credit
7. Insurance and risk management
8. Remittances and mobile money
9. Financial Inclusion Priorities

                                    9
Understanding people’s lives:
         Demographics

                                                    •     73% reside in rural areas
                  Total adult (18+)
                  population                        •     41% are 30 years of age or younger
                                                    •     57% have primary education or less
                  ±11 million
                                                    •     17% have no formal education

 Urban/rural                Gender                           Age                                    Education

                                              61 years and older
                                                                                         Vocational /
                                                                   8
                                                                                       Tertiary / Higher   5
                                                                                          education
             27                                    51 - 60 years       12
                                         48                                                 Secondary
                                                                                                                     38
73                     52                          41 - 50 years            17              education

                                                   31 - 40 years
                                                                                            Primary
                                                                                 22
                                                                                         education and               40
                                                                                              less
                                                   26 - 30 years       13
     Urban                      Male
                                                                                             No formal
                                                                                                                17
     Rural                                         18 - 25 years                  28         education
                                Female
                                                                                                                          10
Understanding people’s lives:
                Income / livelihoods
• Farming is very important to the Malagasy with 71% of households being involved in farming with rice
     (43%) and legume crops (10%)
•    31% of farmer households are in possession of a document for the land they farm on (title deed or petits
     papiers)
•    18% of farmer households are consumption, 9% are fully commercial and 73% both consume and sell their
     produce
•    Drought and natural disasters and product spoilage and lack of tools are the main problems for farmers

    Source of farming inputs                                       Farming problems experienced
          Use other sources of income                57
                   Sell some livestock          31          Climatic risks (drought,…                    48
                      Sell some crops        21
    I manage with what I have already      15                         Lack of tools                 32
                Sell products we have     12                                Disease                31
                           Use savings    10
Sell something we collect from nature    9                        Not enough land                  29
     Borrow from friends and/or family  5
                                                                      Selling prices          24
          Borrow from a money lender   3
                     Loan from a bank  1                              Lack of seeds          20
    Borrow from a community/savings… 1
                                 Other  4                         Lack of fertilizers   15
                                                                                                              11
Understanding people’s lives:
             Agriculture
• 7% of farmer households received formal training/technical assistance mainly in agricultural, fishing
    and livestock techniques with most having had it free of charge
•   Land size, lack of water and low productivity are the main barriers to commercialisation
•   Markets are more popular amongst those farmers selling their produce while those selling to more
    formal buyers are few
                  Barriers to commercialising                   Market for those selling crops/produce

          Do not have enough land                          84         At market place                   66
        Do not have enough water                      71
                                                                Direct to the consumer             33
          There is no surplus to sell                 70
                                                                   Middlemen / agent               29
     Do not have the money for the…              62

     Do not have enough access to…               60                           Retailer        10

        There is no transport to the…            59
                                                                     Trading company      3
        The market is too far away              58
                                                                         Auction floor    2
         Transport is too expensive             57
                                                                 Processor e.g. Milling
           Farming is too involving             54                                        1
                                                                      company

                                                                                                             12
Understanding people’s lives:
                  Income / livelihoods
 • Almost half of the adults claim farming / farming activities as a main income source
 • The informal economy provides the main income source for 36% of adults and 10% are
   dependents relying on remittances and assistance
 • Formal sector i.e. public and private sector as well as formal self employment provides main
   income for 10% of adults
 • 66% of adults personally earn 100,000Ar (≈$31) or less per month while 95% live under
   400,000Ar (≈$123) per month (including 1% that claim to have no income)

                          Principal Income Source                                       Personal monthly income1

           Farming / farming activities                47               1 000 001 Ar to 2 000 000 Ar      1
Self-employed - unregistered business             14
 Get money from household member                 10                          500 001 Ar to 1 000 000 Ar   2
      Salary/wages from an individual        4
             Salary/wage from a farm        4                                 400 001 Ar to 500 000 Ar    2
                           Piece work       4
  Salary/wages from private company         4                                 200 001 Ar to 400 000 Ar        11
  Self-employed - registered business       3
                                                                              100 001 Ar to 200 000 Ar         18
      Salary/wages from Government          3
             Get money from parents        2                                     100 000 Ar and below               65
                 Pension or annuities      2
         Remittances (money/in-kind)      1                                                 No income     1
                       Part-time work     1
                                                                                                                         13
                                                            1USD = 3,250Ar
Daily realities - contextualising the drive for
            greater financial inclusion

                     Gone without medical treatment or
                                                                           40
                                 medicine
                 Skipped a meal because you didn’t have
                                                                     31
                                 food
                Not been able to send children to school       19

             Use firewood as a main source of energy for
                                                                                    64
                               cooking
                   Use spring water as the main source of
                                                                      33
                               drinking water

• The poverty indicators above show that medical costs are a challenge with two in five adults going
    without treatment
•   About two out of three adults reside in households that use firewood as the main source of energy
    for cooking
•   When adults occupy their time in getting basic amenities, they seldom concern themselves with
    getting financial services
                                                                                                    14
Understanding people’s lives:
                Ownership of assets (household level)
                                                  Bed/Mattress                                                                   87   96
                                                                                                                                84
                                                          Radio                                                         68 77
                                                                                                                    65
                                               Lamp/floor lamp                                              55
                                                                                                            5458
                                                 Mobile Phone                                     32
• Generally, low ownership of                                                          21                          63
  household assets with huge                         Television                              26                     65
                                                                               12
  gaps between rural and urban                Wardrobe/Closet                          21              46
                                                                               12
  counterparts                                                                         19
                                                         Bicycle                      1821
• Low ownership of assets
                                 Video recorder / CD DVD Player                13                 32
  amongst rural households                                              7
  particularly electrical                               Jewelry                13 21
                                                                            10
  appliances such as TVs,                Plow (engine or animal…   2       8
                                                                            10
  refrigerators, etc.                                                    7 13
                                               Sewing machine          5                                                               Total
                                    Refrigerator / Freezer Chest       5 13
                                                                   2                                                                   Urban
                                        Motorcycle / Motorbike          5
                                                                       3 8                                                             Rural
                                           Hifi or sound system        5         14
                                                                   2
                                        Generator / Solar panel     4
                                                                   34
                                                            Fan        4 10
                                                                   2
                                             Desktop or Laptop         4 12
                                                                   1
                                        Satellite Dish / Decoder    3
                                                                   1 6

                                                                                                                                               15
Understanding people’s lives:
                 Access to Infrastructure (household level)

    Number of households with access to tap water                                          Number of household with electricity connection
        (as main source of drinking water)                                                                    Total: 31%
                              Total: 31%                                                                Urban 72% : Rural 16%
                    Urban 68% : Rural 17%

    Number of households with access toilet facilities                                                                                          76
                                                                                                          JIRAMA                                        94
                               Total: 68%                                                                            2
                                                                                                                                           46
                                                                                              Independent Provider   0
     60               Urban 91% : Rural 59%                                                                              4
                                                                                                       Solar Panel   3
                                                                                                                                 16
                    31                                                                                                                37
                                    4                                                                                1
                                                   2             2              1                       Generator    0
                                                                                                                     2                          Total
   Latrines   No Toilets / In Private toilets Private flush Private flush Public toilets      Neighbouring houses    23                         Urban
without slab / the Nature without flush - toilets -            toilets -                                             2
                                                                                                                         4                      Rural
 Open hole                    Turkish model Turkish model English model                                     Other    0
                                                                                                                             9
                                                                                                                                                             16
Understanding people’s lives:
        Infrastructure accessibility

                                        Adults using   Mean time taken to reach destination (mins)
                                        or aware of
                                        destination       Total             Urban          Rural

               1   Grocery store           99%             15’                7’            18’
    Nearest

               2   Mobile money agent      18%             31’               18’            45’
P
R              3   Public transport /
                                           67%             37’               11’            49’
O
                   Bus stop
X              4   Bank branch
I                                          10%             45’               30’            70’
M              5
I                  MFI                      9%             46’               24’            58’
T
Y              6
    Furthest

                   ATM                      5%             46’               28’            74’

               7   Informal market         95%             51’               23’            61’
                          7                                                                          17
Understanding people’s lives:
              Communication and technology access/usage

                      Media access in past month                           Usage of communication device

                                                       69                                              44
     Radio                                              70           Mobile phone                                   80
                                                       68                                         31

                                 26                                                          11
 Television                                            68              Taxi phone                 28
                           10
                                                                                         5

                           9
Newspapers                      23                           Computer or laptop or       5
                  4                                                                          14
                                                                   tablet            1
                  4
 Magazines             8                                                             4
                  3                                Total                  Internet           11
                                                                                     1                      Total
                                                   Urban
                  3                                                                                         Urban
   Internet                                        Rural                             2
                       7                                                                                    Rural
              1                                                             Email        6
                                                                                     1
                       7
     Other     2                                                                     1
              0                                                          Land line    4
                                                                                     1

                                                                                                                         18
Summary

 Population profile:
          About three out of four adults reside in the rural areas
          Low educational levels amongst adults
          Low income levels and low formal employment
 Access to infrastructure:
          Access to piped running water is lower in rural areas
          One in three households have an electricity connection
          Accessibility to common formal financial service destinations such as
           banks or ATMs and MFIs is a challenge and much lower in rural areas
           taking most adults more than 30 minutes to reach
 Farming is the most important source of income with over half the adult
  population dependent on income from farming activities
 Most adults are dependent on the informal economy to generate their
  livelihoods leaving very little usage of formal products

                                                                               19
Contents

1. Overview
2. Understanding people’s lives
3. Financial inclusion overview
4. Banking and MFIs
5. Savings and investments
6. Borrowing and credit
7. Insurance and risk management
8. Remittances and mobile money
9. Financial Inclusion Priorities

                                    20
Defining financial inclusion

              Total adult population 18 years and older in Madagascar

Financially included = have/use financial                                         Financially
products and/or services – formal and/or                                          excluded = do not
informal                                                                          have/use any
                                                                                  financial products
                                                                                  and/or services ––
Formally served                              Informally served                    formal and/or
= have/use formal financial products         = have/use financial                 informal
and/or services provided by a                products and/or services
financial institution (bank and/or non-      which are not regulated
bank)

Banked
                                          Served by other formal financial institutions
= have/use financial products/
                                          = have/use financial products/services provided by
services provided by a bank
                                          regulated non-bank financial institutions
regulated by the BCM

                                                                                                       21
Financial inclusion:
Overview

          Formally served             29

                 Banked     12

  Other formal (non-bank)        26

                 Informal                  41

                Excluded                   41

                                                22
Overlaps:
                           “Consumers generally use a combination of financial products and
                           services to meet their financial needs”

                                                                                                    • 2% of adults rely exclusively on
                                                                                                        banking services yet 10% rely
                                                                                                        exclusively on other formal
                                                                                                        mechanisms
                                 Banked                           Other formal
                                                      5.6                                           •   11% use a combination of banked,
                                   1.6                               10.2
                                                                                                        and/or other formal and/or informal
                                                     4.0
                                            0.8                 6.2                                     mechanisms to manage their
                                                                                                        financial needs, thus indicating that
                                                                                                        their needs are not fully met by the
                                                 Informal                                               formal sector alone
                                                   29.8
                                                                                                    •   One third of the adult population
            Excluded 41.8%
                                                                                                        ONLY rely on informal mechanisms
                                                                                                        such as saving in livestock,
                                                                                                        solidarity systems to cover funeral
                                                                                                        risk
                                                                                                                                           23
Note: Due to rounding off numbers of ‘Banked’ and ‘Other formal’ the ‘Excluded’ population is 41%
Financial inclusion:
          Financial Access Strand

 Total        12         17                                30                        41

Urban              26                            28                  15                     31

 Rural    7        12                       35                                  46

Female        12             19                            28                        41

 Male         12        14                            32                             42

         Banked              Other formal (non-bank)            Informal only             Excluded

                                                                                                     24
Financial Consumer Access Strand
            (ranked by excluded)

  Seychelles 2016                                                           94                                                12 3
   Mauritius 2014                                                     85                                                3 2   10
South Africa 2016                                                77                                                 8    3    11
    Rwanda 2016               26                                            42                                 21             11
 Zimbabwe 2014                     30                                        39                        8                 23
  Botswana 2014                              50                                        18             8                  24
  Swaziland 2014                                  54                                   10         9                     27
   Tanzania 2013    14                                      43                               16                         27
       Togo 2016         18                            27                         15                            40
    Zambia 2015               25                       13                    21                                41
Madagascar 2016     12                  17                             30                                      41
     Malawi 2014              27                       7              15                                  51
       DRC 2014     12                       24                       12                               52
Mozambique 2014          20              4             16                                         60

           Banked             Other formal (non-bank)                             Informal only                Excluded

                                                                                                                                     25
Contents

1. Overview
2. Understanding people’s lives
3. Financial inclusion overview
4. Banking and MFIs
5. Savings and investments
6. Borrowing and credit
7. Insurance and risk management
8. Remittances and mobile money
9. Financial Inclusion Priorities

                                    26
Banking and MFI penetration:
   How many adults are banked and using MFIs?

                                                                         MFI
                                     Banked       MFI FinScope        (FinScope
                                                                       current +
                                                                         past)

 Number adults currently using        12%              5%                14%
 product in Madagascar             (1 350 000)      (600 000)         (1 570 000)

 Number of adults not using           88%              95%               86%
 product in Madagascar             (9 900 000)     (10 400 000)   (9 430 000)

 Total adult population             11 million      11 million        11 million

The numbers reported are of those that currently have/use a product

                                                                                    27
Banking:
   What products / services are driving the banked?

Banking products/usage (of those                      Approximate
                                            %
currently banked)                                       number
Current/Cheque account                      29          400 000

Savings book                                23          300 000

Debit card / ATM                            23          300 000

Savings account                             15          200 000

Salary deposit                              8           100 000

Cellphone banking                           8           100 000

Home loan                                   3            40 000

                                                                    28
Banking:
                Drivers and barriers

             12% of adults are banked                                      88% of adults are not banked
      Cash withdrawal from a bank                                      Do not have enough money for
                                                                 29               saving
                                                                                                                          49
                account
                                                                        Do not have regular source of
  Deposit cash into a bank account                          25                     income
                                                                                                                     39

                    Cash a cheque                      17                               Do not need it               37

             Used cash point/ATM                       16                  The places are too far away           36
                                                                        Do not understand how banks
             Get a bank statement                 12                               work
                                                                                                                 35

       Mobile banking transaction             8                             Do not know how to apply             34
Received money from someone in a                                      Do not understand benefits from
                                              7                           having a bank account
                                                                                                                31
          bank account

              Draw a bank cheque          4                                            Do not have job      29
                                                                        Financial accounts are not for
Deposit a cheque into bank account    3                                        people like me
                                                                                                           27
                                                                       Cannot maintain the minimum
                  Paid people/bills   2                                            balance
                                                                                                           26
Money transfers between your own                                       Fear embarrassment or refusals
                                      2                                                                    26
         bank accounts
Money transfer to another person’s                                         It is too expensive to have a
                                      2                                             bank account
                                                                                                           25
          bank account

                                                                                                                               29
Contents

1. Overview
2. Understanding people’s lives
3. Financial inclusion overview
4. Banking and MFIs
5. Savings and investments
6. Borrowing and credit
7. Insurance and risk management
8. Remittances and mobile money
9. Financial Inclusion Priorities

                                    30
Savings and investments:
            Overview – Informal is mainly driven by livestock

                                 Formal savings                    13

                                        Banked          7

                       Other formal (non-bank)          7

                                       Informal                                               33

                          At home / secret place                                    26

Savings Strand

  Total      7     6                   31                     15                             41

          Banked       Other formal (non-bank)     Informal         At home / secret place only    Not saving

                                                                                                                31
Savings and investments:
         Overview – Rural savings are largely informal (livestock)

Urban                18              10           15           13                                 44

 Rural   3       4                     36                          16                                 41

Female       8            6                 28                 15                                 43

 Male        6       6                      33                      15                                40

             Banked           Other formal (non-bank)   Informal        At home / secret place only        Not saving

                                                                                                                        32
Savings and investments:
                    Adults save mainly for medical related expenses and living costs

                      41% of adults save                                        59% of adults do not save

             Non-medical emergency                               34   No money after living expenses                        56
                      Living expenses                           33
                                                                         Do not have an income – no…                   40
        Developmental savings (total)                          32
                     Medical expenses                         30              Never thought about it              15
                      Buying livestock                   15           Do not know about investments…          8
              Education or school fees              10                 Prefer to invest in other things       7
                           Buying land             9
                                                                         I do not have a bank account         7
      Funeral expenses when needed                8
    Improving or renovating dwelling              8                      Do not have payslip / cannot…        6
   Providing something for my family…            7                    Prefer to spend money on other…     4
Buying or building a dwelling to live in         7
                                                                       My children will look after me     4
           Buying farming equipment              7
            Buying farming expenses             6
                                                                                  I save in other ways    4
         Buying household appliances        4                           It is too expensive to open an…   4
   Buying a dwelling or land to let out     4                                          Do not want it     2
   Starting or expanding my business        4
                                                                                        Do not need it    2
                            A wedding      3
               Traditional ceremonies      3
                                                                         I won’t be able to access my…    2
                                 Other             10                                           Other     4

                                                                                                                             33
Contents

1. Overview
2. Understanding people’s lives
3. Financial inclusion overview
4. Banking and MFIs
5. Savings and investments
6. Borrowing and credit
7. Insurance and risk management
8. Remittances and mobile money
9. Financial Inclusion Priorities

                                    34
Borrowing and credit:
          Overview

                                 Formal credit                5

                                       Banked         2

                       Other formal (non-bank)            3

                                       Informal                   6

                               Family / friends                                              22

Credit Strand

  Total   2 3      6              20                                            69

          Banked            Other formal (non-bank)           Informal   Family / friends only    Not borrowing

                                                                                                                  35
Borrowing and credit:
          Overview

 Urban      4    4   5            17                                   70

  Rural 1 2      6               22                                     69

Female 1 3       6              21                                      69

 Male     2 3    6              19                                     70

        Banked           Other formal (non-bank)   Informal   Family / friends only   Not borrowing

                                                                                                      36
Borrowing and credit:
   Borrowing mechanisms

   Borrowing mechanism (of those          Approx.    Total
                                                             Urban   Rural
   currently borrowing)                   number      %

Borrow from friends/family               2 500 000   73%     62%     77%

Borrow from MFI                           320 000    10%     13%      8%
Borrow from bank (all credit products from
                                           180 000    5%     13%      3%
bank)
Borrowing from employer / colleague       150 000     4%      4%      4%
Got goods in advance from agricultural
                                           78 000     2%       -      3%
buyer

Borrow from money lender                   45 000     1%      1%      2%

Borrow from savings group                  40 000     1%       -      1%

                                                                             37
Borrowing and credit:
               Adults mostly borrow for cover day-to-day expenses

       31%        have borrowing/credit products                                          69%        do not borrow

                    Living expenses                        40        I do not want to have debt                             29
                  Medical expenses                    19                 Never thought about it                             28
          Non-medical emergency                      16               Do not know about loans                          13
                     Pay for utilities           7                                Do not need it                       13
Starting or expanding my business                7               Do not know how to get a loan                        11
                   Funeral expenses          5                                   I earn too little                10
          Buying farming expenses            5                                  Can not afford it                 10
                    Buying livestock         4                           The interest is too high                 9
        Buying farming equipment             4                                      Unemployed                    9
      To take care of sick relative(s)   3                        Do not have a regular income                    9
             Traditional ceremonies      2                                          Fear of debt              7
      Buying household appliances        2                                     Insufficient salary        5
Buying/building a dwelling to live in    2
                                                                Do not have financial statement        4

  Improving/renovating a dwelling        2
                                                                           I do not have pay slip      4

                         Buying land     2
                                                                    I do not have a statistic card    3
                                                                     Bad experience in the past       3
                     Paying off debt     1
                                                                                           Other                      11
                               Other             7

                                                                                                                                 38
Contents

1. Overview
2. Understanding people’s lives
3. Financial inclusion overview
4. Banking and MFIs
5. Savings and investments
6. Borrowing and credit
7. Insurance and risk management
8. Remittances and mobile money
9. Financial Inclusion Priorities

                                    39
Insurance and risk management:
            Overview

                                            Insured                                         8

                          Other formal (non-bank)                 3

                                           Informal                    4

                                 Insured indirectly       1

Insurance Strand

    Total    3    4 1                                             92

                 Other formal (non-bank)          Informal only        Insured indirectly       Not insured

                                                                                                              40
Insurance and risk management:
        Drivers and barriers

      8% of adults have insurance              92%     of adults do not have any kind of
                                                    financial product covering risk

Of those insured uptake of insurance
                                                Main barrier to the uptake of insurance:
products is driven by:
• Solidarity system                    41%
                                               • Do not know enough about insurance 20%
• Motor vehicle insurance               27%    • Do not know how insurance works 17%
• Pension fund                         16%     • Cannot afford it                       16%
• Medical aid / health fund            10%     • Do not want it                         12%
• Life assurance                       7%      • Unaware of insurance                   12%
• Accident or travel cover             4%      • Nothing to insure                       9%

  Of those without insurance (95%):
                                                                     **LITERACY**
  •   49% agreed there are other ways to protect oneself against risk
  •   85% are not aware of medical or health insurance
  •   84% are not aware of life assurance
  •   63% are not aware of motor vehicle insurance
                                                                                          41
Contents

1. Overview
2. Understanding people’s lives
3. Financial inclusion overview
4. Banking and MFIs
5. Savings and investments
6. Borrowing and credit
7. Insurance and risk management
8. Remittances and mobile money
9. Financial Inclusion Priorities

                                    42
Remittances:
              Overview of those that claimed to remit in the past 12 months

                               Formal remittances                                        17

                                          Banked         2

                       Other formal (non-bank)                                           17

                                        Informal             3

                                  Family / friends                           12

Remittances Strand

 Total    2       15       2      10                                    71

         Banked        Other formal (non-bank)       Informal    Family / friends only        Do not remit

                                                                                                             43
Remittances and Mobile money

• 21% of adults received money while 16% sent money in the last
  12 months
• More females receiving money (24%) than males (18%)
• 29% of adults remitted within Madagascar and only 2%
  remitted outside

• 13% of adults own mobile money services while 17% use
  mobile money services
Of those who use mobile money services (17%):
 • 80% use it to remit
 • 73% transact through mobile money (pay utility bills, buy
    airtime, etc.)
 • 12% use it to keep money
                                                               44
Mobile Money:
                Drivers and barriers

            17%      use Mobile Money Services               83% do not use Mobile Money Services

                                                               Do not have a cell phone                           46
         It is convenient                          61
                                                         I do not have money to send or
                                                                                                             24
                                                                     receive
                                                              Have not thought about it                      24
                  I trust it                  40
                                                                 Do not have a sim card                 18
                                                        Do not have enough information
                                                                                                   13
               It is cheap               34                         about it
                                                                          Cannot use it        8
     It is the only one                                     There are no mobile money
                                    14                                                     6
   accessible in the area                                        dealers in my area
                                                         Do not have access to a mobile
                                                                                           5
                                                                phone network
Suitable for clearing bills    6                                       It is complicated   4
                                                           I am not interested in mobile
                                                                                           4
                                                                      money
                    Other          11                                             Other        8

                                                                                                                  45
Financial inclusion:
Landscape of Access
(of those with any financial product)

                                        Transactions
                                                   30

                 Remittances                                        Savings
                           32                                       74

                                 11                         18
                            Insurance                      Credit

   The Landscape of Access is used to illustrate the extent to which financially included
   individuals have/use financial products/services (excluding those borrowing from
   family/friends and those who save at home/hiding in secret place)

                                                                              46
Financial inclusion:
Regional level analysis
 Anamalanga (42%), Analanjirofo (41%) and Vakinankaratra (37%) are the most
  formally included regions with Analanjirofo being the highest proportion of
  adults with other formal (non-bank) products

 The regions of Bongolava (18%), Vakinankaratra (25%) and Itasy have the lowest
  excluded population proportions mainly driven by informal product uptake

 The highest excluded population proportions are in the regions of Sava (60%),
  Androy (62%) and Sofia (66%)

 Credit uptake is higher in the regions of Itasy (52%) and Vakinankaratra (51%) with
  higher formal borrowing in Vakinankaratra (10%) and higher borrowing from
  friends/family (45%) in Itasy

 Savings are higher in the regions of Bongolava (84%) and Vatovavy Fitovinany
  (75%) driven mainly by informal savings in livestock in Bongolava
Contents

1. Overview
2. Understanding people’s lives
3. Financial inclusion overview
4. Banking and MFIs
5. Savings and investments
6. Borrowing and credit
7. Insurance and risk management
8. Remittances and mobile money
9. Financial Inclusion Priorities

                                    48
Financial Inclusion Priorities

1.   Continued enabling regulatory environment and introduction of low cost ‘no-frills’
     account to deepen bank reach to better meet needs

2.   Mobile money as tool to increase reach of formal services – 80% of those that use
     mobile money use it to remit - extend financial services to extend savings,
     insurance and credit amongst other transactional usage such as payments

3.   Savings is the biggest driver of financial inclusion in Madagascar largely driven by
     informal mechanisms and those not using financial products to save

4.   Insurance to better manage impact of risks - insurance is driven by funeral cover
     largely through solidarity systems which in fact are not financial products

5.   Consumer education and financial literacy are real issues in Madagascar –
     interaction with products and insurance is encumbered are largely financial
     illiteracy and low income levels

                                                                                            49
Thank you
   pregar@finmark.org.za
  obertm@finmark.org.za
kingstonem@finmark.org.za

   www.finmark.org.za
You can also read