First 12 years of tardigrade succession in the young soils of a quickly evolving ecosystem
←
→
Page content transcription
If your browser does not render page correctly, please read the page content below
Zoological Journal of the Linnean Society, 2020, 188, 887–899. With 6 figures.

First 12 years of tardigrade succession in the young soils
of a quickly evolving ecosystem
JANA BINGEMER1,2*, MARTIN PFEIFFER2,3 and KARIN HOHBERG1

                                                                                                                             Downloaded from https://academic.oup.com/zoolinnean/article-abstract/188/3/887/5697459 by guest on 16 May 2020
1
  Senckenberg Museum of Natural History Görlitz, Am Museum 1 (Marienplatz), Görlitz, Germany
2
  University of Bayreuth, Department of Biogeography, Universitätsstrasse 30, 95447 Bayreuth, Germany
3
  Helmholtz Centre for Environmental Research, Department Aquatic Ecosystems Analysis and
Management, Brückstraße 3a, 39114 Magdeburg, Germany

Received 3 September 2018; revised 14 November 2019; accepted for publication 18 November 2019

Open-cast coal-mining creates a severe disturbance of ecological systems, resulting in post-mining areas that have
lost their soils entirely and are exposed to extreme conditions. Nonetheless, these areas allow us to investigate the
process of primary succession. We studied the first 12 years of soil tardigrade succession at ‘Chicken Creek’, an
experimental site within the open-cast coal-mining area in Welzow Süd, Germany. A total of ten tardigrade genera
and 13 species or species groups were identified at the site. Over time, the organic carbon content, proportion of
silt and nutrient availability in the soil increased, and the soil particle size distribution and pH value changed
significantly. The vegetation cover and nematode abundance increased, whereas tardigrade densities peaked in 2008
and decreased thereafter, as did their mean body size. Species replacement was obvious within this 12 year study
period, and tardigrade species diversity increased, indicating that ecological niche diversity also increased throughout
this time. Vegetation cover, soil particle size distribution and time were the most important factors influencing the
tardigrade community. We also discuss further potential factors and the ability of terrestrial tardigrades to persist
despite many environmental constraints, such as fluctuations in pH and moisture, and to colonize new habitats
faster than most other animal groups.

ADDITIONAL KEYWORDS: Apodibius confusus – community assembly – ecological niche – ecosystem
development – morphometry – post-mining area – primary succession – redundancy analysis – species turnover
– succession – Tardigrada.

                    INTRODUCTION                                   and humidity, and sometimes by high pollution
                                                                   levels (Bröring & Wanner, 2007; Wöllecke et al.,
Since the end of the 19 th century, brown coal has
                                                                   2007; Elmer et al., 2013). The new fills of the mining
been mined extensively in eastern Germany. Driven
                                                                   sequence are almost free of organic matter, humus or
by technical developments, up to 20 million tons of
                                                                   soil organisms (Wanner et al., 2007; Wöllecke et al.,
coal per year are extracted from depths between 90
                                                                   2007), and the ecosystem is at ‘ground zero’ of its
and 130 m (Vattenfall, 2013). After mining, during
                                                                   development (Wöllecke et al., 2007; Gerwin et al.,
rehabilitation of the area, the original sequence of soil
                                                                   2009; Elmer et al., 2013). Usually, after dumping
layers cannot be maintained, resulting in the loss of
                                                                   and restoration, post-mining areas receive some
active, nutrient-rich top soils, which are replaced by
                                                                   renaturation measures, such as amelioration and
sterile, usually sandy subsoils (Pflug, 1998; Wanner
                                                                   sometimes also afforestation, in order to accelerate
et al., 2007). Thus, the open-cast mines result in
                                                                   their development into functional and profitable soils.
extreme disturbance of ecosystems and leave behind
                                                                   However, some experimental sites, such as ‘Chicken
areas that are characterized not only by a lack of soils
                                                                   Creek’, the site of the present study, have been left
and nutrients, but also by extreme environmental
                                                                   without any renaturation measures, in order to
conditions, such as strong fluctuations in temperature
                                                                   enable studies on natural soil formation and biological
                                                                   processes, such as colonization and succession of soil
*Corresponding author: E-mail: janabingemer@googlemail.com         fauna, undisturbed by humans from the beginning of

© 2020 The Linnean Society of London, Zoological Journal of the Linnean Society, 2020, 188, 887–899                  887
888    J. BINGEMER ET AL.

ecosystem development (Dunger et al., 2001; Hohberg,             Recent studies have continued to focus on
2003; Bröring &Wanner, 2007).                                 tardigrades in mosses and lichens, which means that
   Protists, algae, fungi, nematodes, rotifers and small      comparatively little is known about the tardigrade
numbers of microarthropods, all of which are likely           communities in the soil, their ecological demands
to be dispersed primarily via wind, colonize the soil         and, vice versa, their influence on the ecosystem. The
almost immediately (Wanner et al., 1998; Nkem et al.,         influence of environmental factors on the development
2006; Lehmitz et al., 2011, 2012). Soil genesis and the       of terrestrial tardigrade populations has not yet
development of soil functions are guided and promoted         been thoroughly investigated (e.g. Harada & Ito,
by soil fauna (Wanner et al., 2007). Among other things,      2006; Hohberg, 2006; Guil et al., 2009, 2015; Nelson
soil fauna acts as a regulator of primary decomposers,        & Bartels, 2013). A better understanding of these

                                                                                                                               Downloaded from https://academic.oup.com/zoolinnean/article-abstract/188/3/887/5697459 by guest on 16 May 2020
such as fungi and bacteria, and is the key component          relationships might also enable the use of tardigrades
that determines their growth and distribution (Scheu          as bio-indicators. Their value in indicating heavy
et al., 2005; Wardle et al., 2004). The development of        metals or gases, such as SO2 and NO 2, has already
soil food webs has been investigated intensively at           been demonstrated (Leetham et al., 1982; Nelson
post-mining sites in eastern Germany (Dunger et al.,          et al., 2015).
2001; Hohberg, 2003, 2006; Dunger et al., 2004). The             In this study, the succession of the tardigrade
initial communities, consisting of bacterial, fungal          community in regenerating a post-mining area was
and algal feeders, are increasingly supplemented by           investigated. Within the framework of the Deutsche
herbivores and omnivores and, later, also by predatory        Forschungsgemeinschaft (DFG) Collaborative
species (Hohberg et al., 2011a).                              Research Centre Transregio 38, other soil animal
   Tardigrades are found in soils predominantly during        groups, such as Nematoda, Oribatida, Gamasina,
the early stages of primary succession (Hohberg,              Actinedida and Collembola, were also considered.
2006; Hohberg et al., 2011a, b). For a long time, it          In this study, abiotic factors and tardigrades were
was assumed that terrestrial tardigrades occur only           analysed over a period of 12 years, starting from point
in mosses, lichens and leaf litter (Marcus, 1929). The        zero of ecosystem development, only days after the
soil pore system as a habitat has been questioned for         site was dumped by the mining company, thus the
decades. It is only during the last 50 years that soil        study builds on the work and data of Hohberg et al.
zoologists have investigated this in more detail (see         (2011a). Abiotic and biotic factors were considered
e.g. Iharos, 1969; Hallas & Yeates, 1972; Anderson            both individually and in context. The aim of our study
et al., 1984; Ito & Abe, 2001; Hohberg, 2006; Nelson &        was to investigate whether and how environmental
Bartels, 2013) and have revealed that a large number          factors might influence the development of tardigrade
of tardigrade species occur in soil (Guil et al., 2015;       populations.
Bingemer & Hohberg, 2017).                                       The intensive study was driven by questions of
   Unlike marine and limnic habitats, terrestrial             general tardigrade ecology, such as the influence of
habitats regularly dry up or freeze in colder periods.        the environment on tardigrades, and community
Most limnoterrestrial tardigrades can survive both            ecology. This long-term investigation allowed us
in the state of cryptobiosis, whereby a distinction is        to answer questions regarding pioneer tardigrade
made between drying out and formation of the tun              species and their ecological niches, species turnover
state (anhydrobiosis) or direct freezing without prior        during succession and species assembly in tardigrade
drying out (cryobiosis) (Bertolani et al., 2004; Guidetti     communities.
et al., 2011; Nelson et al., 2015). Other unfavourable
environmental conditions, such as food shortage or
changes in the abiotic environment, can be tolerated                       MATERIAL AND METHODS
by the formation of cysts (Bertolani et al., 2004;
Guidetti et al., 2011; Nelson et al., 2015). The animals                     Study site and fieldwork
are probably distributed by wind (Nelson et al., 2015),       The study site is called ‘Chicken Creek’ and is located
which allows parthenogenetic species to develop a             in the Welzow Süd open-cast mine near Spremberg,
population from a single animal that has immigrated to        Brandenburg. The experimental area was built in 2005
a new site. Parthenogenesis is the most common form of        on 6 ha specifically for succession research by the DFG
reproduction among limnoterrestrial species, but there        Collaborative Research Centre 38. Orientation and
are also some bisexual and a few hermaphroditic species       sampling on the site were carried out with the aid of
(Bertolani, 2001). In combination with cryptobiotic           a permanent grid of 20 m × 20 m, whose corner points
stages and asexual reproduction, tardigrades can              are permanently marked and numbered.
easily colonize new habitats and are often found in             For zoological sampling, the site had been divided
young soils (Hohberg, 2006; Hohberg et al., 2011a).           into 3 m × 3 m subareas, and on every sampling date,

                         © 2020 The Linnean Society of London, Zoological Journal of the Linnean Society, 2020, 188, 887–899
SUCCESSION OF TARDIGRADES IN YOUNG SOILS 889
each of these areas was sampled randomly, with three 5 g of air-dried soil was sieved to 2 mm and dried
soil samples taken from three different grid points overnight at 105 °C in a drying oven (UM500; Memmert,
per area. Thus, altogether, 27 soil samples evenly Schwabach, Germany). The dry weight was determined
distributed in the area were taken on each sampling immediately afterwards. The organic content
date. In 2005, soil samples were taken in October; in was annealed in a muffle furnace (LT24/11/B180;
2006, the sampling took place in May. From 2007 to Nabertherm GmbH, Lilienthal, Germany) at 550 °C
2010, samples were taken twice a year in May and for 3 h, then samples were cooled to room temperature
October. Given that succession slows down with time, in a desiccator, and the annealing loss was determined
from 2011 only October samples were taken, and the gravimetrically. The carbon and nitrogen content of
tardigrade fauna was investigated every second year 5–10 µg finely ground soil was determined in a CNS
Downloaded from https://academic.oup.com/zoolinnean/article-abstract/188/3/887/5697459 by guest on 16 May 2020
until October 2017. Each time, the samples were device (Vario PyroCube; Elementar Analysesysteme
taken in the morning. In total, 378 soil samples were GmbH, Langenselbold, Germany). To assess soil
collected throughout the 12 years of the experiment particle size, ~5 g of air-dried soil of each sample was
(27 samples × 14 samplings). sieved to 2 mm and solved in 30 mL of water. Organic
Litter and above-ground vegetation were removed, substances were removed by application of 30 mL of
and the upper 5 cm of the soil was sampled using a 30% hydrogen peroxide solution. The reaction mixture
soil corer (diameter, 3.6 cm; circular surface area, was heated overnight in a sand bath until the chemical
10 cm2) and transferred into plastic bags for transport reaction had completely subsided and foam production
to the laboratory. Given that tardigrade distribution stopped. Mineral residues were flocculated by adding
in substrates is aggregated (Degma et al., 2011), 25 mL calcium chloride solution. Samples were filled
every soil sample was cautiously homogenized in the with water to ~250 mL and left to stand until the
laboratory before it was divided into two parts: from supernatant liquid became clear. This supernatant was
one part, the microfauna (nematodes and tardigrades) then decanted and removed. The soil particle size of
were extracted (starting on the sampling day) and each soil sample was measured three times in a LS-13
analysed, whereas the remaining part was used for 320 laser diffraction device for particle size analysis
the analysis of the environmental variables (soil (Beckman Coulter, Brea, CA, USA), and results were
moisture, pH, particle size distribution and C and N averaged. The following fractions were distinguished:
contents). Accordingly, soil faunal and environmental < 0.6 µm, medium clay; < 2.0 µm, coarse clay; < 6.3 µm,
parameters were derived from the same soil sample. fine silt; < 20 µm, medium silt; < 63 µm, coarse silt;
< 200 µm, fine sand; < 630 µm, medium sand; and
< 2000 µm, coarse sand.
Determination of environmental factors The vegetation cover of each sample area was
In 2005, the abiotic conditions at all grid points estimated on the basis of photographs of the grid
were determined by the Brandenburgische points. The classification was based on the following
Technische Universität Cottbus. In the following scale: 0%, none; 10%, minimal/soil crust; 20%, single
years, measurements on the soil samples of the plant stems; 50%, about half covered; 75%, almost
respective investigated grid points were carried out completely covered; and 100%, fully covered by plants.
by Senckenberg soil zoologists. The following abiotic
data were analysed in the laboratory along with
biotic extraction: pH, soil moisture, vegetation cover Microfauna extraction, counting and
and C/N ratio, organic carbon content and grain size tardigrade species determination
distribution, in the years 2011, 2013, 2015 and 2017. In The aquatic microfauna (primarily nematodes,
some years, we were not able to obtain the abiotic data tardigrades and rotifers) were extracted from ~50 g
(pH in autumn 2007, both samplings in 2008, spring of every soil sample for 5 days (initiated on the
2009; C/N in the years 2006–2008; organic carbon sampling day) using a modified Baermann technique
content in the years 2006–2010), thus they cannot (Decker, 1969). After 3 days, the first representatives
be presented. The vegetation cover was analysed for of the microfauna were removed from the funnels and
every sampling except for spring 2007. killed by heat at 60 °C to minimize the influence of
For the determination of pH, 10 g of air-dried soil predators on the quantity and species composition
was sieved to 2 mm and dissolved in 25 mL 0.1 M KCl. of the microfauna. On day 5, the extraction was
The pH value was measured with a pH meter (HI2210; completed. The microfauna yields of days 3–5
Hanna Instruments, Woonesocket, RI, USA). Soil were combined, and three drops of a formalin–
moisture was determined gravimetrically (as water triethanolamine mixture (4.9% formalin and 1.5%
per gram of dry soil) from the microfauna samples. concentrated triethanolamine) were added to fix
The organic carbon content of each soil sample was and preserve the samples. For long-term storage, the
assessed according to DIN ISO 10694. Approximately samples were maintained at 4 °C.
© 2020 The Linnean Society of London, Zoological Journal of the Linnean Society, 2020, 188, 887–899890 J. BINGEMER ET AL.
To determine the abundance of the different Simpson diversity was calculated as follows:
microfauna groups, each sample was transferred 2
S
individually to a ‘µ-Slide’ slide chamber (Ibidi, D = 1/ pi 2
i =1
Martinsried, Germany), and tardigrades and
Species turnover (beta diversity) was calculated
nematodes were counted at ×100 magnification under
with the classic Jaccard sample similarity index,
an inverted microscope (DMI 3000B; Leica, Wetzlar,
considering presence and absence of species, and the
Germany). All tardigrades were then sampled from
Chao–Jaccard–Raw abundance-based similarity index
the slide chamber with an extended glass pipette,
(Chao et al., 2005), which takes species abundances
prepared in Faure’s medium on permanent slides and
into account.
determined to species or, where not possible, to genus
The classic Jaccard sample similarity index was
Downloaded from https://academic.oup.com/zoolinnean/article-abstract/188/3/887/5697459 by guest on 16 May 2020
level, at ×1000 magnification under a microscope (DM
2500; Leica) following Ramazzotti & Maucci (1983), calculated as follows: Jclas = S1 + SS212− S12 , with S1 being
Dastych (1988), Bingemer & Hohberg (2017), several the number of species in sample 1, S2 the number of
keys for specific genera or species groups (Morek et al., species in sample 2 and S 12 the number of species
2016; Kaczmarek & Michalczyk, 2017; Kaczmarek shared between samples 1 and 2.
et al., 2017) and numerous species descriptions and The Chao–Jaccard–Raw abundance-based similarity
redescriptions (e.g. Pilato & Binda, 2003; Lisi et al., index (Chao et al., 2005) was calculated as follows:
UV
2016; Stec et al., 2018). Jabd = U+V−UV , with U and V representing the total
For each tardigrade, body length was measured abundances of the shared species in samples 1 and 2,
from the head to the end of the body, excluding the respectively. Thus, both indices reach one for identical
hindlegs, using an eyepiece micrometer. The mean assemblages and tend to zero for disjoint samples.
body size of the tardigrades was calculated from all Statistical analyses were performed using PAST
specimens observed, for the years 2011, 2013, 2015 and (Paleontological Statistics v.3.19; Hammer et al.,
2017. All permanent slides are preserved, numbered 2001) and R (v.3.3.1; 21 June 2016 – ‘Bug in Your Hair’
and catalogued in the tardigrade collection of the Copyright © 2016 The R Foundation for Statistical
Senckenberg Museum of Natural History Görlitz and Computing Platform). All statistical analyses and
can be reviewed at any time. respective graphs were computed in PAST, using non-
parametric statistics (Kruskal–Wallis test, Spearman
correlation and Mann–Whitney U-test) that can be
applied to data that have at least ordinal distributions.
Data handling and statistics
The redundancy analysis (RDA) was performed in R
Given that only a part of the original soil sample (Vegan: community ecology package; R package v.2.46),
was placed in the Baermann funnel, the number with forward selection of variables; and the mapping
of individuals of each microfauna group was then of the RDA was created with STATISTICA (v.13;
extrapolated to the total mass per soil sample and TIBCO Software). Redundancy analysis combines
via the known sample surface (10 cm2) to numbers of regression and principal components analysis to model
individuals per square metre. multivariate response data. We used a Hellinger
The diversity of the tardigrade fauna of all soil transformation of species data, which makes RDA
samples of a given year was determined from yearly an extremely powerful tool for ecological analysis of
means of the 27 samples. To ensure comparability, community composition data tables (Borcard et al.,
only samples from October were compared. In 2006, 2011). It shares many characteristics with canonical
samples were taken in April only; therefore, we did correspondence analysis, which is an older method for
not include these data. For calculations of diversity similar problems that has some drawbacks related to
measures, Hill numbers (Jost, 2006), which comprise its distance measure, the impact of rare species on the
species richness ( 0D), Shannon diversity ( 1D), the ordination and trouble with a proper calculation of r2
exponent of the Shannon index and Simpson diversity (for details, see Borcard et al., 2011 and literature cited
(2D), the inverse of the Simpson concentration, were therein).
used. In contrast to the formerly used Shannon index, Given that environmental data (Env) were
H′, all these diversity measures are linear. incomplete and differed in number from the
The Shannon diversity was calculated as follows: tardigrade samples, RDA was performed several
S
times with datasets that varied in record and variable
1
D = exp (H ) = exp(− pi × lnpi ), where p i is the numbers. All factors were analysed using only 44
i=1
proportion of species i of the total number of individuals records, whereas for subset A of Env (including time,
N; therefore, pi = Ni /N , and S is the total number of vegetation cover, nematodes, soil moisture and C/N
species. ratio) we used 88 records, and in subset B (including
© 2020 The Linnean Society of London, Zoological Journal of the Linnean Society, 2020, 188, 887–899SUCCESSION OF TARDIGRADES IN YOUNG SOILS 891
time, vegetation cover, nematodes and soil moisture) Diphascon, Eremobiotus, Hypsibius, Isohypsibius,
we calculated with 151 records that were related to Milnesium, Macrobiotus, Paramacrobiotus and
the corresponding tardigrade samples. The significant Ramazzottius) in 2017, with Diphascon, Eremobiotus
factors were the same in all calculations; therefore, we and Hypsibius in more-or-less identical numbers (Fig.
present only the results calculated with subset B. Time 2). The genus Hypsibius and macrobiotid species were
was recorded as the number of months since the start present continuously throughout the study period
of the experiment in 2005. (with the exception of 2007), but with low densities
(Fig. 2).
Diversity, calculated as Hill numbers, increased
continuously and had reached its present maximum
RESULTS
Downloaded from https://academic.oup.com/zoolinnean/article-abstract/188/3/887/5697459 by guest on 16 May 2020
in the years 2016/2017 (Fig. 3). In 2010 there was
A total of 13 tardigrade species or species groups, an exceptional rise, represented both by Simpson
representing ten genera, were identified in the site and Shannon diversity indices, but not in species
(Table 1). Within the present study, we investigated numbers. These results indicate a greater evenness of
~35 000 tardigrade specimens that were extracted the communities owing to the lowered dominance of
from 378 soil samples (14 sampling dates × 27 soil A. confusus.
samples, each ~10 cm2). Overall, tardigrade densities Species turnover differed strongly between years
increased until 2008 and then started to decline (Table 2). Considering only the presence and absence
(Fig. 1). Apodibius confusus Dastych, 1983 was the of species, the Jaccard index ranged between 0.00
dominant species, but its densities collapsed in 2009 and 0.80 (mean = 0.32, SD = 0.14), and the Chao–
(Fig. 1). In April 2007, no tardigrades were found in Jaccard–Raw abundance-based similarity index,
any of the samples. Apodibius confusus first appeared which accounts for the abundance of the species,
in October 2007, with a sharp increase in abundance varied between 0.00 and 0.99 (mean = 0.41, SD = 0.30),
in April 2008 and a mean maximum of 350 individuals with both indices ranging between 0.00 and 1.00, the
per 10 cm2 in October 2008. Tardigrade species other latter indicating identity of the samples. With time,
than A. confusus were already present on the site at the tardigrade communities became more and more
beginning of the study, and their abundance increased similar. Tardigrade body length decreased, while the
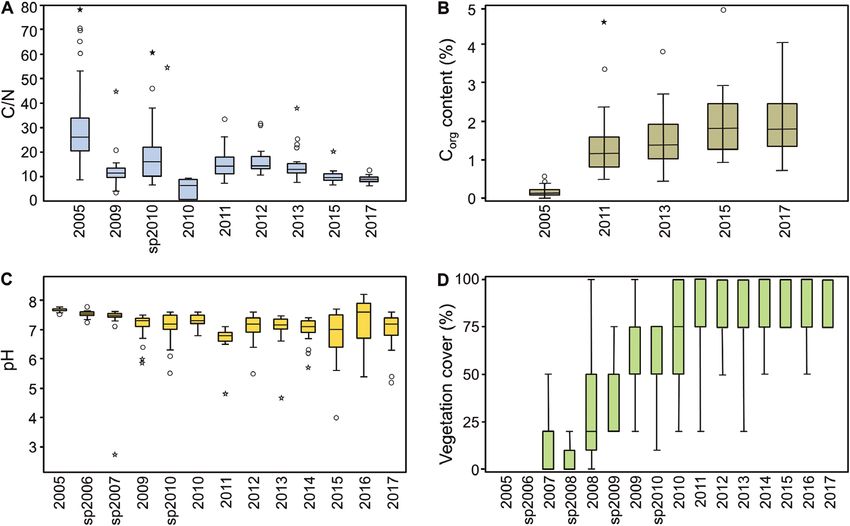
from May 2009 (Fig. 1). From October 2010, for the first proportion of silt increased and the proportion of sand
time, their densities exceeded the declining numbers decreased (Fig. 4).
of the previously dominant A. confusus (Fig. 1). In general, the abiotic environment at ‘Chicken
Among the species other than A. confusus, the Creek’ changed considerably throughout the years. The
genera Isohypsibius and Hexapodibius predominated C/N ratio became lower during the observation period
in 2009 and 2010, and these, in turn, were replaced by (Fig. 5A; Kruskal–Wallis test: H = 59.3, P < 0.001), the
Eremobiotus [Eremobiotus alicatai (Binda, 1969)] from organic carbon content increased continuously (Fig.
2011 onwards (Fig. 2). Diversity at the genus level 5B; Kruskal–Wallis test: H = 178.1, P < 0.001), and the
increased over the years under study, from a single pH value of the soil became much more diverse (Fig.
genus (Hypsibius) in 2005 to nine genera (Apodibius, 5C; Kruskal–Wallis test: H = 144.3, P < 0.001). The
Table 1. Tardigrade taxa found in the ‘Chicken Creek’ from 2005 to 2017
Family Subfamily Genus Species
Milnesiidae Milnesium tardigradum group (sensu Michalczyk et al., 2012)
Hypsibiidae Diphasconinae Diphascon higginsi Binda, 1971
nobilei (Binda, 1969)
Hypsibiinae Hypsibius cf. convergens (Urbanowicz, 1925)
Ramazzottidae Ramazzottius aff. oberhaeuseri (Doyère, 1840)
Hexapodibiidae Hexapodibius micronyx Pilato, 1969
Isohypsibiidae Apodibius confusus Dastych, 1983
Eremobiotus alicatai (Binda, 1969)
Isohypsibius dastychi Pilato, Bertolani & Binda, 1982
cf. prosostomus Thulin, 1928
tuberculatus (Plate, 1889) group
Macrobiotidae Macrobiotus hufelandi C.A.S. Schultze, 1834 group
Paramacrobiotus richtersi (J. Murray, 1911) group
© 2020 The Linnean Society of London, Zoological Journal of the Linnean Society, 2020, 188, 887–899892 J. BINGEMER ET AL.
400 9
other species
Apodibius confusus
350 8
Mean tardigrade densities [individuals per 10 cm²]
species richness
7
300
6
Number of species
250
Downloaded from https://academic.oup.com/zoolinnean/article-abstract/188/3/887/5697459 by guest on 16 May 2020
5
200
4
150
3
100
2
50 1
0 0
Oct May Apr Oct Apr Oct May Oct Apr Oct Oct Oct Oct Oct
05 06 07 07 08 08 09 09 10 10 11 13 15 17
Figure 1. Mean tardigrade densities (N = 27) and overall numbers of species from 2005 to 2017. In 2007, tardigrades were
absent in all soil samples.
vegetation cover increased almost linearly between with vegetation cover (Spearman correlation,
2006 and 2010, and from 2009 onwards there was no rs = 0.74, P < 0.001), no correlation was found for the
sampling point without vegetation (Fig. 5D; Kruskal– total number of tardigrades (Spearman correlation,
Wallis test: H = 250.5, P < 0.001). r s = 0.03, P = 0.640). However, more differentiated
Vegetation cover and time were the most important analyses at the species level showed that individual
factors impacting the tardigrade community, whereas species behaved differently (RDA; Fig. 6). Apodibius
other factors had little effect (Fig. 6). To analyse the confusus was the only tardigrade species negatively
influence of different environmental factors on the correlated with vegetation (Spearman correlation,
tardigrade community at the sample sites, several rs = −0.17, P < 0.001), i.e. its densities decreased with
RDA approaches were taken. The best result was increasing vegetation cover. Eremobiotus alicatai was
achieved with the variables time (measured in months the species with the strongest positive correlation
from the start of the experiment), full vegetation with vegetation cover (Spearman correlation, rs = 0.33,
cover and 75% vegetation cover, which were chosen by P < 0.001). There was also a significant positive
forward selection (Fig. 6). Here, 31% of the variance correlation between the abundance Hypsibius cf.
in the tardigrade data (occurrence of the 13 species convergens (Urbanowicz, 1925) and Isohypsibius spp.
or species groups) were explained by the variables and vegetation cover (both: Spearman correlation,
(RDA, F = 23.188, P < 0.001, adjusted r2 = 0.307; RDA rs = 0.14, P < 0.001).
axis 1, F = 66.040, P < 0.001; RDA axis 2, F = 2.983,
P = 0.046). Significant factors were selected in the
following sequence: (1) time (F = 55.764, P = 0.002,
DISCUSSION
adjusted r 2 = 0.267); (2) full vegetation cover
(F = 5.528, P = 0.002, cumulative r2 = 0.289); and (3) Although tardigrades are common worldwide, they
75% vegetation cover (F = 4.912, P = 0.005, cumulative do not appear to be distributed evenly, but little is
r2 = 0.307) (Fig. 6). known about the occurrence of terrestrial species
Additionally, the influence of vegetation cover (Nelson et al., 2015). In the present study, a total of
was investigated by means of a correlation analysis. 13 tardigrade species or species groups were recorded
Although nematode density was strongly correlated from the young soils of a German open-cast post-mining
© 2020 The Linnean Society of London, Zoological Journal of the Linnean Society, 2020, 188, 887–899SUCCESSION OF TARDIGRADES IN YOUNG SOILS 893
25
Mean tardigrade densities [individuals per 10 cm²]
20
15
Downloaded from https://academic.oup.com/zoolinnean/article-abstract/188/3/887/5697459 by guest on 16 May 2020
10
5
0
Oct May Apr Oct Apr Oct May Oct Apr Oct Oct Oct Oct Oct
05 06 07 07 08 08 09 09 10 10 11 13 15 17
Isohypsibius spp. Eremobiotus alicatai
Hypsibius cf. convergens Hexapodibius micronyx
Paramacrobiotus/Macrobiotus spp. Diphascon spp.
Ramazzottius aff. oberhaeuseri Milnesium spp.
Figure 2. Mean densities of specific tardigrade taxa (N = 27), except Apodibius confusus, from 2005 to 2017. In 2007,
tardigrades were absent in all soil samples. Tardigrade species are summarized at the genus level. In some cases, only one
species of a genus was present.
Species richness Shannon diversity Simspon diversity
10 5
Shannon and Simspon diversity
8 4
Species number
6 3
4 2
2 1
0 0
2005
2006
2007
2008
2009
2010
2011
2012
2013
2015
2016
2017
2014
Figure 3. Species richness (0D), Shannon diversity (1D) and Simpson diversity (2D) of the tardigrade communities within
the 27 soil samples per year for the years 2005–2017.
plot, all of which had been recorded before from soils in with eight species reaching their highest levels so far
Europe (Guil et al., 2015; Bingemer & Hohberg, 2017). in 2017, the last year of the present study. Hohberg
The time since the beginning of ecosystem (2006) also found significantly higher tardigrade
development had a large influence on the tardigrade abundances in young soils than in 46-year-old areas.
community. The total tardigrade abundance increased As the succession in the dumping substrate of post-
from 2006 until 2009 and has been decreasing since mining sites progresses, the pore sizes also change, and
then. Diversity, in contrast, has increased significantly, the initially loose material compacts over time through
© 2020 The Linnean Society of London, Zoological Journal of the Linnean Society, 2020, 188, 887–899894 J. BINGEMER ET AL.
Table 2. Similarity of tardigrade communities between years as calculated with the Chao–Jaccard–Raw abundance-
based similarity index (Chao et al., 2005; above the diagonal) and the classic Jaccard sample similarity index, which is
based only on the number of species (below the diagonal)
Year 2005 2007 2008 2009 2010 2011 2013 2015 2017
2005 0.001 0.000 0.000 0.077 0.000 0.098 0.097 0.241
2007 0.200 0.990 0.954 0.720 0.110 0.620 0.282 0.267
2008 0.000 0.167 0.902 0.723 0.178 0.554 0.259 0.037
2009 0.000 0.286 0.500 0.923 0.175 0.527 0.252 0.036
2010 0.200 0.429 0.400 0.800 0.167 0.596 0.327 0.260
Downloaded from https://academic.oup.com/zoolinnean/article-abstract/188/3/887/5697459 by guest on 16 May 2020
2011 0.000 0.375 0.333 0.250 0.222 0.813 0.840 0.341
2013 0.200 0.250 0.400 0.500 0.667 0.375 0.969 0.574
2015 0.125 0.300 0.250 0.200 0.300 0.556 0.444 0.933
2017 0.125 0.300 0.250 0.200 0.300 0.400 0.444 0.600
To ensure comparability, only samples from October were compared. Given that samples in 2006 were obtained only in April, we did not include these
data.
Figure 4. Tardigrade body length and proportion of silt and sand in the 27 soil samples from the years 2011, 2013, 2015 and
2017. Boxplot: the box stands for the 25–75% quartiles; the horizontal line corresponds to the median; whiskers correspond
to the largest data points that were within the 1.5× interquartile range; and outliers, i.e. values within the 3× interquartile
range or values outside this range, are shown as circles or asterisks, respectively.
root exudates and other organic substances, thereby specimens). Other larger species, such as Milnesium
reducing the pore size and the space for tardigrades to and Paramacrobiotus, were also present in small
inhabit the soil (Hohberg et al., 2011b). In the present numbers throughout the years, but in general, in the
study, after only 3 years of ecosystem development, period from 2011 to 2017, the mean body size of the
a peak of tardigrade abundance was recorded (in tardigrades tended to decrease, and consequently,
October 2008), owing to the mass development of smaller sized species gained importance in ‘Chicken
a single species, A. confusus. While other groups of Creek’ soils (Fig. 5). The similarity of tardigrade
soil fauna started to build up first populations or to communities increased over time, especially when
develop almost typical densities (Hohberg et al., 2011a; considering species richness.
Elmer et al., 2013), the populations of A. confusus The lack of competition and predation in young
collapsed in the following years, and simultaneously, soils is expected to promote an unregulated growth
the comparably large abundances of tardigrades in of tardigrade populations (Hohberg, 2006). The
the soil habitats at ‘Chicken Creek’ also started to composition of soil fauna generally changes with
increase. The progressive increase of soil particle the development of vegetation. For example, the
size and reduction of the pore space might explain increased growth of vegetation leads to an increase in
the decrease in population of the relatively large root-feeding nematodes (Elmer et al., 2010; Hohberg
A. confusus (maximum body length, 540 µm; N = 2.256 et al., 2011a). This, in turn, can have an influence on
© 2020 The Linnean Society of London, Zoological Journal of the Linnean Society, 2020, 188, 887–899SUCCESSION OF TARDIGRADES IN YOUNG SOILS 895
Downloaded from https://academic.oup.com/zoolinnean/article-abstract/188/3/887/5697459 by guest on 16 May 2020
Figure 5. Environmental factors of the 27 sampling spots on the Chicken Creek throughout the years. A, C/N ratio
(Kruskal–Wallis test: H = 59.33, P < 0.001). B, organic carbon content (Kruskal–Wallis test: H = 178.1, P < 0.001). C, pH
(Kruskal–Wallis test: H = 144.3, P < 0.001). D, vegetation cover (Kruskal–Wallis test: H = 250.5, P < 0.001). Most samples
were obtained in October; additional measurements in spring are marked with ‘sp’. For some years the abiotic data are
not available; these years are excluded from the boxplots. Boxplot: the box stands for the 25–75% quartiles; the horizontal
line corresponds to the median; whiskers correspond to the smallest or the largest data points that were within the 1.5×
interquartile range; and outliers, i.e. values within the 3× interquartile range or values outside this range, are shown as
circles or asterisks, respectively.
tardigrades that interact with nematodes via predation some other studies (Harada & Ito 2006), but not in all
and competition. The contrasting development of (Hohberg, 2006). These contrasting findings might be
the A. confusus population and vegetation growth attributable to the strength of the reported interaction
was particularly striking in the present study. The being dependent on the species under consideration:
abundance of that species was the only abundance to be Macrobiotus species and Diphascon nobilei (Binda,
negatively correlated with both the age of the soil and 1969) were more abundant with low numbers of
development of vegetation. The green intestines of the nematodes (present study), whereas other Diphascon
animals clearly indicated that A. confusus fed on green species co-occurred with high densities of nematodes
algae in the studied soils. Thus, an indirect negative (Harada & Ito, 2006). The role of the respective species
influence on the population growth of A. confusus by in the food web is certainly important, because both
the developing vegetation, the resulting shading of taxa include predators and herbivores. For a detailed
the soil and the subsequent reduction of algal growth, picture, the feeding type of the species of both taxa
is conceivable. The development of vegetation itself should be taken into account. Over time, the soil
showed a strong positive correlation with the age of food webs at ‘Chicken Creek’ became increasingly
succession (see RDA; Fig. 6), making it difficult to complex, and new feeding types appeared (Hohberg
attribute effects to a single factor. et al., 2011a; Elmer et al., 2013). This is also reflected
The total number of tardigrades and the number of in the development of the tardigrade community.
genera, species groups and fully identified species were Most of the species identified so far feed on algae or
correlated with the total abundance of nematodes in our were omnivores. An exception was Paramacrobiotus
study. A significant correlation was also reported from richtersi (J. Murray, 1911) group, in which hatchlings
© 2020 The Linnean Society of London, Zoological Journal of the Linnean Society, 2020, 188, 887–899896 J. BINGEMER ET AL.
Downloaded from https://academic.oup.com/zoolinnean/article-abstract/188/3/887/5697459 by guest on 16 May 2020
Figure 6. Redundancy analysis (RDA) of tardigrade species and environmental factors. Tardigrade species are shown
as red crosses, with abbreviations of names in red. Significant environmental factors (Env) are shown in black, with
time (given in months since the start of the experiment) displayed as an arrow, and significant categories of the ordinal
variable vegetation cover are displayed as centroids (black crosses). Abbreviations: Ac, Apodibius confusus; Dh, Diphascon
higginsi; Dn, Diphascon nobilei; Ea, Eremobiotus alicatai; Hc, Hypsibius cf. convergens; Hm, Hexapodibius cf. micronyx;
Id, Isohypsibius dastychi; Ip, Isohypsibius cf. prosostomus; It, Isohypsibius tuberculatus group; Mh, Macrobiotus hufelandi
group; Mt, Milnesium tardigradum group (sensu Michalczyk et al., 2012); Pr, Paramacrobiotus richtersi group species;
Ro, Ramazzottius aff. oberhaeuseri; Veg 100%, full vegetation cover; Veg 75%, almost complete vegetation cover.
are herbivorous, whereas sexually mature animals sampling, not over a longer period of time. Schuster &
feed mainly on soil animals, e.g. nematodes or rotifers Greven (2007) found a significant positive correlation
(Kosztyła et al., 2016), both of which had been present between rainfall and overall tardigrade abundance,
in the site since the beginning of the study. This but the response of individual species varied from
changed in 2017, with the appearance of Milnesium, positive, through neutral, to a negative correlation.
an exclusively predatory tardigrade that hunts other The result is probably attributable to the resistance
tardigrade species in addition to protozoa, nematodes of some species to dehydration (anhydrobiotic ability).
and rotifers (Baumann, 1964; Nelson et al., 2015). This is also illustrated by the different responses of
Both carnivores, Milnesium and adult P. richtersi, tardigrade species, some of which are adapted to
might have a regulatory function in the soil food web. drier and others to wetter environments. Owing to
However, in the field the development of soil organisms the extraction method commonly used for aquatic soil
depends on many factors, such as nutrient availability, microfauna, in which water is added to the samples,
soil type, pore size and climatic conditions. Given inactive tardigrades return to the active state.
that the reaction of predator and prey abundances to Therefore, it was not possible in the present study
each other is shifted in time (predator–prey cycles), to assess the extent of the activity/inactivity of the
it is difficult to identify predator–prey interactions tardigrades in the soil.
(Hohberg & Traunspurger, 2005, 2009). A great difficulty when working with tardigrades is
Although tardigrades are dependent on water their determination at species level. There is currently
films to be active, former studies did not identify any no complete identification key for eutardigrades.
connection between tardigrades and soil moisture Well-known detailed works on the determination are
(Hohberg, 2006; Harada & Ito, 2006). The soil moisture a key by Ramazzotti & Maucci (1983) and a key by
in our study was determined only for the day of Dastych (1988) to tardigrades of Poland that, owing
© 2020 The Linnean Society of London, Zoological Journal of the Linnean Society, 2020, 188, 887–899SUCCESSION OF TARDIGRADES IN YOUNG SOILS 897
to their age, no longer contain all described species Conclusions
and contain some obsolete species descriptions and The present study creates a significant dataset in
taxonomies. Further difficulties are the important terms of soil tardigrade ecology and provides the first
taxonomic characters that are recognizable only in long-term study in this research field. Within our
individuals mounted on permanent microscope slides. 12 year study period, species replacement is obvious
Another complicating factor is that these can often be in the primary succession of the post-mining site. The
detected reliably only when the animal is mounted in a increase in species diversity indicates that ecological
favourable position, e.g. lying on the side (although this niche diversity also increases over time. Overall, the
problem can be overcome when multiple individuals environmental factors that we measured in our study
of a species are available). For some species, a clear could explain only a part of the spatial variability
Downloaded from https://academic.oup.com/zoolinnean/article-abstract/188/3/887/5697459 by guest on 16 May 2020
determination is possible only via the eggs, which and temporal changes in the tardigrade communities.
is why they are often grouped into species groups, Future research should include laboratory studies and
such as the Macrobiotus hufelandi C.A.S. Schultze, examinations of field populations (e.g. using stable
1834 group and the Paramacrobiotus richtersi group. isotope or fatty acid techniques) to clarify in situ food
These difficulties resulted in limited identifications of sources of different tardigrade taxa and the impact of
some of the species found in the present study (e.g. food availability on the development of populations in
Milnesium or Macrobiotus). Particular uncertainties soil tardigrades. Nonetheless, some findings, such as
arose in the genus Hypsibius. Hypsibius convergens the population decline of the algal feeding A. confusus
and Hypsibius dujardini (Doyère, 1840) are similar, in October 2009, most probably induced by the increase
but they differ by the presence of a distinct septulum, in shading plant cover, and the continuously reducing
which only H. dujardini possesses (see Gąsiorek body size paralleling the pore size, indicate that
et al., 2018). Other authors do not exclude the tardigrade population ecology is much more influenced
presence of a small septulum in some individuals of by environmental parameters than assumed until now.
H. convergens (Ramazzotti & Maucci, 1983). Given This sheds new light on a phylum that is known for its
that some of the animals examined in the present general ability to persist in harsh conditions, a skill
study clearly did not have the septulum, whereas that enables terrestrial tardigrades to colonize young
others had a small granular structure following the soils faster than most other animal groups.
macroplacoids, we designated Hypsibius specimens
with no septulum and with the rudimental septulum
as a single species, H. cf. convergens. However, in
future studies, the use of molecular methods will help ACKNOWLEDGEMENTS
to correct for problems with species identification (e.g. This study is part of the Transregional Collaborative
see Gąsiorek et al., 2018). Research Centre 38 (SFB/TRR 38), which is financially
In many soil and moss habitats, macrobiotid species supported by the Deutsche Forschungsgemeinschaft
are the dominant tardigrade group (Harada & Ito, (DFG, Bonn) and the Brandenburg Ministry of Science,
2006; Hohberg, 2006; Schuster & Greven, 2007; Nelson Research and Culture (MWFK, Potsdam). The authors
& Bartels, 2013). Throughout the entire study period, also thank: Vattenfall Europe Mining AG for providing
Macrobiotus and Paramacrobiotus species were the research site; Astrid König for her help with the
present at the ‘Chicken Creek’, but they were never permanent preparations and for the introduction of the
dominant elements (in 2009 and 2010, their proportion Baermann extraction and the measurement methods
of the total abundance increased slightly). Instead, the for the abiotic parameters; and the Department of Soil
clawless A. confusus, first recorded in 2008, dominated Zoology (and especially the section Nematoda) of the
the tardigrade community over 6 years under study Senckenberg Museum Görlitz for providing abiotic
(2007–2010), despite a sharp decline after 2009. and biotic ‘Chicken Creek’ data from 2005 to 2010 and
Until the end of 2010 the species was dominant, and microfauna extracts up to and including 2016. We also
it is still present in the area today. This is the only acknowledge the anonymous reviewers and the guest
reported mass occurrence of this species in soil until editor Łukasz Michalczyk for their help in revising an
now (Hohberg, 2006). The partial or total absence of earlier version of this manuscript.
claws is considered to be an evolutionary adapation of
soil tardigrades that allows them to move through soil
more easily (Bertolani & Biserov, 1996; Dabert et al.,
2014; Nelson et al., 2015). This seems to be corroborated REFERENCES
by the presence of A. confusus and Hexapodibius cf. Anderson RV, Ingham RE, Trofymow JA, Coleman DC.
micronyx Pilato, 1969 in the young soils at ‘Chicken 1984. Soil mesofaunal distribution in relation to habitat
Creek’ (Hohberg et al., 2011b). types. Pedobiologia 26: 257–261.
© 2020 The Linnean Society of London, Zoological Journal of the Linnean Society, 2020, 188, 887–899898 J. BINGEMER ET AL.
Baumann H. 1964. Über den Lebenslauf und die Lebensweise during initial ecosystem development. Ecosystem
von Milnesium tardigradum Doyère (Tardigrada). Development 2: 97–118.
Veröffentlichungen aus dem Überseemuseums Bremen 3: Gąsiorek P, Stec D, Morek W, Michalczyk Ł. 2018. An
161–171. integrative redescription of Hypsibius dujardini (Doyère,
Bertolani R. 2001. Evolution of the reproductive mechanisms 1840), the nominal taxon for Hypsibioidea (Tardigrada:
in tardigrades—a review. Zoologischer Anzeiger 240: Eutardigrada). Zootaxa 4415: 45–75.
247–252. Gerwin W, Raab T, Biemelt D, Bens O, Hüttl RF. 2009. The
Bertolani R, Biserov VI. 1996. Leg and claw adaptations artificial water catchment ‘Chicken Creek’ as an observatory
in soil tardigrades, with erection of two new genera of for critical zone processes and structures. Hydrology and
Eutardigrada, Macrobiotidae: Pseudohexapodibius and Earth System Sciences Discussions 6: 1769–1795.
Xerobiotus. Invertebrate Biology 115: 299–304. Guidetti R, Altiero T, Rebecchi L. 2011. On dormancy
Downloaded from https://academic.oup.com/zoolinnean/article-abstract/188/3/887/5697459 by guest on 16 May 2020
Bertolani R, Guidetti R, Jönnson IK, Altiero T, strategies in tardigrades. Journal of Insect Physiology 57:
Boschini D, Rebecchi L. 2004. Experiences with dormancy 567–576.
in tardigrades. Journal of Limnology 63: 16–25. Guil N, Hortal J, Sánchez-Moreno S, Machordom A. 2009.
Bingemer J, Hohberg K. 2017. An illustrated identification Effects of macro- and micro-environmental factors on the
key to the eutardigrade species (Tardigrada, Eutardigrada) species richness of terrestrial tardigrade assemblages in
presently known from European soils. Soil Organisms 89: an Iberian mountain environment. Landscape Ecology 24:
127–149. 375–390.
Borcard D, Gillet F, Legendre P. 2011. Numerical ecology Guil N, Rodrigo E, Machordom A. 2015. Soil tardigrade
with R. New York, London, Heidelberg: Springer. ISBN biodiversity with the description of a new eutardigrade genus
978-1-4419-7976-6. and its phylogenetic position. Systematics and Biodiversity
Bröring U, Wanner M (eds.). 2007. Development of biodiversity 13: 234–256.
in the post-mining landscape in the structure of ecology and Hallas TE, Yeates GW. 1972. Tardigrada of the soil and litter
socioeconomics. Aktuelle Reihe 2. Cottbus: Brandenburgische of a Danish beech forest. Pedobiologia 12: 287–304.
Technische Universität Cottbus. ISSN 1434-6834. Hammer Ø, Harper DAT, Ryan PD. 2001. PAST:
Chao A, Chazdon RL, Colwell RK, Shen T-J. 2005. A new paleontological statistics software package for education and
statistical approach for assessing similarity of species data analysis. Palaeontologia Electronica 4: 4.
composition with incidence and abundance data. Ecology Harada H, Ito MT. 2006. Soil-inhabiting tardigrade
Letters 8: 148–159. communities in forests of Central Japan. Hydrobiologia 558:
Dabert M, Dastych H, Hohberg K, Dabert J. 2014. 119–127.
Phylogenetic position of the enigmatic clawless eutardigrade Hohberg K. 2003. Soil nematode fauna of afforested mine
genus Apodibius Dastych, 1983 (Tardigrada), based on sites: genera distribution, trophic structure and functional
18S and 28S rRNA sequence data from its type species guilds. Applied Soil Ecology 22: 113–126.
A. confusus. Molecular Phylogenetics and Evolution 70: Hohberg K. 2006. Tardigrade species composition in young
70–75. soils and some aspects on life history of Macrobiotus richtersi
Dastych H. 1988. Tardigrada of Poland. Monografie fauny J. Murray, 1911. Pedobiologia 50: 267–274.
Polski XVI. Warsaw: Panstwowe Wydawnictwo Naukowe. Hohberg K, Elmer M, Russell DJ, Christian A, Schulz H-J,
Decker H. 1969. Phytonematology. Berlin: VEB Deutscher Lehmitz R, Wanner M. 2011a. First five years of soil food-
Landwirtschaftsverlag. web development in ‘Chicken Creek’ catchment. Ecosystem
Degma P, Katina S, Sabatovičová L. 2011. Horizontal Development 3: 93–114.
distribution of moisture and Tardigrada in a single moss Hohberg K, Russell DJ, Elmer M. 2011b. Mass occurrence
cushion. Journal of Zoological Systematics and Evolutionary of algal-feeding tardigrade Apodibius confusus, in the young
Research 49 (Suppl. 1): 71–77. soils of a post-mining site. Journal of Zoological Systems and
Dunger W, Schulz H-J, Zimdars B, Hohberg K. 2004. Evolutionary Research 49: 62–65.
Changes in collembolan species composition in eastern Hohberg K, Traunspurger W. 2005. Predator–prey
German mine sites over fifty years of primary succession. interaction in soil food web: functional response, size-
Pedobiologia 48: 503–517. dependent foraging efficiency, and the influence of soil
Dunger W, Wanner M, Hauser H, Hohberg K, Schulz H-J, texture. Biology and Fertility of Soils 41: 419–427.
Schwalbe T, Seifert B, Vogel J, Voigtländer K, Zimdars B, Hohberg K, Traunspurger W. 2009. Foraging theory and
Zulka KP. 2001. Development of soil fauna at mine sites partial consumption in a tardigrade–nematode system.
during 46 years after afforestation. Pedobiologia 45: 243–271. Behavioral Ecology 20: 884–890.
Elmer M, Gerwin W, Schaaf W, Zaplata MK, Hohberg K, Iharos G. 1969. The scientific results of the Hungarian soil
Nenov R, Bens O, Hüttl RF. 2013. Dynamics of initial zoological expeditions to South America. 15. Tardigrades
ecosystem development at the artificial catchment Chicken from the collections of the first and second expedition.
Creek, Lusatia, Germany. Environmental Earth Sciences 69: Opuscula Zoologica Budapest 9: 279–289.
491–505. Ito MT, Abe W. 2001. Micro-distribution of soil inhabiting
Elmer M, Hohberg K, Russell D, Christian A, Schulz H-J, tardigrades (Tardigrada) in a sub-alpine coniferous forest of
Wanner M. 2010. Succession of the soil faunal community Japan. Zoologischer Anzeiger 240: 403–407.
© 2020 The Linnean Society of London, Zoological Journal of the Linnean Society, 2020, 188, 887–899SUCCESSION OF TARDIGRADES IN YOUNG SOILS 899
Jost L. 2006. Entropy and diversity. Oikos 113: 363–375. invertebrates in the McMurdo Dry Valleys, Antarctica. Polar
Kaczmarek Ł, Gawlak M, Bartels PJ, Neslon DR, Biology 29: 346–352.
Roszkowska M. 2017. Revision of the genus Pflug W. 1998. Nature and landscape before and after the
Paramacrobiotus Guidetti et al., 2009 with the description mining of lignite, depicted at the Hambach opencast mine
of a new species, re-descriptions and a key. Annales Zoologici in the Lower Rhine bay. In: Braunkohlentagebau und
67: 627–656. Rekultivierung. Berlin, Heidelberg: Spinger, 78–100.
Kaczmarek Ł, Michalczyk Ł. 2017. The Macrobiotus Pilato G, Binda MG. 2003. Hexapodibius christenberryae, a
hufelandi group (Tardigrada) revisited. Zootaxa 4363: new species of tardigrade from North America (Eutardigrada,
101–123. Calohypsibiidae). Zootaxa 140(1): 1–6.
Kosztyła P, Stec D, Morek W, Gąsiorek P, Zawierucha K, Ramazzotti G, Maucci W. 1983. The phylum Tardigrada. 3rd
Michno K, Ufir K, Małek D, Hlebowicz K, Laska A, revised and updated edition. Memorie dell’Istituto Italiano
Downloaded from https://academic.oup.com/zoolinnean/article-abstract/188/3/887/5697459 by guest on 16 May 2020
Dudziak M, Frohme M, Prokop ZM, Kaczmarek Ł, di Idrobiologia 41: 1–1012 (an English translation, edited
Michalczyk Ł. 2016. Experimental taxonomy confirms by C. Beasley may be obtained from D. R. Nelson, East
the environmental stability of morphometric traits in a Tennessee State University, TN, USA).
taxonomically challenging group of microinvertebrates. Scheu S, Ruess L, Bonkowski M. 2005. Interactions
Zoological Journal of the Linnean Society 178: 765–775. between microorganisms and soil micro- and mesofauna.
Leetham JW, McNary TJ, Dodd JL, Lauenroth WK. 1982. In: Microorganisms in soils: roles in genesis and functions.
Response of soil nematodes, rotifers and tardigrades to three Berlin: Springer, 253–275.
levels of season-long sulfur dioxide exposures. Water, Air, and Schuster R, Greven H. 2007. A long-term study of population
Soil Pollution 17: 343–356. dynamics of tardigrades in the moss Rhytidiadelphus
Lehmitz R, Russell D, Hohberg K, Christian A, squarrosus (Hedw.) Warnst. Journal of Limnology 66:
Xylander WE. 2011. Wind dispersal of oribatid mites as a 141–151.
mode of migration. Pedobiologia 54: 201–207. Stec D, Morek W, Gąsiorek P, Michalczyk Ł. 2018. Unmasking
Lehmitz R, Russell D, Hohberg K, Christian A, hidden species diversity within the Ramazzottius oberhaeuseri
Xylander WE. 2012. Active dispersal of oribatid mites into complex, with an integrative redescription of the nominal species
young soils. Applied Soil Ecology 55: 10–19. for the family Ramazzottiidae (Tardigrada: Eutardigrada:
Lisi O, Binda MG, Pilato G. 2016. Eremobiotus ginevrae sp. Parachela). Systematics and Biodiversity 16: 357–376.
nov. and Paramacrobiotus pius sp. nov., two new species of Vattenfall. 2013. Lignite mining in Welzow-Süd. Available
Eutardigrada. Zootaxa 4103: 344–360. at: https://corporate.vattenfall.de/globalassets/deutschland/
Marcus E. 1929. Tardigrada. In: Dr. HG Bronns Klassen und nachhaltigkeit/welzow.pdf
Ordnungen des Tier-Reichs. IV. Abteilung, Buch, 3. Leipzig: Wanner M, Dunger W, Schulz H-J, Voigtländer K. 1998.
Akademische Verlagsgesellschaft. Primary immigration of soil organisms on coal mined areas
Michalczyk Ł, Wełnicz W, Frohme M, Kaczmarek Ł. in eastern Germany. In: Pižl V, Tajovský K, eds. Soil zoological
2012. Redescriptions of three Milnesium Doyère, 1840 taxa problems in central Europe. České Budějovice: Institute of
(Tardigrada: Eutardigrada: Milnesiidae), including the Soil Biology, 267–275.
nominal species for the genus. Zootaxa 3154: 1–20. Wanner M, Elmer M, Bahrt A, Balkenhol B, Düker C,
Morek W, Gąsiorek P, Stec D, Bladgen B, Michalczyk Ł. Hohberg K, Nährig D, Hüttl RF, Xylander WER.
2016. Experimental taxonomy exposes ontogenetic variability 2007. Development of the biodiversity of young soils in the
and elucidates the taxonomic value of claw configuration post-mining landscape of Lower Lusatia. Aktuelle Reihe
in Milnesium Doyère, 1840 (Tardigrada: Eutardigrada: 2. Cottbus: Brandenburgische Technische Universität
Apochela). Contributions to Zoology 85: 173–200. Cottbus. ISSN 1434-6834.
Nelson DR, Bartels PJ. 2013. Species richness of soil and Wardle DA, Bardgett RD, Klironomos JN, Setälä H,
leaf litter tardigrades in the Great Smoky Mountains Van der Putten WH, Wall DH. 2004. Ecological linkages
National Park (North Carolina/Tennessee, USA). Journal of between aboveground and belowground biota. Science 304:
Limnology 72: 144–151. 1629–1633.
Nelson DR, Guidetti R, Rebecchi L. 2015. Phylum Wöllecke J, Elmer M, Anders K, Durka W, Wanner M.
Tardigrada. In: Thorp J, Roger DC, eds. Ecology and general 2007. A changing landscape – natural and anthropogenic
biology: Thorp and Covich’s freshwater invertebrates. settlement of the post-mining landscape of Lower Lusatia –
Amsterdam: Elsevier Inc., Academic Press, 347–380. an introduction. In: Landscape in a changing natural and
Nkem JN, Wall DH, Virginia RA, Barrett JE, Broos EJ, anthropogenic settlement of the post-mining landscape of
Porazinska DL, Adams BJ. 2006. Wind dispersal of soil Lower Lusatia. Aachen: Shaker.
© 2020 The Linnean Society of London, Zoological Journal of the Linnean Society, 2020, 188, 887–899You can also read