FIRST HALF RESULTS 2018 - RegInfo
←
→
Page content transcription
If your browser does not render page correctly, please read the page content below

0

Gran Meliá Palacio de Isora Resort & Spa   Tenerife - Spain

                                                                        WorldReginfo - 7b3a4377-85ba-4a5d-8aaf-3d2b59ae8522
                                                   FIRST HALF RESULTS
                                                              2018
Dear fellow shareholders,
    The first half of 2018 has been a positive period for the travel and hospitality
    industry, with the number of international tourists and the average
    expenditure per traveler increasing at a healthy rate according to recent data
    published by the WTO, which also expects this trend to continue in the
    following years. These positive market dynamics fueled certain regions, such       “We posted a positive set of
    as Spain, that benefitted from the increasing demand and attractiveness of             results that reflect the
    popular touristic destinations that boosted the performance and allowed our        strength and resilience of our
    hotels to further benefit from a constant flow of visitors not only in high
                                                                                            underlying business”
    season, but also in low-volume months.
    In this context, we delivered a positive set of results that reflect the strength and resilience of our underlying
    business, as reflected by the improvements posted by the main financial metrics on a constant currency basis.
    In this regard, O&L RevPAR grew by +4.6% vs H1 2017, being this increase explained not only by price hikes,
    but also by the an increase in occupancy rates, while revenues and EBITDA ex capital gains increased by +0,5%
    and +7,4% respectively despite the fact that a number of our hotels were not fully operative during the period
    due to refurbishments and repositionings. To top it off, EBITDA ex capital gains margins rose by +109 bps
    thanks to the improved profitability levels of our hotels thanks to the costs efficiencies unlocked plus the
    higher contribution of our hotels in ramp up, which reinforces our commitment to increase margins for the
    entire year by over +100 bps. Moreover, our financial situation remained robust and allowed us to carry on
    additional investments in order to increase systemwide profitability and shareholder’s returns, and we
    reiterate our strong commitment to close the year with a Net Debt/EBITDA leverage ratio of 2,0x. All these
    aspects make us optimistic for Q3, the high season in Spain, where we expect to improve past year’s figures.
    On the commercial side, we have been very active implementing innovative and unique marketing actions and
    online campaigns, which combined with the investments carried out recently to boost our digital and IT
    capabilities, allowed us to further penetrate among upper segments and to improve sales through our direct
    channel melia.com, which grew by +7.0% vs H1 2017 and will allow us to close the year with around 70.0% of
    our total sales generated through digital platforms, as well as to increase the number of members of our
    loyalty programme Meliá Rewards up to 10 million, being this aspect critical to own our customers and to
    know more about them, which will allow us to adapt our pricing strategy and to further increase margins.
    Moreover, our B2B platform Meliá Pro has been consistently improving its performance after having optimized
    the relationships with strategic business partners, and in this regard we expect to close the 2016-2018 period

                                                                                                                         WorldReginfo - 7b3a4377-85ba-4a5d-8aaf-3d2b59ae8522
    with an increase in sales of over +50.0%.
    Operationally speaking, we have been focusing on refurbishments and                “NAV per share increased
    repositionings aimed at continue increasing the value of our existing              by +21.3% vs June 2015,
    properties and to further penetrate into premium segments, while at the
                                                                                          reflecting our proven
    same time we remained very active on the development side after having
                                                                                      capacity to generate further
    opened 9 new hotels and signed 10 in attractive destinations benefitting from
    positive market dynamics, such as Cuba, Vietnam and Spain, among others. In        value to our shareholders”
    addition, along with this earnings release, we updated the valuation of our owned assets as part of the update
    that we carry on every three years and our NAV per share increased by +21.3% vs June 2015, reflecting our
    proved capacity to generate further value to our shareholders. Additionally, on the real estate side, in July we
    sold 3 hotels, which generated a net capital gain of €6.6M at EBITDA level and that were part of our non-core
    assets located in Spain to capitalize on the current positive momentum of the real estate market, while in the
    meantime we will continue evaluating potential value-accretive opportunities.
    To conclude, I would like to mention that our sustainable approach when doing business has been widely
    recognized, as shown by the “Business of the Year in Spain” award given by European Business Awards or the
    fact that all of our brands were included in the ranking of the “Most Valuable Brands in Spain” elaborated by
    Brand Finance, being these acknowledgements a motivation to continue collaborating with our stakeholders.

    Yours sincerely,
1   Gabriel Escarrer, Vice Chairman & CEO
FIRST HALF RESULTS 2018
                                                      P&L AND KEY INDICATORS SUMMARY
                        (Million Euros)                                                   June 2018        June 2017 *        % change
                        REVENUES                                                            879.2             899.4            -2.2%
                        Revenues ex capital gains                                           866.6             899.4            -3.6%
                        EBITDAR                                                             238.5             217.7             9.5%
                        EBITDA                                                              155.1             144.1             7.7%
                        EBITDA ex capital gains                                             142.6             144.1            -1.0%
                        EBIT                                                                 97.0              85.1            13.9%
                        TOTAL FINANCIAL PROFIT (LOSS)                                       (13.2)            (28.4)           53.6%
                        EARNINGS BEFORE TAXES                                                82.6              76.1             8.5%
                        NET PROFIT                                                           61.9              57.1             8.5%
                        NET PROFIT ATTRIBUTABLE                                              61.8              57.6             7.2%
                        EPS (€)                                                              0.27              0.25             7.2%
                        REVPAR Owned & Leased (€)                                            82.8             81.2              1.9%
                        REVPAR Owned, Leased & Managed (€)                                   68.0             72.5             -6.2%
                        EBITDAR MARGIN (ex - capital gains)                                 26.1%             24.2%            186 bps
                        EBITDA MARGIN (ex - capital gains)                                  16.5%             16.0%            43 bps

    Note: In order to facilitate a proper comparison with 2018 numbers, 2017 figures have been restated to consider the accounting principles included in IFRS 15.
    Business Performance
    •        Our underlying business has remained strong during the first half of the year, despite the challenging environment
             faced and the negative impact of certain one offs affecting our operations. In this regard, the main financial metrics on a
             constant currency basis posted significant advances vs H1 2017: O&L RevPAR (+4.6%, explained by a combination of
             higher prices and occupancy rates), revenues (+0.5%, despite the closure of certain hotels due to refurbishments and
             repositionings) and EBITDA ex capital gains (+7.4%, with a +109 bps increase margins thanks to the improved
             profitability of our hotels resulting from cost efficiencies).
    •        EPS grew by +7.2% and stood at €0.27, which compares with the €0.25 in the same period last year, despite the fact
             that in H1 2017 a €20.6M capital gain was generated and included in the Profit / (loss) from Associates and JV line of
             our consolidated P&L.
    •        The different marketing actions and online campaigns launched to increase efficiency levels and conversion rates of our
             direct channel continued bearing fruit and boosted melia.com sales, which grew by +7.0% vs the same period last year.
    Debt Management
     •       Net Debt fell by -€13.3M vs December 2017, which contrast with the increase posted in H1 2017. At the end of the
             period, Net Debt stood at +€580.4M. Moreover, we reiterate our strong commitment to close the year with a
             Net/Debt EBITDA leverage ratio of 2.0x.
     •       Financial expenses improved in the period after having posted a -6.5% decline vs the same period last year as a result
             of the lower average interest rate paid (3.2% vs 3.3% in H1 2017) and the lower average gross debt during the period.
             The company is working on lengthening debt maturities, as well as increasing the share of debt denominated in USD,

                                                                                                                                                                     WorldReginfo - 7b3a4377-85ba-4a5d-8aaf-3d2b59ae8522
             which currently represents around 20.0% of total debt (vs 5.0% in 2017).
    Asset Valuation
     •       The updated GAV of our assets rose by +23.2% vs June 2015 valuation to €4.386B (€3.758B assets in full
             consolidation and €628M assets in equity method), while our NAV grew by +21.3% to €15.2 per share.

    Development Strategy
     •       Our global pipeline currently stands at 16k rooms and 63 hotels, which represent around 20.0% of our total
             portfolio. Also, over 85.3% of the rooms have been signed under management contracts. Moreover, during the first
             half of the year we added 9 new hotels to our portfolio, all of them under management contracts (4 in Cuba, 2 in
             Spain, 2 in Vietnam and 1 in Portugal) and disaffiliated 3 (2 in Spain and 1 in Brazil)
     •       Furthermore, during the first half of the year we signed 10 hotels (1 in China, 1 in Thailand, 3 in Vietnam, 1 in UAE, 1
             in Morocco, 1 in Montenegro, 1 in Portugal and 1 in the Caribbean) that will start operations in the future.
    Outlook 2018
     •       For the third quarter of the year, we have positive expectations for the high season when looking at Spanish resorts
             and expect to improve past year’s figures, as reflected by the +4.1% increase shown by OTB sales, with 60.0% of the
             increase explained by occupancy rates. Also, the impact of USD in our operations will be more limited than initially
             expected.
     •       In addition, we still foresee an increase in margins for the entire year thanks to the cost efficiencies unlocked in
             several regions, the higher contribution of our hotels in ramp up and the improved positioning of our brands among
             premium segments. Also, we reiterate our commitment to improve margins by +150 bps on a constant currency
2
             basis and at least 100 bps on a current currency basis, as well as to increase RevPAR in Q3 by a mid-single digit.
1
                                                      REPORT ON HOTELS OPERATION
                                                                                   Paradisus Cancún
                                                                                    Mexico

WorldReginfo - 7b3a4377-85ba-4a5d-8aaf-3d2b59ae8522
FINANCIAL INDICATORS
H1 2018 H1 2017 % H1 2018 H1 2017 %
HOTELS OWNED & LEASED €M €M change MANAGEMENT MODEL €M €M change
Total aggregated Revenues 745.7 763.7 -2.3% Total Management Model Revenues 137.1 144.0 -4.8%
Owned 394.5 422.1 Third Parties Fees 25.4 31.0
Leased 351.2 341.6 Owned & Leased Fees 45.6 47.4
Of which Room Revenues 460.5 457.2 0.7% Other Revenues 66.0 65.6
Owned 206.7 216.3 Total EBITDA Management Model 34.4 34.7 -0.8%
Leased 253.8 240.9 Total EBIT Management Model 33.4 33.1
* Other Revenues in H1 2018 include €34.2M of Corporate Revenues not directly attributable to
EBITDAR Split 197.5 198.9 -0.7%
any specific division. Idem in H1 2017 data by €30.6M.
Owned 117.0 122.9
Leased 80.5 76.0
EBITDA Split 115.1 121.9 -5.6% H1 2018 H1 2017 %
Owned 116.4 122.9 OTHER HOTEL BUSINESS €M €M change
Leased -1.3 -1.0 Revenues 32.4 38.1 -15.1%
EBIT Split 70.5 75.8 -6.9% EBITDAR 2.7 3.5
Owned 86.0 90.2 EBITDA 1.9 3.1
Leased -15.4 -14.4 EBIT 1.4 2.7
MAIN STATISTICS
OWNED & LEASED OWNED, LEASED & MANAGED
Occup. ARR RevPAR Occup. ARR RevPAR
p.p. % % p.p. % %
% € € % € €
change change change change change change
TOTAL HOTELS 71.4% 1.5 115.9 -0.2% 82.8 1.9% 67.2% -0.8 101.2 -5.1% 68.0 -6.2%
TOTAL HOTELS SAME STORE BASIS 72.4% 0.5 117.9 -1.1% 85.4 -0.3% 68.4% -0.7 103.3 -4.9% 70.6 -5.9%
AMERICA 73.9% -0.1 119.6 -8.5% 88.4 -4,6% 72.4% 0.4 120.5 -5.6% 87.3 -5.1%
70.8% 0.9 151.5 -0.9% 107.3 0.4% 69.8% 1.0 150.8 0.4% 105.3 2.0%
WorldReginfo - 7b3a4377-85ba-4a5d-8aaf-3d2b59ae8522
EMEA
SPAIN 70.7% 3.4 99.3 3.0% 70.2 8.1% 69.8% 3.5 99.1 2.7% 69.2 8.1%
MEDITERRANEAN 72.4% -0.8 79.3 5.4% 57.4 4.2% 70.4% -1.3 77.3 2.1% 54.4 0.2%
CUBA - - - - - - 62.5% -8.9 86.8 -19.6% 54.3 -29.7%
BRAZIL 24.3% 1.4 117.9 -31.6% 28.7 66.5% 53.8% 4.1 77.5 -11.3% 41.7 -4.0%
ASIA - - - - - - 58.3% 2.7 69.8 -9.0% 40.7 -4.6%
* Available Rooms H1 2018: 5,564.6k (vs 5,631.0k in H1 2017) in O&L // 11,428.7k (versus 11,378.3 in H1 2017) in O,L&M.
FUTURE DEVELOPMENT
Current Portfolio Pipeline
H1 2018 2017 YE 2018 2019 2020 Onwards TOTAL
Hotels Rooms Hotels Rooms Hotels Rooms Hotels Rooms Hotels Rooms Hotels Rooms Hotels Rooms
GLOBAL HOTELS 321 80,861 315 80,757 15 4,318 17 4,684 20 4,715 11 2,458 63 16,175
Management 120 35,408 112 34,752 12 3,483 13 3,991 14 3,322 11 2,458 50 13,254
Franchised 48 9,743 49 9,812 1 171 1 120 2 264 0 0 4 555
Owned 47 14,272 47 14,340 1 392 0 0 0 0 0 0 1 392
Leased 106 21,438 107 21,853 1 272 3 573 4 1,129 0 0 8 1,974
4
HOTEL MARGINS

                                                             RevPAR by             EBITDAR                              EBITDA
                                  Occup.   ARR      RevPAR               EBITDAR              EBITDAR      EBITDA                       EBITDA
                                                               Price               MARGIN                               MARGIN

                                    %        %        %                     %         bps      Flow           %           bps            Flow
                                                                 %
                                  change   change   change                change    change    Through       change       change         Through

    TOTAL HOTELS OWNED & LEASED   2.1%     -0.2%     1.9%      -7.6%      -0.8%     41 bps      NA          -5.8%       -60 bps            NA

    AMERICA (USD)                 -0.2%    6.6%      6.4%     102.8%      5.7%     +428 bps     NA           5.6%      +390 bps            NA

    EMEA                          1.1%     -0.9%     0.4%     -413.3%     -2.1%    -114 bps     NA          -13.1%      -180 bps           NA

    SPAIN                         5.0%     3.0%      8.1%     37.1%       6.0%     -53 bps     20.0%         6.9%       -10 bps           7.0%

    MEDITERRANEAN                 -0.8%    5.4%      4.2%     117.4%      7.7%     +56 bps     30.0%        14.9%       +20 bps           6.0%

                                                             RevPAR by             EBITDAR                              EBITDA
                                  Occup.   ARR      RevPAR               EBITDAR              EBITDAR      EBITDA                       EBITDA
                                                               Price               MARGIN                               MARGIN

                                    %        %        %                     %         bps       Flow          %           bps             Flow
                                                                 %
                                  change   change   change                change    change    through       change       change         through

    TOTAL HOTELS OWNED & LEASED
                                  0.7%     -1.1%    -0.3%     -310.9%     -4.4%    -38 bps      NA          -9.4%       -110 bps           NA
    SAME STORE BASIS

    AMERICA (USD)                 -2.0%    3.9%      1.8%     202.7%      2.1%     +184 bps     NA           1.7%      +160 bps            NA

    EMEA                          1.0%     -0.1%     1.0%      -5.8%      -5.2%    -159 bps     NA          -14.5%      -190 bps           NA

    SPAIN                         3.5%     1.5%      5.1%     30.1%       2.7%     -61 bps     15.0%         0.5%       -40 bps            NA

    MEDITERRANEAN                 -0.3%    4.1%      3.7%     108.6%      12.7%    +94 bps     32.0%        778.7%     +100 bps          19.2%

                                                                                                                                                  WorldReginfo - 7b3a4377-85ba-4a5d-8aaf-3d2b59ae8522

5
                                                                                                     Calviá Beach The Plaza   Majorca - Spain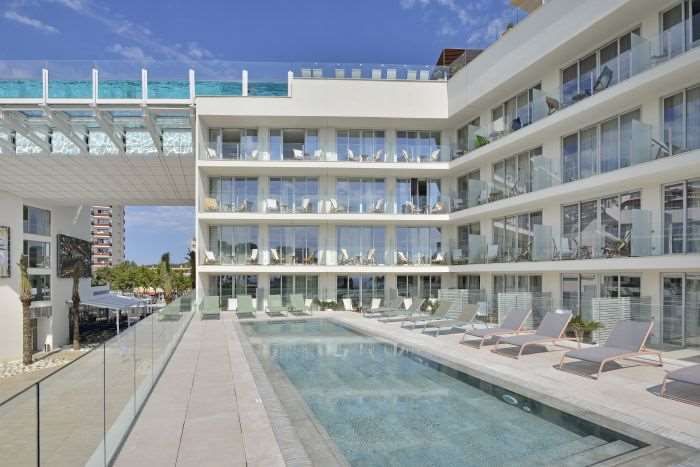
FINANCIAL INDICATORS

                                              H1 2018          H1 2017               %                                                                   H1 2018             H1 2017            %
    HOTELS OWNED & LEASED                       €M               €M                change           MANAGEMENT MODEL                                       €M                  €M             change
    Total aggregated Revenues                 233.3             272.5          -14.4%               Total Management Model Revenues                          31.1             35.7            -13.0%
     Owned                                    218.9             256.3                                Third Parties Fees                                       2.3              2.4
     Leased                                    14.5              16.2                                Owned & Leased Fees                                     16.2             18.7
    Of which Room Revenues                    102.3             115.0          -11.0%                Other Revenues                                          12.6             14.5
     Owned                                     89.9             101.7
     Leased                                    12.4              13.4
    EBITDAR Split                             82.7              87.2               -5.2%
     Owned                                     78.9              84.0
     Leased                                     3.8               3.2
    EBITDA Split                              77.4              81.7               -5.2%
     Owned                                     78.9              84.0
     Leased                                    -1.5              -2.4
    EBIT Split                                63.2              65.2               -3.0%
     Owned                                     64.9              67.6
     Leased                                    -1.6              -2.4

    MAIN STATISTICS

                                                                         OWNED & LEASED                                                            OWNED, LEASED & MANAGED
                                               Occup.                     ARR                       RevPAR                   Occup.                     ARR                      RevPAR
                                                               p.p.                       %                       %                          p.p.                     %                          %
                                                  %                        €                          €                        %                         €                            €
                                                              change                    change                  change                      change                  change                     change
    TOTAL AMERICA                               73.9%          -0.1       119.6         -8.5%        88.4       -4.6%        72.4%             0.4      120.5       -5.6%         87.3         -5.1%
    TOTAL AMERICA SAME STORE BASIS              77.5%          -1.6       121.7         -6.8%        94.2       -8.6%        75.2%             -0.3     121.5       -8.6%         91.4         -9.0%
     México                                     78.1%          1.9        122.0         -8.5%        95.3       -6.2%        76.6%             1.6      129.0       -9.5%         98.8         -7.5%
     Dominican Republic                         77.6%          -5.1       116.9         -5.0%        90.7       -10.9%       77.6%             -5.1     116.9       -5.0%         90.7         -10.9%
     Venezuela                                  43.5%          -1.7       87.2          -39.1%       38.0       -41.4%       43.5%             -1.7     87.2        -39.1%        38.0         -41.4%
     U.S.A.                                     78.5%          -0.7       145.3         -7.9%       114.0       -8.6%        74.6%             0.5      153.3       -5.7%         114.4        -5.0%
    * Available Rooms H1 2018: 1,157.5k (vs 1,241.6k in H1 2017) in O&L // 1,461.7k (vs 1,563.7k in H1 2017) in O,L&M.

    CHANGES IN PORTFOLIO                                                                                                                                                                                 WorldReginfo - 7b3a4377-85ba-4a5d-8aaf-3d2b59ae8522

    Openings between 01/01/2018 – 30/06/2018
    Hotel                                                                          Country / City                              Contract                                          # Rooms
    -                                                                              -                                           -                                                 -
    Disaffiliations between 01/01/2018 – 30/06/2018
    Hotel                                                                          Country / City                              Contract                                          # Rooms
    -                                                                              -                                           -                                                 -

    FUTURE DEVELOPMENT

                                      Current Portfolio                                                                                Pipeline
                                H1 2018                   2017 YE                    2018                     2019                      2020                   Onwards                     TOTAL
                          Hotels     Rooms       Hotels        Rooms       Hotels           Rooms    Hotels          Rooms    Hotels           Rooms    Hotels       Rooms           Hotels    Rooms
    TOTAL AMERICA          27         8,900        27           8,890          2             532          1           498          3              796     2           356              8        2,182
     Management             8         1,856           8         1,850          1             140          1           498          3              796     2           356              7        1,790
     Franchised             2         214             2         214            0              0           0            0           0              0       0              0             0            0
     Owned                 15         6,281        15           6,277          1             392          0            0           0              0       0              0             1           392
     Leased                 2         549             2         549            0              0           0            0           0              0       0              0             0            0

6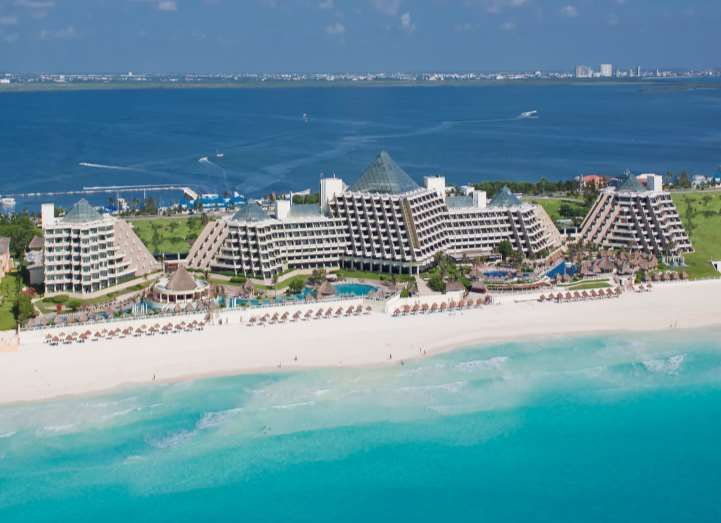
AMERICA 2018 FIRST HALF RESULTS

    •   RevPAR in USD (owned, leased & managed) grew by +1.3% in the quarter vs Q2 2017.
    •   Total fee revenue in USD dropped by -7.5% in Q2 vs the same period last year given the decline in both third parties
        and O&L fees collected as a result of the closure of our hotel in Puerto Rico and the devaluation suffered by the
        Venezuelan Bolivar in the period, among others.
    •   EBITDA (owned & leased) flow through (in USD) deteriorated as a result of the negative effects that a number of one
        offs had in our operations during the period. However, despite the decline in revenues, it must be highlighted that during
        the first half of the year margins (in EUR) significantly improved and rose by +320 bps.
    •   Melia.com sales decreased by -9.8% vs Q2 2017 as a result of the different one offs affecting the division, mainly the
        closure of our hotel in Puerto Rico, and the depreciation of the USD against the EUR, although we are implementing a
        number of commercial actions to revert the situation over the following quarters.

    Our America division posted a positive performance during Q2, with the main metrics of the underlying business improving
    on a constant currency basis. In this regard, our hotels managed to improve profitability as a result of the different initiatives
    implemented on a region-wide basis to optimize our operations. However, it must be highlighted that reported figures have
    been affected by a number of aspects that negatively impacted our results, being the most relevant ones the severe
    depreciation suffered by the USD against the EUR; the political situation in Venezuela, which heavily impacted the
    Venezuelan Bolivar; the effect of Hurricanes Maria and Irma in Puerto Rico, where our hotel will remain closed until late
    2018; as well as by the travel alerts and warnings that affected some areas of the region. All of these aspects come to explain
    the slight decline in revenues vs Q2 2017, but we partially offset them thanks to the higher contribution of certain hotels
    that are still in ramp up, including Paradisus Los Cabos, Innside NY NoMad and ME Miami.
    When looking at specific countries, our hotels located in Mexico struggled during the period as a result of certain insecurity
    issues and a sargassum (seaweed) problem that affected a number of touristic destinations, including Los Cabos and Playa
    del Carmen, plus a tropical storm that slightly impacted our operations in Los Cabos. In the Dominican Republic, the robust
    and increasing demand from international visitors benefitted our hotels and helped us to offset the increase in supply shown
    in the main touristic areas of the country, particularly among lower segments. Finally, in the United States, our three hotels
    Meliá Orlando, Innside NY NoMad and ME Miami benefitted from the increasing demand of both MICE and groups
    segments, while in Jamaica our operations were slightly affected by a travel alert as a result of certain internal security issues.
    Lastly, it is worth mention that we have been actively implementing several commercial initiatives aimed at increasing the
    penetration of our brands and hotels in order to increase volume from different feeder markets, such as Spain, Argentina,
    Brasil, the UK and Mexico, as well as optimizing the benefits of our Meliá Rewards programme to boost direct sales.

                                                                                                                                          WorldReginfo - 7b3a4377-85ba-4a5d-8aaf-3d2b59ae8522
    OUTLOOK
    We remain optimistic for the third quarter of the year in our America division and expect to improve past year’s figures, as
    in Q3 2017 our operations were hit by Hurricanes Irma and Maria plus the earthquake that took place in Mexico, and
    foresee high occupancy rates in both July and August. Furthermore, it must be highlighted that Meliá Caribe Tropical is being
    refurbished and therefore will not be available for sale, thus negatively impacting the expected performance of the hotel.

    PORTFOLIO AND PIPELINE
    We have not added any hotels to our American portfolio during Q2. For the rest of the year, we will open Grand Reserve
    at Paradisus Palma Real (Dominican Republic, owned, 432 rooms) and Tryp Lima (Peru, management, 140 rooms), while in
    the meantime we will continue focusing on improving efficiency levels of our current hotels in order to improve margins
    and searching for potential opportunities in high growth regions benefitting from positive market dynamics.

7
                 Paradisus Los Cabos   Mexico
FINANCIAL INDICATORS

                                              H1 2018        H1 2017             %                                                                   H1 2018            H1 2017            %
    HOTELS OWNED & LEASED                       €M             €M              change            MANAGEMENT MODEL                                      €M                 €M             change
    Total aggregated Revenues                 265.6           260.8            1.8%              Total Management Model Revenues                       26.4              26.3             0.5%
     Owned                                     98.1            99.1                               Third Parties Fees                                    0.6               0.6
     Leased                                   167.4           161.7                               Owned & Leased Fees                                  14.7              14.7
    Of which Room Revenues                    185.7           181.3            2.4%               Other Revenues                                       11.1              11.0
     Owned                                     69.3            69.9
     Leased                                   116.4           111.4
    EBITDAR Split                             61.8            63.1             -2.1%
     Owned                                     23.5            25.7
     Leased                                    38.3            37.5
    EBITDA Split                              25.8            29.5           -12.4%
     Owned                                     23.5            25.7
     Leased                                     2.3             3.8
    EBIT Split                                10.7            14.4           -25.3%
     Owned                                     14.1            16.1
     Leased                                    -3.4            -1.7

    MAIN STATISTICS

                                                                       OWNED & LEASED                                                       OWNED, LEASED & MANAGED
                                                Occup.                  ARR                      RevPAR                   Occup.                ARR              RevPAR
                                                             p.p.                 %                            %                         p.p.               %                               %
                                                   %                     €                         €                        %                     €                 €
                                                            change              change                       change                     change           change                           change
    TOTAL EMEA                                  70.8%         0.9       151.5           -0.9%     107.3       0.4%        69.8%            1.0      150.8      0.4%         105.3          2.0%
    TOTAL EMEA SAME STORE BASIS                 70.9%         0.7       153.0           -0.1%     108.5       1.0%        70.6%            0.9      152.1      0.1%         107.3          1.4%
     Spain                                      69.0%         -1.3      205.3            2.0%     141.8       0.1%        66.2%            -2.6     201.6      1.0%         133.5          -2.8%
     United Kingdom                             70.7%         -2.5      164.0           -0.5%     115.9       -3.9%       70.7%            -2.5     164.0      -0.5%        115.9          -3.9%
     Italy                                      71.3%        71.3       210.4            1.5%     149.9       11.0%       70.4%            6.3      211.1      1.1%         148.5         11.0%
     Germany                                    70.0%         0.4       106.9           -2.1%     74.8        -1.6%       70.0%            0.4      106.9      -2.1%         74.8          -1.6%
     France                                     80.3%        11.3       181.1            2.4%     145.5       19.3%       80.3%            11.3     181.1      2.4%         145.5         19.3%
    * Available Rooms H1 2018: 1,729.9k (vs 1,695.8k in H1 2017) in O&L // 1,883.1k (versus 1,890.7k in H1 2017) in O,L&M.

                                                                                                                                                                                                     WorldReginfo - 7b3a4377-85ba-4a5d-8aaf-3d2b59ae8522
    CHANGES IN PORTFOLIO

    Openings between 01/01/2018 – 30/06/2018
    Hotel                                                                    Country / City                                 Contract                                        # Rooms
    ME Sitges Terramar                                                       Spain / Sitges                                 Management                                      213
    Meliá Setubal                                                            Portugal / Setubal                             Franchise                                       112
    Disaffiliations between 01/01/2018 – 30/06/2018
    Hotel                                                                    Country / City                                 Contract                                        # Rooms
    -                                                                        -                                              -                                               -

     FUTURE DEVELOPMENT

                                      Current Portfolio                                                                            Pipeline
                                H1 2018                 2017 YE                   2018                     2019                     2020                  Onwards                      TOTAL
                         Hotels      Rooms       Hotels      Rooms       Hotels          Rooms    Hotels          Rooms    Hotels          Rooms    Hotels     Rooms            Hotels     Rooms
    TOTAL EMEA             75        12,814        77        13,396        2              209        6             981       8             1,781      0             0             16       2,971
     Management             8          971         10         1,396        1              38         2             288       2                388     0             0             5            714
     Franchised            14         2,027        13         1,915        1              171        1             120       2                264     0             0             4            555
     Owned                 13         3,020        13         3,029        0               0         0              0        0                0       0             0             0             0
     Leased                40         6,796        41         7,056        0               0         3             573       4             1,129      0             0             7        1,702

8
EMEA 2018 FIRST HALF RESULTS
    •    RevPAR (owned, leased & managed) declined in the quarter by a -0.3% vs Q2 2017 as a result of the impact of certain
         hotels that are still in ramp up plus the difficult market conditions in Spain and the UK.
    •    Total fee revenue fell by -1.8% in Q2 vs the same period last year given the lower O&L fees collected.
    •    EBITDA (owned & leased) flow through and margins deteriorated in the second quarter as a result of the increase in
         rentals vs Q2 2017.
    •    Melia.com sales jumped by +11.3% vs Q2 2017 thanks to the higher penetration of the platform among clients and the
         higher conversion rates that resulted from the innovative marketing campaigns recently launched in the region.

    The most significant aspects to mention for each of the countries that are included within our EMEA division are discussed
    below:

    GERMANY/AUSTRIA
    Our hotels located in Germany improved the trend of the first quarter of the year, despite the decline that we witnessed in
    the Berlin market as a result of the bankruptcy of Air Berlin plus the fell in volumes in Dusseldorf due to a lack of significant
    trade fairs. In this regard, we would like to highlight the positive performance of our hotels located in Munich, as well as the
    higher contribution of a number of hotels in ramp up, including Hamburg Hafen, Aachen, Leipzig or Frankfurt Oostend,
    among others. Moreover, the rise shown by melia.com sales in the country has been also important and now represent over
    40.0% of total online sales after having increased by over +14.5% during the quarter vs Q2 2017.
    UK
    The city of London has benefitted from the recovery of national and international demand that started past year. This year,
    we expect this trend to consolidate, although Q2 still has been a no growth quarter not only for our hotels, but also for the
    market. In this regard, and despite the increase in supply, we continued focusing on further penetrating our ME London
    product into premium and luxury segments, as well as on improving the current facilities of Meliá White House, where we
    fully refurbished The Level product in order to adapt it to the needs of our most demanding guests, and that will definitely
    help us to continue increasing both sales and prices in the following months. Also, sales through our direct channel
    melia.com declined by over -4.5% vs Q2 2017.
    FRANCE
    Paris extended the positive trend shown over the past quarters and posted the strongest numbers within the EMEA region,
    with our hotels registering an impressive RevPAR growth of +21.7% during Q2 vs the same period last year, well above STR
    initial expectations for the city. Also, all of our hotels posted RevPAR growth rates of over +14.0%, being a significant
    example Meliá Paris La Defense, which recorded a +22.0% increase vs Q2 2017 due to the recovery of the MICE and

                                                                                                                                        WorldReginfo - 7b3a4377-85ba-4a5d-8aaf-3d2b59ae8522
    transient segments. Moreover, we recovered the occupancy levels that we achieved prior to the 2015 terrorist attacks.
    Going forward, we will continue focusing on quality sales, disintermediation, as well as on increasing the contribution of our
    superior rooms and improving sales through melia.com, which grew +44.2% vs Q2 2017.
    ITALY
    Q2 has been another solid and positive quarter for our hotels located in Italy, as shown by the +5.7% RevPAR growth vs
    Q2 2017, supported on the strong performance of our hotels located in Milano, with Meliá Milan and ME Milan Il Duca
    increasing their RevPAR by +12.0% and +4.5% respectively vs Q2 2017, as well as from the recovery in Rome, where
    RevPAR grew by +2.0% vs the same period last year. Also, our hotels located in Capri, Genova and Campione closed a
    positive quarter, with steady increases of RevPAR ranging from +2.0% to +3.0% vs Q2 2017. Finally, sales through our direct
    channel melia.com rose by over +17.0% vs Q2 2017.
    PREMIUM SPAIN
    Urban: The tough market conditions, particularly in Barcelona, where the destination has not fully recovered from the
    political uncertainties and economic instability, which negatively impacted the transient and mainly the MICE segment, is the
    main cause that explain the decline in RevPAR of our urban hotels in Spain during the quarter vs Q2 2017, despite the
    positive performance of those hotels located in Madrid and Seville, being a significant example Gran Meliá Palacio de los
    Duques (+9.0% RevPAR growth vs Q2 2017), which partially offset the aforementioned negative effects.

9
EMEA 2018 FIRST HALF RESULTS (cont’d)
PREMIUM SPAIN (cont’d)
Resorts: Our Spanish resorts closed the second quarter of the year flat as a result of the unstable weather conditions
suffered by the country over the quarter and the changes shown in demand patterns, where the recovery of certain
destinations, such as Turkey, is having an impact on specific customer segments, particularly in the Canary Islands. On the
positive side, we would like to highlight the performance of ME Sitges Terramar, a hotel that opened recently and thus is
still in ramp up, but that however became very popular due to its unique style and trendiness.
AFRICA
The rest of the hotels that we operate within our EMEA division also posted a positive quarter, being significant examples
Meliá Zanzibar and Meliá Serengeti Lodge, which soon will become a reference hotel for those searching for unique and
unforgettable experiences and safari adventures in a breathtaking environment such as the Serengeti National Park.
OUTLOOK
We have positive expectations for the third quarter of the year in EMEA, as the economic conditions, the stable demand
and the political stability of the region will continue boosting our operations. On a country basis, the main aspects that are
worth mentioning are the following:
In Germany, we are optimistic and expect a mid-single digit RevPAR growth, mainly explained by prices, as a result of the
higher contribution of our hotels in ramp up, while in the UK we foresee a mid-single digit RevPAR growth (in GBP), mostly
via prices. In France, expectations are positive in Paris and we expect a double digit RevPAR growth, of over +20.0%, that
will not only boost our revenues, but the overall profitability of our hotels located in the city. In our hotels located in Italy
we also expect further growth, with RevPAR expected to increase by a mid-single digit vs the same period last year thanks
mainly to the contribution of Rome during its high season. Finally, in Spain we expect to partially offset the recent RevPAR
decline posted by our urban hotels in the following quarters of the year, particularly by taking advantage of the expected
recovery of the main markets, while for our Spanish resorts we expect to improve past year’s figures, as we will launch
different commercial campaigns aimed at offsetting the impact of the lower prices offered by competitors in alternative
destinations.
PORTFOLIO AND PIPELINE
During Q2 we incorporated one hotel to our EMEA portfolio, Meliá Setubal (Portugal, franchise, 112 rooms) that will
increase our footprint in the country, and signed an additional one, Meliá Desert Palm (Dubai, management, 38 rooms) that
we expect to open in Q3 2018 along with Meliá Maputo (Mozambique, franchise, 171 rooms), with the latter being our first
hotel in the country. Going forward, we will continue implementing several actions to better position our hotels among
premium segments, as well as to increase our presence in countries and destinations benefitting from the current positive
WorldReginfo - 7b3a4377-85ba-4a5d-8aaf-3d2b59ae8522
macro environment.
10 Meliá Desert Palm Dubai - UAEFINANCIAL INDICATORS
H1 2018 H1 2017 % H1 2018 H1 2017 %
HOTELS OWNED & LEASED €M €M change MANAGEMENT MODEL €M €M change
Total aggregated Revenues 94.7 89.0 6.4% Total Management Model Revenues 13.7 13.2 4.4%
Owned 30.6 29.9 Third Parties Fees 6.7 6.1
Leased 64.1 59.1 Owned & Leased Fees 5.3 5.0
Of which Room Revenues 62.0 58.6 5.9% Other Revenues 1.8 2.1
Owned 19.1 19.2
Leased 42.9 39.4
EBITDAR Split 14.4 13.3 7.9%
Owned 4.1 4.0
Leased 10.3 9.4
EBITDA Split 1.6 1.6 0.5%
Owned 4.1 4.0
Leased -2.5 -2.4
EBIT Split -4.1 -3.9 -2.8%
Owned 1.2 1.2
Leased -5.3 -5.2
MAIN STATISTICS
OWNED & LEASED OWNED, LEASED & MANAGED
Occup. ARR RevPAR Occup. ARR RevPAR
p.p. % % p.p. % %
% € € % € €
change change change change change change
TOTAL MEDITERRANEAN 72.4% -0.8 79.3 5.4% 57.4 4.2% 70.4% -1.3 77.3 2.1% 54.4 0.2%
TOTAL MEDITERRANEAN
72.0% -0.2 80.4 4.1% 57.9 3.7% 71.5% 0.2 78.3 1.9% 56.0 2.1%
SAME STORE BASIS
Spain 72.4% -0.8 79.3 5.4% 57.4 4.2% 71.8% -1.2 78.0 3.2% 56.0 1.6%
Cape Verde - - - - - - 69.6% 4.3 74.9 -2.2% 52.2 4.2%
* Available Rooms H1 2018: 1,079.8k (vs 1,062.4 in H1 2017) in O&L // 2,398.8k (versus 2,283.2k in H1 2017) in O,L&M.
WorldReginfo - 7b3a4377-85ba-4a5d-8aaf-3d2b59ae8522
CHANGES IN PORTFOLIO
Openings between 01/01/2018 – 30/06/2018
Hotel Country / City Contract # Rooms
Sol Beach House at Meliá Fuerteventura (re-opening) Spain / Fuerteventura Management 142
Disaffiliations between 01/01/2018 – 30/06/2018
Hotel Country / City Contract # Rooms
- - - -
FUTURE DEVELOPMENT
Current Portfolio Pipeline
H1 2018 2017 YE 2018 2019 2020 Onwards TOTAL
Hotels Rooms Hotels Rooms Hotels Rooms Hotels Rooms Hotels Rooms Hotels Rooms Hotels Rooms
TOTAL
81 24,817 76 23,778 3 854 4 1,638 1 308 3 600 11 3,400
MEDITERRANEAN
Management 28 8,904 24 8,131 2 582 4 1,638 1 308 3 600 10 3,128
Franchised 19 5,908 19 5,908 0 0 0 0 0 0 0 0 0 0
Owned 10 2,609 10 2,610 0 0 0 0 0 0 0 0 0 0
Leased 24 7,396 23 7,129 1 272 0 0 0 0 0 0 1 272
11MEDITERRANEAN 2018 FIRST HALF RESULTS
• RevPAR (owned, leased & managed) fell by -3.1% in Q2, although it rose by +4.2% in H1 vs the same period last year,
since Easter took place in March, the weather conditions in the region were unstable during the period and a number of
hotels were partially closed due to refurbishments, which reduced the number of rooms available for sale. Also, the
2018 FIFA World Cup held in Russia during the second half of June caused a severe delay in bookings.
• Total fee revenue rose by +4.5% in the quarter vs Q2 2017 as a result of both the higher third parties and O&L fees
collected.
• EBITDA (owned & leased) flow through and margins were negatively impacted during the quarter by the effect of the
Easter break and the impact of the recovery of alternative destinations, such as Turkey.
• Melia.com sales surged by +20,5% vs Q2 2017 thanks to the strong marketing efforts aimed at improving the selling
process through our direct channel.
Our Mediterranean division posted an increase in both revenues and prices vs the same period last year (O&L). In this
regard, and despite the negative impact in our operations of the recovery in the number of tourists visiting certain
destinations such as Turkey, where hotels have significantly lower prices than in Spain, the flow of visitors coming to Spain
extended the positive trend consolidated in 2017, in which the country became the second most visited country in the
world. Furthermore, it must be highlighted that Q2 figures have been affected by the fact that the Easter Break took place in
the last week of March, in contrast with 2017 when it took place in April, as well as by the refurbishments and
repositionings implemented in certain hotels, such as Meliá Salinas, Sol La Palma and Sol Costablanca, in order to adapt
them to the demanding upper segments.
If we observe specific areas within the region, our hotels located in the Balearic Islands had a positive performance in the
period, as shown by the +5.5% RevPAR growth vs Q2 2017, with both prices and occupancy rates growing at a healthy pace
in Mallorca, Menorca and Ibiza, and despite the slight decline shown by price-sensitive UK and German visitors, which opted
for cheaper alternative destinations.
In the Canary Islands, our resorts struggled in the period and both occupancy rates and prices fell, which resulted in a
RevPAR decline of almost -9.0% vs Q2 2017, since the Easter Break took place in Q1 and Meliá Salinas was partially closed,
thus limiting the number of rooms available for sale. However, in our Coasts hotels prices rose vs the same period last year,
although occupancy rates fell and RevPAR fell by -1.0% vs Q2 2017, as Sol Costablanca and Meliá Costa del Sol were
partially closed during the period and weather conditions did not help at all to our interests.
Finally, the results posted by our hotels located in Cape Verde were also positive, with occupancy rates surging vs Q2 2017,
although prices slightly fell as a result of the not so good as expected contribution of certain hotels that are still in ramp up.
OUTLOOK
WorldReginfo - 7b3a4377-85ba-4a5d-8aaf-3d2b59ae8522
For Q3, which is the strongest quarter of the year for the Mediterranean division, as it represents the high season in Spain
(July, August and September), we have positive expectations for all of the areas and expect a rise in both prices and
occupancy rates. In this regard, OTB sales for the third quarter are +4.1% vs the same period last year, with 60.0% of the
increase explained by occupancy rates, while we have witnessed a decline in the number of clients that book through TOs
that has been offset by an increase in those buying their trips through melia.com and OTAs, being this trend associated with
the shift in demand towards alternative destinations. Furthermore, we are excited with a number of new openings, such as
Sol Marbella Estepona – Atalaya Park and The Plaza Calviá Beach, the brand new landmark project developed in
collaboration with the public sector that will come to transform the Magaluf area with a shopping and leisure complex
comprising a 5.000 sqm mall plus 3 hotels connected through the largest hanging pool in Europe located in the roof, and
that will come to reinforce our presence in the destination and the resilience of our operations, particularly during low
season months.
PORTFOLIO AND PIPELINE
We have not added any additional hotels to our Mediterranean division during this quarter, as we have been focusing on
refurbishments and repositionings aimed at improving our current facilities and adapting them to our new standards.
Moreover, in 2018 we expect to open Meliá Budva Petrovac (Montenegro, Management, 114 rooms), which will be our first
hotel in the country and that will enhance our footprint in a vibrant area with a strong growth potential that has been
recently benefitting from positive market dynamics. Finally, it must be noted that in July we sold Sol La Palma (Santa Cruz de
Tenerife, 473 rooms) and Sol Jandía Mar (Fuerteventura, 294 rooms), although we will continue operating both hotels
under variable lease contracts.
12FINANCIAL INDICATORS
H1 2018 H1 2017 % H1 2018 H1 2017 %
HOTELS OWNED & LEASED €M €M change MANAGEMENT MODEL €M €M change
Total aggregated Revenues 150.6 139.3 8.1% Total Management Model Revenues 17.1 17.1 0.1%
Owned 47.0 36.9 Third Parties Fees 3.4 3.4
Leased 103.6 102.4 Owned & Leased Fees 9.5 8.9
Of which Room Revenues 109.5 101.0 8.4% Other Revenues 4.3 4.7
Owned 28.4 25.6
Leased 81.1 75.4
EBITDAR Split 39.8 37.9 5.2%
Owned 10.5 9.2
Leased 29.3 28.6
EBITDA Split 12.3 11.8 4.2%
Owned 9.9 9.2
Leased 2.4 2.6
EBIT Split 3.2 2.8 11.8%
Owned 5.8 5.3
Leased -2.6 -2.4
MAIN STATISTICS
OWNED & LEASED OWNED, LEASED & MANAGED
Occup. ARR RevPAR Occup. ARR RevPAR
p.p. % % p.p. % %
% € € % € €
change change change change change change
TOTAL SPAIN 70.7% 3.4 99.3 3.0% 70.2 8.1% 69.8% 3.5 99.1 2.7% 69.2 8.1%
TOTAL SPAIN SAME STORE BASIS 70.7% 2.4 95.7 1.5% 67.7 5.1% 69.7% 2.7 96.5 1.2% 67.2 5.2%
Spain 70.7% 3.4 99.3 3.0% 70.2 8.1% 69.8% 3.5 99.1 2.7% 69.2 8.1%
* Available Rooms H1 2018: 1,560.2k (versus 1,556.4k in H1 2017) in O&L // 2,074.6k (versus 2,128.2k in H1 2017) in O,L&M.
WorldReginfo - 7b3a4377-85ba-4a5d-8aaf-3d2b59ae8522
CHANGES IN PORTFOLIO
Openings between 01/01/2018 – 30/06/2018
Hotel Country / City Contract # Rooms
- - - -
Disaffiliations between 01/01/2018 – 30/06/2018
Hotel Country / City Contract # Rooms
Tryp Madrid Getafe Los Ángeles Spain / Getafe Franchise 121
Tryp Mallorca Santa Ponsa Spain / Santa Ponsa Franchise 60
FUTURE DEVELOPMENT
Current Portfolio Pipeline
H1 2018 2017 YE 2018 2019 2020 Onwards TOTAL
Hotels Rooms Hotels Rooms Hotels Rooms Hotels Rooms Hotels Rooms Hotels Rooms Hotels Rooms
TOTAL SPAIN 72 13,744 74 13,996 0 0 0 0 0 0 0 0 0 0
Management 11 3,217 11 3,217 0 0 0 0 0 0 0 0 0 0
Franchised 12 1,468 14 1,649 0 0 0 0 0 0 0 0 0 0
Owned 9 2,362 9 2,424 0 0 0 0 0 0 0 0 0 0
Leased 40 6,697 40 6,706 0 0 0 0 0 0 0 0 0 0
13SPAIN 2018 FIRST HALF RESULTS
• RevPAR (owned, leased & managed) grew in Q2 by +4.7% vs the same period last year thanks to the recovery shown by
the transient, groups and MICE segments plus the higher contribution of recently repositioned hotels.
• Total fee revenue increased by almost +1.0% in the quarter vs Q2 2017 thanks to the higher O&L fees collected.
• EBITDA (owned & leased) flow through and margins were negatively impacted by a -17.0% during the quarter vs the
same period last year.
• Melia.com sales grew by +12.9% vs Q2 2017 as a result of the higher penetration of the platform among customers.
The main highlights for each area within our Spain division for Q2 are discussed below:
CENTRAL AREA – MADRID
Our Madrid hotels posted a mixed performance during the quarter vs Q2 2017, as occupancy rates rose but ARR slightly
declined due to the negative impact of certain international congresses that took place in June 2017 but that however were
not held this year, which affected the overall performance of the MICE segment, plus some bank holidays that took place in
May that worsened the overall figures. However, we partially offset those effects thanks to the good performance posted by
the transient leisure segment and by hotels like Meliá Barajas, Tryp Alameda Aeropuerto, Tryp Cibeles and Tryp Chamartín.
SOUTHERN SPAIN
The positive performance of the Southern Area over the past quarters continued in Q2, with both occupancy rates and
prices growing at a healthy rate. This positive performance has been mainly explained by the MICE segment, which boosted
the results of a number of our hotels located mainly in Seville and particularly during April and May. On the negative side,
the individual segment slightly declined vs the same period last year due to a combination of factors such as the fact that the
Easter break too place in March, the unstable weather conditions during the period and the slightly worse performance
during the Seville Fair, since last year it took place in the same days as the May break in Madrid.
EASTERN SPAIN
The Eastern Area posted an increase in revenues vs Q2 2017 explained by a rise in both occupancy rates and prices.
However, when comparing figures, it must be noted that Innside Palma Bosque was closed in Q2 2017 due to a deep
refurbishment process plus the fact that Meliá Palma Bay opened in April 2017. Having said that, the aspects that explain this
positive performance have been the increasing demand posted by both groups and individual segments, particularly in Palma
de Mallorca, plus the rise shown by the MICE segment, since Palma de Mallorca has become a key destination to held
international and national congresses and corporate events, and even though the unstable situation in Barcelona, which is
negatively impacting the MICE segment, although we expect to offset this impact thanks to the individual segment, for which
we are implementing different online campaigns with OTAs and readjusting our dynamic pricing strategy.
NORTHERN SPAIN & EAST (LEVANTE)
WorldReginfo - 7b3a4377-85ba-4a5d-8aaf-3d2b59ae8522
Both areas, Northern and East-Levante, improved their results in the quarter vs Q2 2017 thanks to the positive evolution
shown by the transient and groups segments, particularly in cities such as San Sebastián, Benidorm and La Coruña, plus the
higher contribution of successfully repositioned hotels, such as Tryp Coruña and Tryp Sebastián Orly. Furthermore, both
MICE and negotiated segments posted an increase in hotels like Meliá Valencia, Meliá María Pita and Meliá Bilbao, and even
though our overall figures were partially affected by the increasing importance of unregulated supply in Alicante.
OUTLOOK
We have positive expectations for our urban hotels located in Spain for Q3. In Madrid, we foresee an increase in revenues
thanks to improved occupancy rates and the higher contribution of hotels such as Meliá Princesa, Meliá Serrano and Meliá
Castilla, despite the drop expected for September in the MICE segment. In Southern Spain, cities like Seville, Malaga and
Cadiz will benefit from higher volumes, while in Eastern Spain our hotels located in Palma will improve past year’s figures
during high season and despite the slight decline expected in Barcelona. Finally, in the Northern and East-Levante area we
also foresee an increase in domestic demand in cities such as Alicante, Valencia and La Coruña thanks to the expected rise
in the leisure demand and the MICE segment in hotels like Meliá Villaitana and Meliá Alicante.
PORTFOLIO AND PIPELINE
In April, we disaffiliated Tryp Mallorca Santa Ponsa (60 rooms) as part of our actively managed portfolio strategy. In the
short term, we do not expect to add any hotels to our urban portfolio in Spain, as we are now focused on adding value to
our existing properties through refurbishments and repositionings aimed at further penetrating into premium segments.
14FINANCIAL INDICATORS
H1 2018 H1 2017 % H1 2018 H1 2017 %
HOTELS OWNED & LEASED €M €M change MANAGEMENT MODEL €M €M change
Total aggregated Revenues N.A. N.A - Total Management Model Revenues 8.9 15.1 -41.2%
Owned Third Parties Fees 8.5 14.9
Leased Owned & Leased Fees 0.0 0.0
Of which Room Revenues N.A. N.A. - Other Revenues 0.4 0.3
Owned
Leased
MAIN STATISTICS
OWNED & LEASED OWNED, LEASED & MANAGED
Occup. ARR RevPAR Occup. ARR RevPAR
p.p. % % p.p. % %
% € € % € €
change change change change change change
TOTAL CUBA - - - - - - 62.5% -8.9 86.8 -19.6% 54.3 -29.7%
TOTAL CUBA SAME STORE BASIS - - - - - - 62.7% -8.5 89.1 -19.5% 55.9 -29.1%
* Available Rooms H1 2018: 2,199.9k (versus 2,186.8k in H1 2017) in O,L&M.
CHANGES IN PORTFOLIO
WorldReginfo - 7b3a4377-85ba-4a5d-8aaf-3d2b59ae8522
Openings between 01/01/2018 – 30/06/2018
Hotel Country / City Contract # Rooms
La Unión San Carlos Cuba / Cienfuegos Management 49
Jagua Cuba / Cienfuegos Management 173
Gran Hotel Camagüey Cuba / Camagüey Management 72
Meliá Colón Cuba / Camagüey Management 58
Disaffiliations between 01/01/2018 – 30/06/2018
Hotel Country / City Contract # Rooms
- - - -
FUTURE DEVELOPMENT
Current Portfolio Pipeline
H1 2018 2017 YE 2018 2019 2020 Onwards TOTAL
Hotels Rooms Hotels Rooms Hotels Rooms Hotels Rooms Hotels Rooms Hotels Rooms Hotels Rooms
TOTAL CUBA 32 12,567 28 12,517 3 1,804 1 142 3 781 0 0 7 2,727
Management 32 12,567 28 12,517 3 1,804 1 142 3 781 0 0 7 2,727
Franchised 0 0 0 0 0 0 0 0 0 0 0 0 0 0
Owned 0 0 0 0 0 0 0 0 0 0 0 0 0 0
Leased 0 0 0 0 0 0 0 0 0 0 0 0 0 0
15CUBA 2018 FIRST HALF RESULTS
• RevPAR in USD (managed) declined by -20.4% in the quarter vs Q2 2017 as a result of a number of aspects negatively
impacting our operations in the country.
• Total fee revenue in USD fell by -44.3% in Q2 vs the same period last year, being this explained by a number of negative
impacts in our hotels during the quarter that will be discussed below.
• Melia.com sales dropped by -42.6% vs Q2 2017 as a result of the negative impact of certain events that affected our
operations, including the different the travel restrictions imposed by the US Government.
Our operations in Cuba extended the slight improvement shown during the first quarter of the year. The main factors that
come to explain the performance during the first half of the year have been the negative impact of Hurricanes Irma and
Maria, as the main TOs reopened the destination with a severe delay, thus limiting our capabilities to properly market our
rooms during the high season. Also, this situation aggravated by the crisis of Cubana de Aviación, that resulted in the
cancelations of all internal and external connections, with the exception of routes from/to Madrid and Argentina.
Additionally, there has been a severe decline in the number of US visitors due to certain imposed travel restrictions that
affected US tourism in the country. To top it off, a number of our hotels, including Paradisus Rio de Oro, Meliá Cayo
Guillermo and Meliá Las Dunas, have been partially closed as a result of different refurbishments and to modernize technical
equipment and facilities, that reduced the number of rooms available during the period.
Considering all the above mentioned aspects, RevPAR (in USD) fell by almost -19.0% vs Q2 2017, being explained by a
severe reduction in both occupancy rates and prices. In this regard, our hotels located in La Habana and Santiago de Cuba
were the ones affected to the most by this situation and closed the quarter with declines in RevPAR of over -30.0%.
Furthermore, sales through our direct channel melia.com dropped particularly as a result of the negative impact that the
reduction in the number of visitors from the United States had in our hotels located in La Habana. In order to recover and
partially offset the deterioration in the figures posted by our hotels we have been working closely with the Cuban
Government and we have launched a set of measures and commercial actions aimed at attracting visitors from alternative
feeder markets, as well as to benefit from the increasing demand of tourists from Spain, Russia and Mexico, plus the
recovery shown by internal demand, which we expect will help us to revert the negative trend of the division by year end.
OUTLOOK
The different factors that have been impacting our operations in Cuba during the first half of the year are expected to
improve the performance of our hotels in Q3. In this context, we foresee a mid-single digit decline in RevPAR (in USD)
explained by prices, as we expect a recovery in occupancy rates vs the same period last year. In addition, it must be noted
that during some weeks of Q3 and the entire Q4 2017 we were negatively impacted by the effects of Hurricane Irma, as 11
of our hotels were closed for a number of weeks.
PORTFOLIO AND PIPELINE
WorldReginfo - 7b3a4377-85ba-4a5d-8aaf-3d2b59ae8522
We have not added any hotels to our portfolio in Cuba during Q2, although we expect to open 3 new hotels in the country
by year end, all of them under management contracts: Meliá Internacional (Varadero, 946 rooms), Paradisus Los Cayos
(Cayo Santa María, 802 rooms) and Meliá San Carlos (Cienfuegos, 56 rooms), that will reinforce our leadership position in
the country in the resorts segment.
16 Meliá Buenavista CubaFINANCIAL INDICATORS
H1 2018 H1 2017 % H1 2018 H1 2017 %
HOTELS OWNED & LEASED €M €M change MANAGEMENT MODEL €M €M change
Total aggregated Revenues 1.5 2.0 -24.2% Total Management Model Revenues 2.2 2.5 -12.6%
Owned 0.0 0.0 Third Parties Fees 1.5 1.7
Leased 1.5 2.0 Owned & Leased Fees 0.1 0.1
Of which Room Revenues 1.1 1.3 -17.2% Other Revenues 0.6 0.7
Owned 0.0 0.0
Leased 1.1 1.3
EBITDAR Split -1.2 -2.7 +56.0%
Owned 0.0 0.0
Leased -1.2 -2.7
EBITDA Split -2.1 -2.7 +23.7%
Owned 0.0 0.0
Leased -2.1 -2.7
EBIT Split -2.6 -2.7 +4.9%
Owned 0.0 0.0
Leased -2.6 -2.7
MAIN STATISTICS
OWNED & LEASED OWNED, LEASED & MANAGED
Occup. ARR RevPAR Occup. ARR RevPAR
p.p. % % p.p. % %
% € € % € €
change change change change change change
TOTAL BRAZIL 24.3% - 117.9 - 28.7 - 53.8% 4.1 77.5 -11.3% 41.7 -4.0%
TOTAL BRAZIL SAME STORE BASIS - - - - - - 55.9% 1.1 76.3 -11.3% 42.6 -9.4%
* Available Rooms H1 2018: 583.7k (vs 74.7k in H1 2017) in O&L // 550.0k (versus 621.6k in H1 2017) in O,L&M.
CHANGES IN PORTFOLIO WorldReginfo - 7b3a4377-85ba-4a5d-8aaf-3d2b59ae8522
Openings between 01/01/2018 – 30/06/2018
Hotel Country / City Contract # Rooms
- - - -
Disaffiliations between 01/01/2018 – 30/06/2018
Hotel Country / City Contract # Rooms
Gran Meliá Nacional de Rio Brazil / Rio de Janeiro Lease 413
FUTURE DEVELOPMENT
Current Portfolio Pipeline
H1 2018 2017 YE 2018 2019 2020 Onwards TOTAL
Hotels Rooms Hotels Rooms Hotels Rooms Hotels Rooms Hotels Rooms Hotels Rooms Hotels Rooms
TOTAL BRAZIL 14 3,150 15 3,563 0 0 0 0 0 0 0 0 0 0
Management 13 3,024 13 3,024 0 0 0 0 0 0 0 0 0 0
Franchised 1 126 1 126 0 0 0 0 0 0 0 0 0 0
Owned 0 0 0 0 0 0 0 0 0 0 0 0 0 0
Leased 0 0 1 413 0 0 0 0 0 0 0 0 0 0
17BRAZIL 2018 FIRST HALF RESULTS
• RevPAR (owned, leased & managed) fell by -1.6% in Q2 vs the same period last year mainly as a result of the devaluation
suffered by the Brazilian Real against the EUR.
• Total fee revenue dropped in the second quarter of the year vs Q2 2017 thanks to the above mentioned currency effect
and the lower amount of O&L fees collected caused by the disaffiliation of Gran Meliá Nacional de Rio.
• Melia.com sales dropped by -9.8% vs Q2 2017 as a result of the depreciation suffered by the Brazilian Real against the
EUR over the period.
The Brazilian economy extended the positive trend of the past year, which combined with political stability promoted a
stable macro environment and increased security levels that benefitted internal demand and the attractiveness of the main
touristic destinations for international visitors. This situation, which is expected to stabilize in the following months, will
continue boosting the hospitality sector, being particularly benefitted the MICE and leisure segments, as business travels will
recover thanks to prosper business conditions while leisure destinations will continue attracting a higher number of tourists.
Having said that, our hotels located in Brazil closed a positive quarter and improved past years’ results on a like-for-like
basis thanks to the higher number of events that took place in the country during April and May, which boosted the MICE
and groups segments. Taking all of this into consideration, we managed to improve both occupancy rates and prices vs the
same period last year, as well as to improve margins and increase the efficiency levels of the division thanks to the different
actions taken to continue optimizing the structure of our operations in the country.
Finally, we would like to highlight the improvement of sales through our direct channel melia.com in local currency thanks
to a number of new initiatives implemented ranging from targeted marketing campaigns aimed at increasing conversion rates
by offering new payment options to our clients to effectively managing our relationships with the main internet providers to
increase the profitability of our operations, as well as to attract a higher number of visitors from specific feeder markets,
particularly Europe.
OUTLOOK
For Q3, and despite that July has been historically a low-volume month for being a vacation period, we foresee an increasing
demand in August. In September, there will be uncertainties as a result of the Presidential Elections that will took place in
October. Furthermore, we would like to remind that our operations will not be negatively impacted by the losses posted by
Gran Meliá Nacional de Rio, as we disaffiliated the hotel and terminated the lease contract at the end of March.
PORTFOLIO AND PIPELINE
We have not added any hotels to our Brazilian portfolio and we do not intend to add any in the short term, as we will
continue focusing on improving the profitability levels of the division, optimizing its current structure, as well as on
WorldReginfo - 7b3a4377-85ba-4a5d-8aaf-3d2b59ae8522
increasing the penetration of our brands to better position ourselves within the bleisure and leisure segments, particularly
among premium clients, as this will increase our resilience levels if the economic cycle enters into a decline period.
18
Meliá Jardim Europa BrazilFINANCIAL INDICATORS
H1 2018 H1 2017 % H1 2018 H1 2017 %
HOTELS OWNED & LEASED €M €M change MANAGEMENT MODEL €M €M change
Total aggregated Revenues N.A. N.A. - Total Management Model Revenues 3.5 3.6 -3.0%
Owned Third Parties Fees 2.4 1.9
Leased Owned & Leased Fees 0.0 0.0
Of which Room Revenues N.A. N.A. - Other Revenues 1.1 1.7
Owned
Leased
MAIN STATISTICS
OWNED & LEASED OWNED, LEASED & MANAGED
Occup. ARR RevPAR Occup. ARR RevPAR
p.p. % % p.p. % %
% € € % € €
change change change change change change
TOTAL ASIA - - - - - - 58.3% 2.7 69.8 -9.0% 40.7 -4.6%
TOTAL ASIA SAME STORE BASIS - - - - - - 62.0% 5.3 81.1 8.2% 50.3 18.3%
Indonesia - - - - - - 53.1% 0.5 62.5 1.1% 33.2 2.1%
China - - - - - - 63.5% 3.2 65.4 -7.8% 41.5 -3.0%
Vietnam - - - - - - 71.4% 14.8 90.0 -8.8% 64.3 15.1%
* Available Rooms H1 2018: 826.7k (versus 704.0k in H1 2017) in O,L&M.
CHANGES IN PORTFOLIO
WorldReginfo - 7b3a4377-85ba-4a5d-8aaf-3d2b59ae8522
Openings between 01/01/2018 – 30/06/2018
Hotel Country / City Contract # Rooms
Lavender Boutique Hotel Vietnam / Ho Chi Minh Management 107
Amena Residences and Suites Vietnam / Ho Chi Minh Management 75
Disaffiliations between 01/01/2018 – 30/06/2018
Hotel Country / City Contract # Rooms
- - - -
FUTURE DEVELOPMENT
Current Portfolio Pipeline
H1 2018 2017 YE 2018 2019 2020 Onwards TOTAL
Hotels Rooms Hotels Rooms Hotels Rooms Hotels Rooms Hotels Rooms Hotels Rooms Hotels Rooms
TOTAL ASIA 20 4,869 18 4,617 5 919 5 1,425 5 1,049 6 1,502 21 4,895
Management 20 4,869 18 4,617 5 919 5 1,425 5 1,049 6 1,502 21 4,895
Franchised 0 0 0 0 0 0 0 0 0 0 0 0 0 0
Owned 0 0 0 0 0 0 0 0 0 0 0 0 0 0
Leased 0 0 0 0 0 0 0 0 0 0 0 0 0 0
19ASIA 2018 FIRST HALF RESULTS
• RevPAR in USD (managed) jumped by +22.6% in the quarter vs Q2 2017 given the higher contribution of a number of
hotels that are still in ramp up.
• Total fee revenue in USD increased by +37.5% in Q2 vs the same period last year due to the positive performance
posted by our hotels and the improved profitability levels.
• Melia.com sales surged by +47.5% vs Q2 2017 as a result of the different initiatives implemented in the region aimed at
improving conversion rates and to increase the penetration of our platform among popular online sites.
The Asian region has remained as an important component for our global operations during the second quarter of the year,
as it not only contributed to a greater extent to our consolidated numbers, but also became an important feeder market for
a number of our hotels located in EMEA and, particularly, in the Caribbean, where we witnessed an increasing demand from
Chinese, Japanese and Korean tourists. This has been possible due to the different targeted commercial campaigns launched
and aimed at increasing the penetration and strength of our brands among upper segments, plus the strong efforts made
over the past months in repositionings and refurbishments in order to adapt our hotels to higher standards and to
sophisticated guests demands. Having said this, and considering that a number of hotels in the region are still in ramp up,
thus affecting the overall performance of the division, we would like to highlight that our managed hotels located in Asia
posted a significant increase in revenues (in USD) and improved profitability levels vs the same period last year.
If we analyze the results on a country basis, our hotels in China closed the second quarter of the year extending the positive
trend shown in Q1, thanks to the fact that all of our hotels in the country are new and modern plus the different initiatives
launched at increasing the penetration and reputation of our brands through further agreements with Ctrip, as well as a
result of long-term strategic agreements with Tier 1 partners, such as Greenland and Greentown, among others. In this
regard, we expect an organic growth of 2-3 hotels per year in order to operate 15 hotels, as well as to have 10 hotels in the
pipeline in the country by 2020.
In Indonesia, our operations in Bali fully recovered from the negative impact of the Agung Volcano eruption that took place
in late 2017 and the destination is operating normally, being this key when explaining the positive performance of our hotels
in the quarter, which increased revenues and profitability vs Q2 2017, while in Vietnam we benefitted from the strong
potential of the country, the increasing number of international visitors and its political stability, which reinforced the
attractiveness of the destination.
In Thailand, the single hotel that we operate in the country closed at the beginning of Q2 in order to fully refurbish and
reposition the property and will re-open in Q3 2019, but however we have positive expectations for our operations in the
country, where we expect to operate 5 hotels by 2021, while in Malaysia and Myanmar our managed hotels recorded
positive numbers and improved past year’s figures.
OUTLOOK
WorldReginfo - 7b3a4377-85ba-4a5d-8aaf-3d2b59ae8522
We have positive expectations for our hotels located in Asia, as Q3 represents the high season of the year and the market
dynamics remain robust in the region, with both leisure demand and the number of international visitors expected to grow
at a healthy rate. In this regard, we expect to improve past year’s numbers in important areas in terms of contribution, such
as China and Bali, as well as a consolidation of the positive performance in Vietnam, which will become a key country for
our operations in Asia over the following years once we incorporate new hotels in Hanoi, Ho Chi Minh and other resort
destinations of the country, that will help us to further penetrate into the resort segment and among upper-end
international clients.
PORTFOLIO AND PIPELINE
For the rest of the year, we intend to open 4 additional hotels in Asia, all of them under management contracts: Meliá Ba Vi
Mountain Retreat (Vietnam, 55 rooms), Meliá Bandung Dago (Indonesia, 254 rooms), Meliá Shanghai Parkside (China, 150
rooms) and Gran Meliá Zhengzhou (China, 388 rooms) and additionally in Q2 we signed Gran Meliá Jincheng Lake Chengdu
(China, 270 rooms), which will come to extend our footprint in the region and to reinforce our leading position in the
leisure and bleisure segments.
20 Sol Beach House Phu Quoc VietnamYou can also read