First Quarter 2021 Economic Summary and Outlook - Vantage ...
←
→
Page content transcription
If your browser does not render page correctly, please read the page content below
First Quarter 2021 Economic Summary and Outlook

The Bureau of Economic Analysis reported that the U. S. economy grew in real terms at an annualized rate of
6.34% in the first quarter of 2021 following a 4.33% rate in the fourth quarter. The implicit price deflator used
to adjust nominal GDP for inflation was 4.07%, representing robust price increases that do not normally occur
in the early phases of an economic rebound. Inflation rates measured by the PCE jumped to 0.6% in the months
of May and again in April with a 3.6% year-over-year inflation rate. A key policy issue will be whether inflation
pressures are transitory or persistent, in which case the Fed will need to reverse its easy money policy course.
Even though inflation expectations are rising in the short term, the bond market continues to price in a moderate
long term inflation rate of around 2.4%.
The recovery from the self-imposed recession will be like no other in history. The economy was strong when
states ordered shutdowns and it may eventually return to the pre-pandemic nirvana of low inflation with trend
growth once the economy opens. A strong rebound may be supported by consumers with over a trillion in savings,
pent-up demand, low interest rates, businesses eager to hire, high equity and housing values, and enormous fiscal
policy support. Outside of small businesses, the economy should emerge from the downturn with far less
permanent damage than from a normal recession. Tailwinds for a recovery include the lowest household debt-
service burdens since 1980 and a high level of consumer sentiment.
Longer term problems may make a prolonged recovery more difficult. The aging workforce and low birth rates
are long term drags on growth. Ample immigration based on merit would be an ideal solution but it is more likely
that chaotic entry of lower skilled immigrants will impose relatively high costs of assimilation. In addition to a
shrinking labor force, the labor force participation rate is only 61.7%. Higher taxes to support transfer programs
rather than capital assets investments will also retard growth over time. A shift to dependence on large
bureaucratic government programs for healthcare, education, housing, and income redistribution may promote
social equity but will come at a high cost in economic performance. Finally, staggering government debt
accumulation is likely to reach a tipping point where debt service poses a serious drag on growth.
Approximately 8 million jobs were lost in the recession and it will take time to return to full employment. With
about 500,000 job gains each month, it will take 16 months to return to pre-COVID employment. This puts a
recovery somewhere near the end of 2022. Housing and equity prices are likely to cool off as interest rates
gradually rise and higher prices dampen demand. Risks to the recovery include new virus strains, serious cyber-
attacks, spiraling inflation from policy missteps, and serious tension with China and Russia. Unless Saudi Arabia
increases oil exports, higher energy prices are likely from higher demand in a recovery and policy moves away
from fossil fuels, such as cancellation of the Keystone pipeline and oil leases in Alaska.
Second quarter growth could be as high as 10% due to increased openings. Price pressures are likely to continue
with monthly price growth of about .5%. Longer term interest rates (10 year) are expected to creep closer to 2%
as investors raise their expectations of longer term inflation. Unilateral passage of another government spending
package with some infrastructure components is likely but the spending effects on the economy will not be felt
until late in 2021 and 2022 when the economy is already well into recovery.

                                                                                                                     1
Is there a Stock Market Bubble?
Stock market prices have had dramatic gains over the past year even though the economy was
largely shutdown. The record high valuation of stocks prompted discussion of a market bubble.
There is no universal agreement on what constitutes a bubble, but part of the definition is a buying
frenzy driving prices beyond what the “fundamentals” support. The latest issue of Quarterly
Financial Accounts of the U. S revealed that U. S. households now hold a larger portion of total
assets in equities than ever before. This condition last occurred before the dot.com bubble in the
late 1990s. From the first quarter of 2020 to the first quarter of 2021, the amount of direct and
indirect holdings of equities increased by $17.7 trillion to a total of $44 trillion. Of the equity
holdings, a little over $580 billion represent net new purchases, which is also the fastest buying
pace on record. The fascination with stocks is at least partially explained by improved corporate
earnings and historically low interest rates, but key measures of market valuation suggest that stock
prices are elevated beyond fundamentals. Proponents of a stock market bubble point to valuation
measures such as Shiller’s CAPE ratio, Buffett’s market capitalization to GDP ratio, and the
market dividend yield.
Shiller’s CAPE
Shiller’s cyclically-adjusted price-earnings ratio (CAPE) is an improvement over the traditional
price-earnings ratio as a measure of valuation. Earnings, which are volatile over a cycle, are
inflation adjusted over the prior 10-year period to create the CAPE. The current CAPE is 37, which
is highly elevated from the CAPE of 28.84 only one year ago. A CAPE as high as 37 has occurred
only once in the 139 year history examined by Shiller and that was in 1998, two years prior to the
ultimate crash. Typical of a bubble, investors in 1998 had early warning of overvaluation but they
stayed in the market believing they will be able to get out in time (a common predictably irrational
behavior for investors). Even when a bubble appears likely it is not clear when to exit the market
and overconfident investors hold on too long. Figure 1 illustrates the history of the CAPE ratio to
include peaks prior to the Great Depression and the dot.com crash. Current CAPE values suggest
overvaluation but the timing of the peak is uncertain.
Figure 1. Shiller’s CAPE History
30 45 37
Source: https://www.multpl.com › shiller-pe
Advocates of the CAPE metric point to a history of peaks in the CAPE followed by bear markets.
The three highest CAPE ratios ever recorded were in 1929, 2000, and now.
2Buffett’s Stock Market Capitalization to GDP Ratio
The ratio of total stock market capitalization to GDP is Warren Buffett’s favorite indicator of
where market valuations stand. The numerator of the ratio is forward looking based on investor
expectations while the denominator measures current performance, much like a PE ratio. The logic
behind using Buffett’s metric is that the ratio of stock market capitalization to GDP is relatively
stable, unlike PE ratios. Over time the Buffett ratio should increase very slowly as technology
improvement leads to greater efficiency. Large swings around the modest long run trend represent
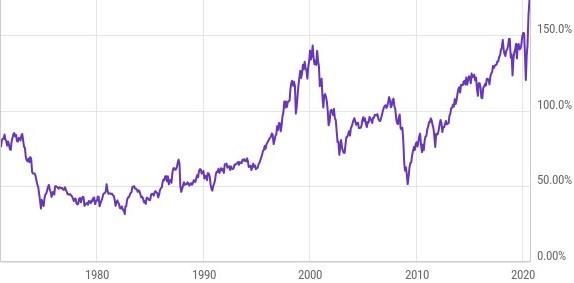
unrealistic expectations behind under and over valuation of stocks. As of June 10, 2021, the
aggregate U. S. equity market value was $52.7 trillion while annualized GDP was $22.6 trillion.
The resulting Buffett indicator is 233%, which is 2.8 standard deviations above the long run
average. This tail event is consistent with extreme overvaluation that occurs in a bubble. Figure 2
illustrates the movement of Buffett’s ratio since 1970.
Figure 2. Warren Buffett’s Market Capitalization to GDP Ratio June 10, 2021
Ratio = 233%
Source: The Motley Fool, Ycharts
Historically low interest rates that have been aggressively managed by the Fed are the key drivers
of current high stock valuations. Low interest rates make stocks attractive, since investors seek
higher returns by taking the riskier asset class. In addition, low interest rates used to discount future
cash flows result in higher present values of stocks. If anything, fundamental cash flows should
remain strong as the economy recovers from lockdowns. Rising interest rates, rather than a
collapse of market fundamentals, will likely be the cause of a market decline. In this case, the
downturn may be more gradual if interest rates move up slowly.
Dividend Yield
The aggregate dividend yield in the stock market divided by the market index price represents the
aggregate dividend yield. While earnings are volatile, dividends tend to be much more stable since
firms tend to smooth dividends and change dividends only when longer run changes occur in
expected earnings. For this reason, the ratio of market dividends per share divided by the market
price per share is a more reliable indicator of valuation changes than the PE. When the market
dividend yield falls beyond a long term benchmark, the inference is that market valuations have
gone too far. A vast amount of academic research suggests that dividend yields may be predictive
3of future returns on stocks. Figure 3 below illustrates the last five years of the U. S. stock market
dividend yield. The rapid decline of the dividend yield to 1.37% from about 2.3% since the
COVID outbreak suggests a stock market overreaction.
Figure 3. Stock Market Dividend Yield over the Last Five Years
Source: https://ycharts.com/indicators/sp_500_dividend_yield
Conclusion
An overvalued stock market is consistent with all three popular measures of market valuation.
Movements in the CAPE, Buffett ratio, and Dividend Yield have been rapid and accelerated.
These moves have not been due to increased cash flows or overly optimistic investors, especially
when the stock price runup occurred during an economic shutdown. Rather, easy money and
historically low interest rates with low inflation have fueled a preoccupation with stock investing.
In a bubble the indicators of overvaluation are evident but investors hold on too long. A
combination of over confidence, reluctance to miss out on the most recently observed returns, and
over emphasis on return with an under emphasis on preserving capital all combine to keep the
bubble going.
In the current situation, the most likely threat to the ultimate downturn will be unexpected high
rates of inflation that lead to escalating interest rates. To some extent, the Fed is on the horns of a
dilemma. On one hand, if the Fed takes preemptive action to quash inflation it may cause the
COVID recovery to stall out. On the other hand, massive government spending programs would
put extreme upward pressure on interest rates if the Fed does not monetize the debt. The Fed
currently views inflation pressure as transitory and is erring on the side of aiding a recovery rather
than dampening inflation. The Fed is playing a dangerous game given the current valuation of
stocks.
4Summary of Key Economic Data
GDP - The economy grew 6.4% in the first quarter of 2021. The level of GDP remains
below the pre-pandemic level as businesses are returning to full capacity from shutdown
conditions. Bottlenecks and supply chain disruptions continue to fuel inflation and hamper
construction. Consumers have benefitted from two rounds of large federal stimulus
spending programs, low interest rates, and continued strength in equity prices. Fixed
investment in equipment, intellectual property, and federal nondefense spending also
contributed to growth. Inventory depletion and international trade were drags on growth.
Growth will pick up in the second and third quarters as the economy reopens, but inflation
pressures are also likely to build.
• Real GDP grew at a 6.4% annualized rate in the first quarter of 2021 following 4.33% and
33.4% growth in the prior two quarters. Durable goods spending contributed 4.9% to the
gain. Relaxation of shutdown and capacity restrictions are setting the stage for a healthier
second quarter growth led by increased spending on services.
• First quarter consumer spending grew at an annualized rate of 7.02% in response to fewer
COVID-related restrictions. Spending is fueled by a combination of high savings, short-
term stimulus transfer payments, and pent up demand.
• Fixed investment provided a boost to growth with a modest 1.77% growth rate. Most of
the investment growth came from nonresidential investment.
• Inventory adjustment created a drag on growth in the first quarter. Final sales, which
exclude the impact on GDP from inventories, gained 9.2% in the first quarter. The
reduction in inventories and associated scarcity will contribute to inflation going forward
unless businesses invest more to rebuild supplies. It remains to be seen whether the
inventory situation is due to poor inventory forecasting or supply constraints that prevented
inventory acquisition. The latter reason would be more inflationary.
• Foreign trade continues to reduce growth and is likely to be drag going forward. The trade
deficit is projected to improve somewhat as global growth improves.
• Table 1 provides detailed information on GDP growth and its components.
5Table 1. Quarterly Growth Rates for GDP and GDP Components
Q1 Q4 Q3 Q2 Q1 Q4 Q3 Q2
2021 2020 2020 2020 2020 2019 2019 2019
Real GDP 6.39 4.339 33.44 - 31.38 - 4.96 2.37 2.57 1.49
Nominal GDP 10.72 6.27 38.5 - 32.82 - 3.38 3.90 4.01 4.13
Consumption 7.02 1.58 25.44 - 24.01 - 4.75 1.07 1.83 2.47
Fixed investment 1.77 3.04 5.39 - 5.27 - 0.23 0.17 0.42 - 0.07
Residential 0.49 1.39 2.19 - 1.60 0.68 0.22 0.17 - 0.08
F Nonresidential 1.29 1.65 3.20 - 3.67 - 0.91 - 0.04 0.25 0.01
Inventories -2.64 1.37 6.57 - 3.50 - 1.34 - 0.82 - 0.09 - 0.97
Net exports -0.87 -1.53 - 3.22 0.62 1.13 1.52 0.04 - 0.79
Government 1.12 -0.14 - 0.75 0.77 0.22 0.42 0.37 0.86
Source: Bureau of Economic Analysis
• Per capital Real GDP offers a scaled measure of U. S. economic performance. Per capital
real GDP reached a peak of $58,490 in the fourth quarter of 2019, before the COVID
lockdown. The economy is making progress but has not yet achieved the post-shutdown
level of economic performance. In the first quarter of 2021real per capital GDP reached
$57,666. The Figure below illustrates the progress of per capital real GDP before and
after the self-imposed recession in the first two quarters of 2020.
Figure 4. U. S. Per Capita Real GDP
Source: Bureau of Economic Analysis / FRED data
Personal Income, Savings, and Sales – Stimulus spending helped drive real disposable
income higher by 61.3% in the first quarter and the saving rate jumped to 21% from 13%
in the prior quarter. Data for April reflect the drop off in income as the stimulus transfer
payments tapered off. Sales data have been volatile, spiking with stimulus payments and
retreating back when stimulus wains. Nevertheless, sales figures remain healthy when
comparing pre-pandemic and post-pandemic data. Overall, data for the first four months
of 2021 are consistent with a sound recovery. Going forward, job gains and growth in
compensation will need to replace income from massive government transfers for a full
recovery.
6• Monthly personal income data are heavily influenced by transfer payments from the
“American Rescue Plan.” About 80% of the $410 billion payments occurred in the
month of March, boosting first quarter personal income data but causing a negative
growth rate in April’s income data.
• The largest component of personal income, compensation of employees, grew 0.9% in both
March and April, consistent with a recovery.
• Transfer payments fell 41.4% in April following a 95.2% gain in March due to stimulus
payments. Some of the aid paid in March is likely to be spent in April and artificially boost
April’s sales data.
• As COVID-related restrictions on rent collection eased, proprietor and rental income
improved. In April, proprietors’ income increased 3.2% following gains of 6.5% and 3%
in the prior two months. Rental income posted a 0.5% gain in April.
• Receipts on assets grew 0.5% in April, the third consecutive monthly increase and sixth in
the last seven months. Interest income increased 0.2% while dividend income grew 1%.
• Table 2 below summarizes monthly changes in personal income and personal income
components.
Table 2. Personal Income and Income Components
Apr Mar Feb Jan Dec Nov Oct Sep
2021 2021 2021 2021 2020 2020 2020 2020
Monthly % Change
Total Personal Income -13.1 20.9 -6.9 10.2 0.7 -0.9 -0.2 0.7
Compensation of employees 0.9 0.9 0.1 0.8 0.7 1.1 1.7 0.7
Wages and salary 1.0 1.0 0.1 0.8 0.8 1.1 1.9 0.8
Supplements to wages 0.6 0.6 0.2 0.8 0.7 0.7 0.8 0.5
Proprietors income 3.2 6.5 3.0 1.6 -4.6 -10.4 0.9 5.1
Rental income 0.5 0.7 0.6 0.6 -0.4 -0.4 -0.5 1.0
Income receipts on assets 0.5 0.3 0.6 -2.7 2.3 1.3 0.7 -0.3
Transfer payments - 41.4 95.2 - 27.4 52.2 1.9 - 3.4 - 5.9 - 0.7
Real Disposable Income - 15.1 22.7 - 8.1 11.2 0.3 - 1.2 - 0.4 0.5
% change year-ago
Total Personal Income 0.5 30.0 5.6 14.3 4.7 4.0 5.5 6.0
Real Disposable Income -4.4 30.2 4.6 14.4 3.7 3.1 4.8 5.2
Savings rate 14.9 27.7 14.7 20.6 14.2 13.1 13.5 14.1
Source: Bureau of Economic Analysis
• The labor market continues to recover. Wages and salaries gained 1% in both March and
April. Supplements to wages and salaries grew 0.6%.
• The personal saving rate remains high, even after the artificial transfer payment boost to
saving in March. April’s saving rate was a healthy 14.9% following a whopping 23.4%
rate in March. Higher spending rates and lower saving rates are expected as more of the
economy opens up in the second quarter. Table 3 shows the monthly changes in the
personal saving rate. Overall, consumers have an estimated level of accumulated savings
in excess of 1.5 trillion dollars.
7Table 3. Personal Saving Rate
Apr Mar Feb Jan Dec Nov Oct Sep
2021 2021 2021 2021 2020 2020 2020 2020
Personal Saving Rate 14.9 27.7 14.7 20.6 14.2 13.1 13.5 14.1
Source: Bureau of Economic Analysis
• Retail sales were flat in April following a stimulus-assisted gain of 10.7% in March and
2.9% decline in February (see table 4). Autos, restaurants, electronics, and drugstores
posted positive gains in sales while apparel and general merchandise stores suffered
declines.
Table 4. Monthly Retail Sales
Apr Mar Feb Jan Dec Nov Oct Sep
2021 2021 2021 2021 2020 2020 2020 2020
Retail & food services (% change) 0.0 10.7 -2.9 7.6 -1.2 -1.4 0.1 2.0
Excluding autos (% change) -0.8 9.0 -2.7 8.3 -2.1 -1.2 0.1 1.6
Excluding autos & gas (% change) -0.8 8.9 -3.2 8.6 -2.9 -1.2 0.1 1.6
Retail & food services (% change year ago) 51.2 29.0 6.5 9.4 2.3 3.8 5.6 6.0
Excluding autos (% change year ago) 40.6 20.4 5.7 8.2 0.6 3.4 4.5 4.9
Excluding autos & gas (% change year ago) 37.6 19.1 6.2 9.8 2.0 5.6 6.6 6.9
Source: U.S. Census Bureau
• Year-over-year sales growth of 51.2% in April is deceptive since prior year sales were
dismal during the peak of COVID closures. Overall, sales will pick up as the economy
becomes fully open and pent up demand for goods and services boost purchases.
• Month-to-month sales volatility is due to the timing of stimulus checks and unemployment
benefits along with on and off shutdowns/quarantines as COVID infection rates changed.
Going forward, sales will stabilize around more fundamental economic conditions.
• The change in sales from pre-COVID periods offers a more realistic view of growth. Total
sales were up 10% on an annual basis compared with April 2019, sales. On a two year
basis, only department stores had lower sales while restaurants posted a small gain.
Production and Manufacturing – A global shortage of semiconductors created
bottlenecks and disrupted U.S. manufacturing growth in the first quarter. Even so,
production and manufacturing held up in the face of a transition to an economic expansion.
Businesses will need to boost inventories going forward and added government spending
in some form of an “infrastructure-plus” program is likely to boost production.
• Factory orders fell 0.6% in April following an upwardly revised 1.4% gain in March.
Much of the decline in orders occurred in transportation.
• Inventories expanded 0.3% in April following a 0.8% increase in March.
• Industrial production rose 0.7% in April. Revisions now show that industrial production
in March gained 2.4% and fell 3.5% in February. Overall, industrial production remains
2.7% below the pre-pandemic level.
8• Manufacturing industrial production rose 0.4% in April following a 3.1% gain in March
and 4% drop in February.
• Total capacity utilization rose from 74.4% in March to 74.9% in April. Manufacturing
capacity utilization rose from 73.8% in March to 74.1% in April.
• Table 5 provides a summary of monthly data on total production and manufacturing.
Table 5. Industrial Production and Manufacturing Growth my Month
Apr 21 Mar 21 Feb 21 Jan 21 Dec 20 Nov 20 Oct 20
Total Industrial Production (% change) 0.7 2.4 -3.5 0.9 1.1 0.9 1.1
Manufacturing (% change) 0.4 3.1 - 4.0 1.2 0.7 0.9 1.5
Durable goods (% change) - 0.4 3.2 -3.1 1.8 0.4 1.2 1.3
Nondurable goods (% change) 1.3 3.2 -5.2 0.6 1.3 0.8 1.6
Mining (% change) 0.7 8.9 -9.5 2.2 0.8 3.6 -1.7
Utilities (% change) 2.6 -9.0 7.8 -3.1 3.8 -2.5 1.5
Capacity utilization (%) 74.9 74.4 72.7 75.3 74.7 73.9 73.2
Manufacturing (%) 74.1 73.8 71.6 74.6 73.7 73.1 72.4
Source: Federal Reserve Bank of St. Louis, FRED
• The ISM manufacturing index increased from 60.7 in April to 61.2 in May. The details
were mixed as new orders increased and backlog orders hit a record high. The prices-paid
index dipped but remains high. The ISM manufacturing index (PMI) is based on a survey
of purchasing managers at more than 300 manufacturing firms and serves as a key indicator
of economic activity.
• The prices paid component of the PMI indicator has increased significantly over the past
two quarters. The index was 65.5 in October of 2020 and reached 89.6 in April of 2021.
Higher PMI costs will ultimately lead to higher consumer prices.
• Corporate profits were 12.7% higher on a year-ago basis in the first quarter. Pre-tax profits
as a share of GDP, an approximate measure of corporate profit margins, fell to 10.4% in
the first quarter. For now, businesses are absorbing costs due to rising commodity prices
and supply-chain problems.
Labor Market and Employment - The May employment report was more upbeat than the
April report. Payroll employment increased by 559,000 in May compared to a lower than
expected 278,000 gain in April. Jobs are plentiful but continued fear of the virus, child
care issues, extended unemployment benefits, historic levels of savings, banked stimulus
benefits, and lags in filling openings all contribute to a sluggish employment rebound. The
unemployment rate fell to 5.8% in early May, aided by a decline in the work force
participation rate. While productivity gains are good, increases in compensation are
outweighing increases in hours worked, resulting in rising unit labor costs. A surge in job
openings and voluntary quits in April suggest that labor shortages will put pressure on
wages and prices
9• Average weekly hours remained flat at 34.9 for a third straight month in April. Longer
hours suggest that employers are using labor more intensively rather than expanding
payrolls.
• The unemployment rate fell 0.3% to 5.8%, but data problems might lead to a revision.
Approximately 7.7 to 8 million jobs would need to be created for the economy to return
to the pre-virus labor market.
• Average hourly earnings for all workers has been volatile. The relatively low gain in hourly
earnings reflects job gains in lower-paying service industries as the economy improves.
Table 6 provides monthly employment data.
Table 6. Employment Data (Seasonally Adjusted)
May Apr Mar Feb Jan Dec Nov Oct
2021 2021 2021 2021 2021 2020 2020 2020
Nonfarm payrolls, change, thousands 559 278 785 536 233 -306 264 680
3-mo MA of nonfarm payrolls 541 533 518 154 64 213 553 993
Ave. hourly earnings, all employees, % change 0.5 0.7 -0.1 0.3 0.0 1.0 0.3 0.1
Ave. workweek, all employees, hours 34.9 34.9 34.9 34.6 35.0 34.7 34.8 34.8
Unemployment rate, % 5.8 6.1 6.0 6.2 6.3 6.7 6.7 6.9
Labor force, change, thousands -53 430 347 50 -406 31 -182 640
Labor force participation rate, % 61.6 61.7 61.5 61.4 61.4 61.5 61.5 61.6
Source: Bureau of Labor Statistics
• Figure 5 illustrates the time line of the U2 unemployment rate over the last five years. an
additional reduction of about 2.5% is required to return to the pre-pandemic level of
unemployment. It will take about 7.5 million additional jobs to achieve this goal.
Figure 5. U.S. Unemployment Rate (U2 last five years)
Source: Bureau of Labor Statistics
• As COVID-19 concerns abate and workers return to more normal working conditions, U.S.
productivity should improve. In the first quarter of 2021 productivity increased 5.4% at an
annualized rate. Nonfarm business output increased 8.6% at an annualized rate in the first
quarter while hours worked rose 3%.
• Unit labor costs increased 1.7% at an annual rate in the first quarter of 2021 as
compensation per hour exceeded output per hour. Table 7 summarizes the quarterly data
on productivity and unit labor costs.
10Table 7. Annualized Percent Change in Output, Compensation, and Unit labor Costs
Q1 Q4 Q3 Q2 Q1 Q4 Q3
2021 2020 2020 2020 2020 2019 2019
Nonfarm businesses
Output per hour 5.4 -3.8 4.2 11.2 -0.8 1.6 0.5
Compensation per hour 7.2 9.7 -5.8 24.4 9.0 3.5 -0.1
Unit labor costs 1.7 14.0 -9.6 11.9 9.8 1.9 -0.6
Source: Bureau of Labor Statistics
Sentiment and Confidence – Improved confidence is expected as the economy begins to
open up again. While there are good reasons to be cautious, consumers on balance are
focused on the prospects of a recovery with ample spending power from high levels of
savings, low interest rates, and strong asset values. Clear signals of continued fiscal and
monetary easing also tend to tip the balance in the favor of optimism. Different measures
of sentiment often follow each other. Both the University of Michigan and Conference
Board Sentiment Indexes are currently close to their longer term means.
• The University of Michigan consumer sentiment index for April was 88.3 following an
index of 84.9 in March and 76.8 in February. Overall, confidence measured by the
University of Michigan index is 13 points below the level in February 2020, but remains
near the long run mean. Confidence is also at its highest level since February 2020.
• Inflation expectations from the University of Michigan survey were mixed. The
consensus (median) inflation expectation for the one year ahead window was 3.4% but the
five-year expectation fell to 2.7%. The survey results are consistent with a view that the
Fed will temporarily allow higher inflation to support a recovery but Fed policy will seek
lower inflation in the longer run.
• Table 8 summarizes the University of Michigan Consumer Sentiment data.
Table 8. University of Michigan Consumer Sentiment Survey (Index = 100 in Q1 1966)
Apr Mar Feb Jan Dec Nov Oct
2021 2021 2021 2021 2020 2020 2020
Overall Index 88.3 84.9 76.8 79.0 80.7 76.9 81.8
Change in the Index 3.4 8.1 -2.2 -1.7 3.8 -4.9 1.4
Inflation expectations
1-yr (%) 3.4 3.1 3.3 3.0 2.5 2.8 2.6
5-yr (%) 2.7 2.8 2.7 2.7 2.5 2.5 2.4
Source: University of Michigan,
• The Conference Board Consumer Confidence Index fell from a revised 117.5 in April to
117.2 in May. Overall, confidence improved in the first quarter as consumers gained
confidence in the COVID vaccine. The assessment of current conditions improved but
consumer expectations fell. Table 9 outlines monthly Consumer Conference data.
11Table 9. Conference Board Consumer Confidence Index (Index = 100 in 1985)
May Apr Mar Feb Jan Dec Nov Oct
2021 2021 2021 2021 2021 2020 2020 2020
Overall Index 117.2 117.5 114.9 95.2 87.1 87.1 92.9 101.4
Present conditions Index 144.3 131.9 119.4 95.0 85.5 87.2 105.9 106.2
Expectations Index 99.1 107.9 111.9 95.4 88.1 87.0 84.3 98.2
Source: Conference Board
• The Conference Board’s Leading Economic Index increased 1.6% from March to April.
The April index of 113.3 surpassed the February 2020 index, suggesting that a full recovery
is likely going forward.
• The gain in the leading indicators was broad-based. Of the ten indicators in the
composite index, eight increased while two were unchanged.
Inflation – The personal consumption expenditure deflator (PCE) increased 0.6% in both
March and April. Food prices were up 0.3% after rising 0.2% in each of the prior two
months. Excluding food and energy, the core PCE deflator increased 0.7% in April. On a
year ago basis, the PCE gained 3.6% while the core gained 3.1%. While the trend is
clearly ahead of the announced 2% Fed target. The Fed will error on the side of
interpreting rising inflation pressure as a transitory artifact of supply chain constraints
and COVID-related bottlenecks. The Fed’s priority is to aid an economic recovery by
monetizing the growing fiscal policy debt and keeping interest rates low.
• Table 10 summarizes the monthly movement of the PCE inflation measure. Annualized
inflation rates jumped in April. It remains to be seen whether this is a trend linked to
excessive monetary and fiscal stimulation or a temporary blip due to bottlenecks.
Table 10. Personal Consumption Expenditure (PCE) Inflation Monthly Data
Apr Mar Feb Jan Dec Nov Oct
2021 2021 2021 2021 2020 2020 2020
PCE (% change) 0.6 0.6 0.3 0.3 0.4 0.0 0.0
Core PCE (% change) 0.7 0.4 0.1 0.2 0.3 0.0 0.0
PCE (% change year-ago) 3.6 2.4 1.6 1.4 1.2 1.1 1.2
Core PCE (% change year-ago) 3.1 1.9 1.4 1.4 1.4 1.3 1.4
Source: Bureau of Economic Analysis
• The headline consumer price index (CPI) increased slightly more than the PCE index. The
CPI rose 0.8% in April and 4.2% on a year-ago basis. Excluding food and energy prices,
the core CPI jumped 0.9% in April and 3% from a year-ago. Table 11 provides a monthly
summary of inflation data for the CPI. A few months of high inflation rates are likely to be
dismissed by the Fed as transitory distortions linked to the COVID shutdown.
12Table 11. Monthly Consumer Price Index (CPI)
Apr Mar Feb Jan Dec Nov Oct Sep
2021 2021 2021 2021 2020 2020 2020 2020
CPI (% change) 0.8 0.6 0.4 0.3 0.2 0.2 0.1 0.2
Core CPI (% change) 0.9 0.3 0.1 0.0 0.0 0.2 0.1 0.2
CPI (% change year-ago) 4.2 2.6 1.7 1.4 1.3 1.1 1.2 1.4
Core CPI (% change year-ago) 3.0 1.6 1.3 1.4 1.6 1.7 1.6 1.7
Source: Bureau of Labor Statistics
• Using the “10-year break-even” inflation rate methodology, based on the current yield for
a 10-year treasury and a 10-year treasury inflation protected bond, the expected increase
in the CPI over the next decade is 2.48%.
• The producer price index for final demand rose 0.6% in April following increases of 1%
in March, 0.5% in February, and 1.3% in January (see Table 12). April was the fifth
consecutive monthly increase in the PPI. Inflation pressures are increasing as the economy
opens but it remains to be seen if these pressures persist throughout the year.
Table 12. Producer Price Index Data
Apr Mar Feb Jan Dec Nov Oct Sep
2021 2021 2021 2021 2020 2020 2020 2020
Final demand (% change) 0.6 1.0 0.5 1.3 0.3 0.0 0.6 0.3
Final demand ($ change year-ago) 6.1 4.3 2.8 1.8 0.8 0.8 0.6 0.3
Source: Bureau of Labor Statistics
Housing - House prices accelerated in April with a 13% year-over-year gain. The
inventory of existing homes reached the lowest level since the late 1990s with only 2.4
months of supply at the current sales rate. Homes are selling above asking price in most
markets. The demand for housing is fueled by record lows in mortgage rates coupled with
high accumulated savings and high equity values. COVID-related supply constraints in
building materials have prevented a healthy rebound in housing construction and
prompted high replacement costs for housing.
• The CoreLogic Home Price Index rose 13% year over year in April. Monthly house price
appreciation was 2.1%. The index level in April matched its April 2006 peak. The table
below summarizes monthly percentage changes in the index.
Table 13. CoreLogic U. S. House Price Index (Monthly % Change)
Apr Mar Feb Jan % change Peak % change
2021 2021 2021 2021 yr. ago from peak
Single-family Housing 2.1 2.2 1.2 0.7 13.0 Apr-2006 0.0
Source: S&P Dow Jones Indices LLC, fred.stlouisfed.org
• The Housing Price Index (HPI) is published by the Federal Housing Finance Agency using
monthly data supplied by Fannie Mae and Freddie Mac. The index is based on transactions
in conventional and conforming mortgages and measures average price changes in repeat
13sales. Overall, the HPI measure offers an additional indicator of housing price movement.
Figure 6 below illustrates the steep runup in housing prices before and after the great
recession in 2009.
Figure 6. All-Transactions House Price Index for the U.S. (1980 Index = 100)
Source: U.S. Federal Housing Finance Agency, fred.stlouisfed.org
• Supply-side constraints have been a key driver of upward pressure on home prices. Total
existing-home inventory was 1.12 million units in April, near its all-time low recorded in
March. In addition, input costs for homebuilders are up substantially over the year,
including lumber, cement, labor and land prices. Rather than a bubble, higher housing
prices are driven by supply shortages.
• Lower “real” mortgage rates, approximated by the difference in nominal mortgage rates
and inflation, have been a key driver of higher prices for houses over time. Figure 7
illustrates the narrowing spread between nominal mortgage rates and inflation rates since
1980.
Figure 7. Mortgage and Inflation Rates
Mortgage rate Inflation rates Source: fred.stlouisfed.org
• Even as home prices are rising and the inventory of homes is shrinking, pending home
sales are falling. The National Association of Realtors (NAR) pending home sales index
fell 4.4% to 106.2 in April from 111.1 in March and 123.4 at the start of the year. The
April index is the lowest since May of 2020. Higher home prices appear to be eroding
overall demand (see table 14).
14Table 14. Pending Home Sales Index (2001 = index of 100)
Apr Mar Feb Jan Dec Nov
2021 2021 2021 2021 2020 2020
U.S. Index 106.2 111.1 109.2 123.4 126.4 125.8
3-mo MA 108.8 114.6 119.7 125.2 126.4 126.6
U.S. (% change) -4.4 1.7 -11.5 -2.4 0.5 -0.9
U.S. (% change year ago) 51.7 23.0 -1.4 13.5 20.8 16.8
Source: National Association of Realtors, fred.stlouisfed.org
U. S. International Trade – The U. S. trade balance will likely be a smaller drag on second
quarter growth than in the first quarter. Improved global economies due to increased
vaccinations should help boost demand for U. S. goods while U. S. consumers are likely to
shift demand from goods to domestic services as the economy opens up fully.
• The advance nominal goods deficit fell from $92 billion in March to $85.2 billion in April.
Nominal goods exports were up 1.2% in April while imports fell 1.2%. The improvement
in the trade balance is likely to continue for the second quarter. The table below shows the
monthly trade balance data.
Table 15. U. S. International Trade in Goods (advanced data)
Apr Mar Feb Jan Dec Nov Oct
2021 2021 2021 2021 2020 2020 2020
Balance (billions of $s)
Goods Balance -85.2 -92.0 -88.2 -84.4 -83.2 -86.1 -80.4
Exports 144.7 143.0 130.0 135.5 133.2 127.4 126.2
Imports 229.9 235.0 218.2 219.9 216.4 213.5 206.6
Source: U. S. Census, www.census.gov/foreign-trade/balance
• Nominal goods exports increased 1.2% in April while nominal goods imports fell
2.2%.
• On a year-ago basis, nominal exports increased 50.4% in April while imports
increased 37.2%. Low 2020 base data due to the COVID shutdown skew the year-
over-year growth rates.
• As the U. S. economy improves the trade balance will again widen and become a
larger drag on growth.
Selected Global Issues
• Tension between the U. S. and China is at a high level. Beyond trade relationships, tensions
are now building with respect to the origin and lack of openness about the COVID virus,
technology and intellectual property theft, Hong Kong, human rights, computer hacking,
and interference in U. S. elections.
15• The dollar lost ground to the yuan during COVID to the point that questions are being
raised about China’s currency manipulation. Figure 8 illustrates the dollar/yuan exchange
rate movement since 2016 and the yuan appreciation since May 2020.
Figure 8. U. S. Dollar per Yuan since 2016
Source: www.xe.com/currencycharts/?from=USD&to=CNY
• The Euro appreciated relative to the U. S. Dollar during COVID. The dollar automatically
weakens when the euro strengthens. The euro makes up 57.6% of the value of the U.S.
dollar index due to the volume of trade and capital flows between the two countries. The
lower value of the dollar tends to make U. S. exports more attractive but makes investments
in the U. S. less attractive. Figure 9 illustrates the appreciation of the Euro since 2020
(depreciation of the dollar).
Figure 9. U. S. Dollar per Euro Exchange Rate
Source: www.xe.com/currencycharts/?from=USD&to=CNY
• China has been experimenting with a digital yuan and is slowly pushing for a digital
sovereign currency. The move to a digital sovereign currency would modernizing China’s
domestic payment system creating efficiency in payments and reduce costs. China
maintains that the purpose of digitalization of the yuan is not designed to replace the U. S.
dollar as a global reserve and payment currency. Nevertheless, digitalization of the yuan
that leads to increased internationalization of yuan transfers could threaten the dominance
of the U. S. dollar in global commerce.
16• The European Commission upgraded its forecasts for the Euro region, predicting growth
of 4.2% for 2021. Germany’s economy is forecast to grow 3.4% this year.
• Global growth projections vary widely based on the source. The International Monetary
Fund predicts a 6% global growth for 2021 and 4.4% in 2022. While the growth rates
appear good, they are calculated from a very low base.
While the information contained in this document is believed to be reliable, no guarantee is given that it is accurate or complete. Vantage Consulting
Group, Inc. and its directors and employees disclaim all liability of any kind whatsoever in respect of any error or omission or misstatement, whether
or not negligent, contained in this document and any person receiving this document should rely and act on it only on that basis and entirely at
his/her own risk. Questions and inquiries may be directed to Jerry L. Stevens, Professor of Finance, E.C. Robins School of Business.
17You can also read